Abstract
Three dimensional image reconstruction for multi-modality optical spectroscopy systems needs computationally efficient forward solvers with minimum meshing complexity, while allowing the flexibility to apply spatial constraints. Existing models based on the finite element method (FEM) require full 3D volume meshing to incorporate constraints related to anatomical structure via techniques such as regularization. Alternate approaches such as the boundary element method (BEM) require only surface discretization but assume homogeneous or piece-wise constant domains that can be limiting. Here, a coupled finite element-boundary element method (coupled FE-BEM) approach is demonstrated for modeling light diffusion in 3D, which uses surfaces to model exterior tissues with BEM and a small number of volume nodes to model interior tissues with FEM. Such a coupled FE-BEM technique combines strengths of FEM and BEM by assuming homogeneous outer tissue regions and heterogeneous inner tissue regions. Results with FE-BEM show agreement with existing numerical models, having RMS differences of less than 0.5 for the logarithm of intensity and 2.5 degrees for phase of frequency domain boundary data. The coupled FE-BEM approach can model heterogeneity using a fraction of the volume nodes (4-22%) required by conventional FEM techniques. Comparisons of computational times showed that the coupled FE-BEM was faster than stand-alone FEM when the ratio of the number of surface to volume nodes in the mesh (Ns/Nv) was less than 20% and was comparable to stand-alone BEM ( ± 10%).
OCIS codes: (170.3880) Medical and biological imaging, (170.3660) Light propagation in tissues, (170.3010) Image reconstruction techniques
1. Introduction
1.1 Introduction to 3D diffuse optical imaging
Diffuse optical imaging provides functional information related to the physiological status of tissue non-invasively. Absorption, fluorescence and Raman optical imaging have demonstrated ability to provide molecular fingerprints of tissues in healthy and diseased states [1–5]. These optical techniques require a model for image reconstruction from boundary measurements of tissues when used in tomographic applications in-vivo. Image reconstruction involves solving a model for light propagation (called the forward model) iteratively to fit the measured data and recover optical parameters. Traditionally, image reconstruction techniques have used the approximation that light propagation is two-dimensional. However, more recently interest in 3D image reconstruction has grown because it is more accurate than 2D models given that light propagation is inherently three-dimensional [6].
Three-dimensional models have been successfully applied to simple geometries such as cylinders, slabs and spheres where algorithms have been explored for better localization and quantification. For example, Yalavarthy et al [7] used a generalized least squares minimization incorporating data and parameter variances to accelerate 3D image reconstruction for under-determined problems. Using a level-set technique for image reconstruction, Schweiger et al [8] showed that detection and localization of small objects could be improved in 3D. Boverman et al [9] used a parametric approach to reconstruct shape and contrast of piece-wise constant regions in 3D with spherical harmonics for modeling sharp boundaries in tissue and demonstrated quantitative results in a domain with a single inclusion. Zacharopoulos et al [10] used a similar strategy and showed that they could accurately recover location and contrast of an anomaly in experiments on a domain with single inclusion. Srinivasan et al [11] used a dynamic criterion based on the least squares error norm of model-data mismatch to reduce the size of large data sets and speed up 3D image reconstruction. However, applications of 3D image reconstruction to arbitrary shaped geometries such as breast and brain have been more limited, especially as in the setting of multi-modality imaging.
1.2 Multi-modality optical imaging reconstruction techniques
Multi-modality imaging has gained interest as an approach for improving the contrast recovery of diffuse optical imaging and fluorescence [12–15]. Multi-modality imaging uses prior anatomical structure to guide the diffuse optical reconstruction spatially, making it less ill-posed and the images better resolved. In this reconstruction process, the optical imaging domain is typically defined by segmentation and volume meshing of conventional medical images (MRI, X-Ray or CT). Image reconstruction techniques involving multimodal data have generally evolved in two categories of implementation of the spatial data, including: (1) soft prior information and (2) hard prior information. Soft prior info refers to the application of anatomical constraints, which allow for optical property variations to occur within segmented regions. Studies have used algorithms based on total variation minimization [16], sparsity regularization [15], Laplacian and Helmholtz regularizations [14,17,18], data-specific spatially varying regularization [19], with all predominantly in the finite element method (FEM) framework. Hard prior info strictly enforce the tissue boundaries to represent homogeneous or piece-wise constant optical property regions. This has been implemented using FEM [20,21] and the boundary element method (BEM) [22]. Many of these studies have been on simulations with couple of case studies resulting from experimental or clinical data; extensive testing in experimental or clinical data is still to be demonstrated.
1.3 Need for efficient 3D technique for complex 3D domains
In our experience, one of the key challenges in adopting 3D multimodal optical imaging for large clinical studies is in image segmentation and meshing of arbitrary shapes. Figure 1 shows a schematic of a typical workflow before image reconstruction. The process involves segmentation of medical image data, surface rendering (which produces a surface mesh as output) and volumetric meshing. The last step of obtaining a volume mesh for 3D image reconstruction can be time-consuming and difficult to automate in a clinical workflow. Studies in brain and small-animal imaging have used a standard anatomical atlas to by-pass the problem of obtaining subject-specific meshes [23,24]. However, some tissues such as the breast and the prostate show considerably larger heterogeneity between subjects [25] where a subject specific mesh is imperative to the imaging process. Use of a BEM approach as an alternative to FEM for hard priors alleviated the meshing complexity by requiring only surface discretization as compared to volume meshing for modeling light diffusion in 3D [22,26]. BEM showed promise for multimodal image guided diffuse optical spectroscopy of piece-wise constant regions (hard priors) by simplifying the meshing process and implementing the assumption in the forward model itself [22].
Fig. 1.
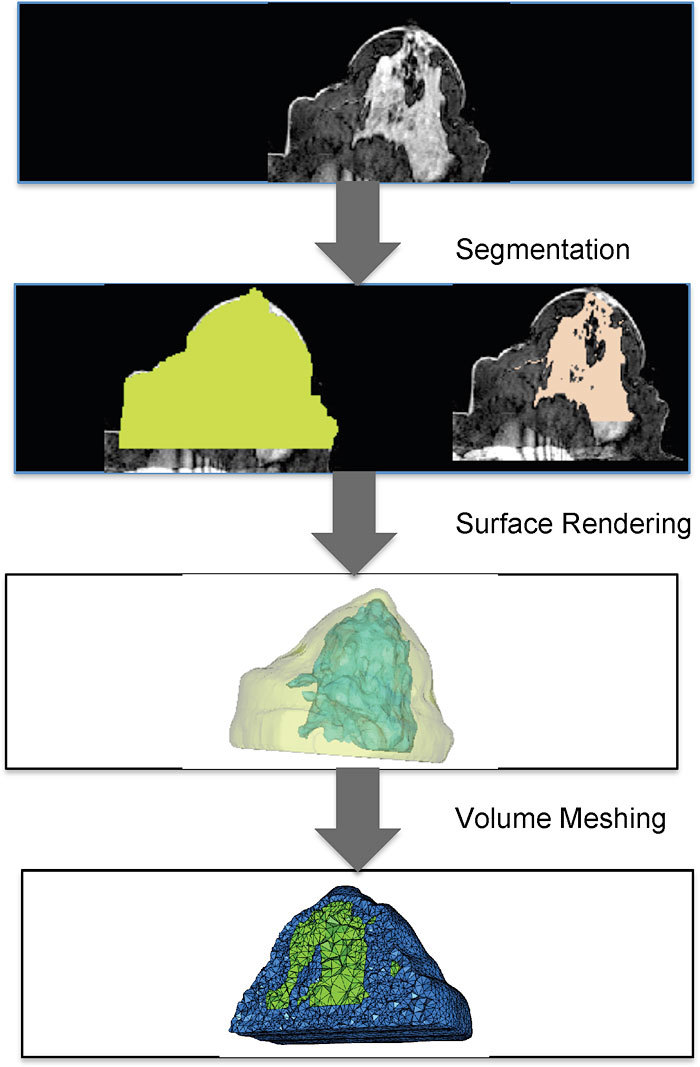
A schematic showing steps from medical image data to obtaining a volumetric mesh for computation with examples from breast data. These steps have to be routinely performed before image reconstruction can be done for 3D multi-modality optical imaging. Methods for image segmentation vary between applications; here thresholding and region-growing techniques were applied for breast tissue. Surface rendering is automatically generated by many open source softwares, but getting a reliable volume mesh can be time-consuming and more difficult to automate.
However, using piece-wise constant optical property approximations has limitations: (1) it cannot model tissues which are known to have spatially varying optical property distributions such as large solid tumors [27] (2) results are affected when the prior information on tissue boundaries is imperfect [17,21], and (3) insufficient information exists when the boundary data is simply not available as in the case of false-negative findings in MRI. An efficient method to counter these limitations is needed without the complexity of creating a full 3D volume mesh.
1.4 Coupled finite element – boundary element method (FE-BEM)
Here, we present a hybrid method for modeling the diffusion equation, which combines the strengths of BEM in terms of reduced meshing dimensionality with FEM in terms of modeling optical property heterogeneity. The approach is akin to a tailored method for incorporating soft priors in a modified form in the forward model, itself, i.e. in modeling the light diffusion equation instead of within the image reconstruction formulation. The coupled FE-BEM scheme introduced here assumes homogeneous regions in certain tissue types, which are known to have low variation in functional parameters (e.g. fat) and heterogeneous distributions for other tissues such as tumors, which are known to have large variations in optical properties. The advantage of this technique over FEM is that it does not require volume discretization of the entire 3D domain, but only for tissues with known heterogeneity; surfaces will suffice for the rest of the tissues within the domain of interest. The advantage over BEM is that it can model heterogeneity in certain tissues whereas BEM assumes only piece-wise constant regions. We present an implementation of the coupled FE-BEM system for modeling light diffusion in 3D. Results are reported for light fluence distributions and frequency domain boundary measurements of intensity and phase as well as computational times for realistic tissue geometries and are compared to existing numerical models. The examples presented correspond to breast imaging, although the concept can be readily extended to other sites and applications such as brain and small animal imaging.
2. Methods
2.1 Introduction to Diffusion equation
The diffusion equation can be derived from Radiation transport equation under the assumption that light propagation is just linearly anisotropic [28]. This diffusion approximation has been commonly used to model light transport in tissues where scatter dominates over absorption and at distances more than several transport scattering lengths (transport scattering length = , where is the reduced scattering coefficient) from the source [29]. This model is given in the frequency domain as:
| (1) |
where is the photon density or fluence at position r in the bounded imaging domain Ω, D is the diffusion coefficient given by:
| (2) |
is the absorption coefficient, ω is the frequency, and is the isotropic source distribution. The source distribution is modeled as a point source located at a depth of one scattering distance inside the boundary where an optical fiber would be [30]. At the outer boundary of the domain, the relationship between photon fluence and flux is given by a Robin type boundary condition [30]:
| (3) |
Where α incorporates refractive index mismatch.
A coupled FE-BEM approach for the diffusion equation in multi-layered media was implemented by assuming homogeneous optical properties in outer layers and heterogeneous optical properties in the innermost tissue layer. Figure 2 shows a schematic of such a layered media illustrated in 2D for simplicity. In this domain, the exterior tissue (labeled I) was homogeneous and bounded by (containing Na nodes) and (containing Nb nodes). also bounds an interior layer (labeled II) containing Nb nodes on the boundary and Ni nodes on the interior. In the coupled FE-BEM, BEM was used to model the exterior layers and FEM was used for the interior layer. These are discussed below in the context of the coupled system.
Fig. 2.
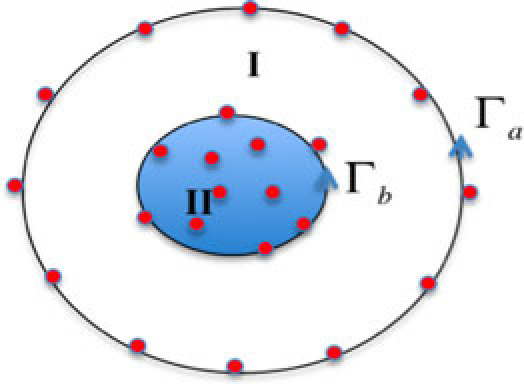
Schematic of a two-layered region in 2D having homogeneous distribution of optical properties in region I and heterogeneous distribution in region II.
2.2 Diffusion equation modeled with FEM
The Galerkin formulation was used for FEM where the orthogonality condition is satisfied [31]. Here R is the residual of Eq. (1), Wi is the weighting function and symbol represents integration. Using linear basis functions as the weighting function, we obtain the formulation for Eq. (1):
| (4) |
The first term in Eq. (4) was integrated using Green’s theorem, to give:
| (5) |
where the integration applies for interior tissues (region II in Fig. 2 bounded by ); note that the right hand side source contribution is zero since no source exists within the interior tissue region. Approximating and, using piece-wise linear basis functions and nodal values for fluence and flux Eq. (5) becomes:
| (6) |
where Nv is the total number of volume nodes (Nv = Nb + Ni). Equation (6) can be written in matrix form as:
| (7) |
where
| (8) |
Separating boundary (b) and interior (i) nodes of the inner region II, Eq. (7) expands as:
| (9) |
where AI = A−1. Φb can be obtained from
| (10) |
this relationship between fluence and flux is applied within the BEM integral equation as described in the next section.
2.3 Diffusion equation modeled with BEM
Under the assumption that the tissue contains boundaries known a priori which separate into piece-wise constant homogeneous regions, the diffusion equation can be written in the form of a modified Helmholtz equation given in each region by [22,26]:
| (11) |
where
| (12) |
Here subscript l refers to the region label and applies to homogeneous region I in Fig. 2 bounded by and . The fundamental solution given by the Green’s function for Eq. (11) satisfies:
| (13) |
where
| (14) |
The boundary integral form of Eq. (11) was derived using weighted residuals, Green’s third identity and the fundamental solutions [32] and appears as:
| (15) |
for the Green’s function which is singular in node i where , and Ω is the solid angle enclosed by the boundary at node i.
The photon fluence and flux are discretized using linear basis functions defined on the triangles of the surfaces, as and , where Ns is the number of boundary nodes on the surface (Ns = Na + Nb). In discretized form, Eq. (15) becomes:
| (16) |
which can be written as matrix equation
| (17) |
where
| (18) |
The Robin boundary condition specified in Eq. (3) is applied for the outer boundary. For multi-region problems, continuity conditions are enforced across the interior boundaries. For a two-region problem, the matrix form was derived by separating nodes on boundaries and as (see Appendix for details).
| (19) |
Note from Eq.s 10 and 19 that both BEM and FEM formulations containing fluence on boundary nodes of interior tissue which couples the FEM and BEM system of equations.
2.4 Coupled FE-BEM for Diffusion equation
To derive the coupled FE-BEM formulation, we note that the fluence has to be the same whether derived from BEM or FEM for interior boundaries and the flux has to be continuous. This can be stated mathematically as:
| (20) |
The negative sign for the flux is because the BEM formulation derived flux going outwards from region I into II, and FEM formulation has flux going into region I from II.
Using these relations and substituting for from Eq. (10) into Eq. (19) produces
| (21) |
This system was solved for fluence on the outer boundary and flux on inner boundary. The flux was used from this solution to solve the FEM equation [Eq. (9)] for interior field. Also note that matrix A has already been inverted when solving Eq. (10), so this step is straightforward. The size of the matrix to be inverted in Eq. (21) is Ns x Ns. Equation (21) represents a two-region problem but the approach is easily extended to multiple regions as shown in the Appendix. The coupled FE-BEM equations were implemented in Matlab and C and used to generate fluence distributions in the domain.
2.5 Simulation setup
Realistic breast-shaped imaging domains were generated using a clinical MRI data set collected from a female volunteer diagnosed with infiltrating ductal carcinoma as part of an ongoing clinical trial with MRI/optical imaging. A 3T Phillips scanner was used to collect the MRI and contrast-enhanced MR data sets. Using the MR volume, image segmentation of adipose, fibroglandular and tumor tissues was performed with the use of software package MimicsTM [33]. In addition, spherical inclusions were also simulated within the outer breast region. Using these geometries, six test cases of multiple regions were created for the simulations as shown in Fig. 3 . The volume meshes for interior tissues of interest were generated with the same software. Combining these surfaces and volumes provided meshes for the coupled FE-BEM. The corresponding mesh sizes are given in Table 1 for each of the test cases.
Fig. 3.
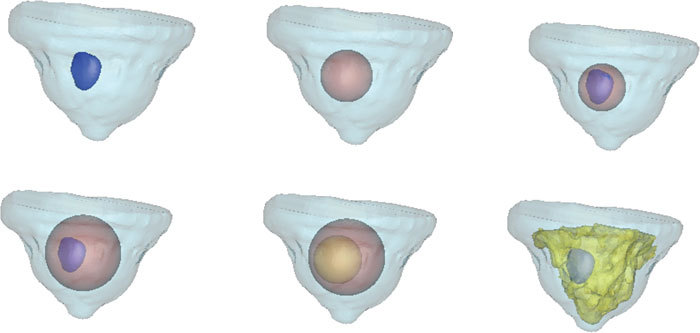
Surface renderings of the six test cases used in this study are shown, with two-three regions created. Clockwise from top left, the six test cases show cases (1) the outer breast contour and tumor created from clinical MRI (2) outer breast and simulated spherical inclusion (3) Outer breast, sphere and tumor (4) Outer breast, larger sphere and tumor (5) Outer breast and two spherical inclusions and (6) Outer breast, fibroglandular and tumor tissues.
Table 1. Mesh sizes for the different test cases used in the simulations. The first two columns of mesh sizes correspond to the coupled FE-BEM and the last two columns correspond to mesh sizes for BEM and FEM.
| Test Case # | #Surface Nodes | # Volume Nodes | # Nodes BEM Mesh | # Nodes FEM Mesh |
|---|---|---|---|---|
| 1 | 6471 | 798 | 6471 | 70423 |
| 2 | 6869 | 2171 | 6869 | 61468 |
| 3 | 7346 | 798 | 7346 | 65949 |
| 4 | 8297 | 798 | 8297 | 50203 |
| 5 | 8695 | 2171 | 8695 | 51041 |
| 6 | 11415 | 798 | 11415 | 50243 |
To compare the results from the coupled FE-BEM, forward data was also generated using BEM and FEM techniques both of which have been validated previously [34,35]. For the BEM, only surfaces were required, and multiple homogeneous regions were simulated. For the FEM, a full 3D volume mesh was required with the interior boundaries preserved for consistency. The volume meshes for each of the test cases were created with a 3D pixel-based mesh generator [36], which used the average edge size from the surfaces for generating the volume mesh. A schematic of such a mesh is shown in Fig. 1 (last step). Mesh sizes used in BEM and FEM only reconstructions are also given in Table 1. The meshes for testing all three models were of comparable mesh resolutions and with interior boundaries preserved. The computer time for volume mesh generation varied from 260 seconds to 323 seconds. The source-detector geometry for the imaging domains contained sixteen sources with fifteen detectors per source in a circular ring around the periphery of the breast, giving a total of 240 measurements [4]. The fiber indentations for the sixteen locations can be seen in the surface rendering (Fig. 3).
3. Results
3.1 Photon fluence distribution from coupled FE-BEM
The coupled FE-BEM was applied to generate the photon fluence in the six test cases shown in Fig. 3. In the simulation, both the exterior and interior tissues had homogeneous distributions of optical properties where = 0.006 mm−1 and = 1.0 mm−1 for outer region(s) and = 0.02 and = 2.0 mm−1 in the interior tissue. The logarithm of fluence distribution at the boundaries of the tissues for a single source is shown in Fig. 4 for test cases 1 and 6 where the diffusive pattern typically expected from the diffusion equation is seen.
Fig. 4.

Logarithm of photon fluence obtained using coupled FE-BEM for a single source in test cases 1, and 6. Left: Results from test case 1 showing outer boundary; Middle: inner tumor boundary by making outer surface transparent; Right: Results from test case 6 for inner tissues.
3.2 Comparison of boundary data using BEM, FEM and Coupled FE-BEM
To compare the results from the coupled FE-BEM with existing models, the boundary data at detector locations were computed. The logarithm of intensity and phase is shown in Fig. 5 at the boundary detector locations for 240 measurements (16 sources x 15 detectors/source) generated using the three models (BEM, FEM and coupled FE-BEM) for test case 1. The measurements show good agreement with RMS differences in logarithm of intensity between BEM and the coupled model of less than 0.1 and in phase of less than 1 degree. The RMS differences between FEM and the coupled model was less than 0.5 for logarithm of intensity and 2.5 degrees for phase. These differences are likely due to the differences in the mesh types and discretization.
Fig. 5.
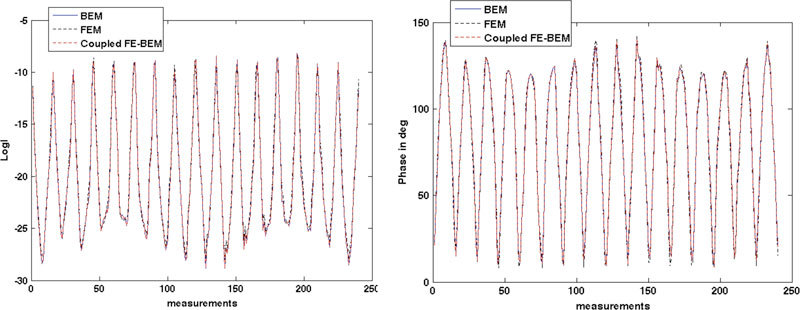
Comparison of (a) logarithm of intensity and (b) phase at the detector locations on the boundary ( = 240 measurement points) obtained from BEM, FEM and coupled FE-BEM for test case 1.
3.3 Modeling heterogeneity
One of the drawbacks of BEM is that it cannot model heterogeneity of tissue due to the inherent assumption in the model: the Diffusion equation only reduces to modified Helmholtz in BEM formulation for piece-wise constant or homogeneous regions. For modeling heterogeneity, the coupled model offers an alternative solution. To illustrate the change in fluence with increasing heterogeneity, a cross-section along the center of the inner sphere in test case 2 is shown in Fig. 6 for a single source. The left column indicates the property distribution and right column shows the corresponding logarithm of fluence distribution for a (1) homogeneous domain (sphere to background contrast of 1:1), (2) heterogeneous domain (2:1 sphere to background contrast) and (3) heterogeneous domain with spatially varying contrast in the sphere (2:1 varying with background). As the heterogeneity in the absorption increases, a decrease in fluence is observed in parts of the sphere, as expected. A decrease in intensity also occurred at the boundary as a result of the heterogeneity.
Fig. 6.
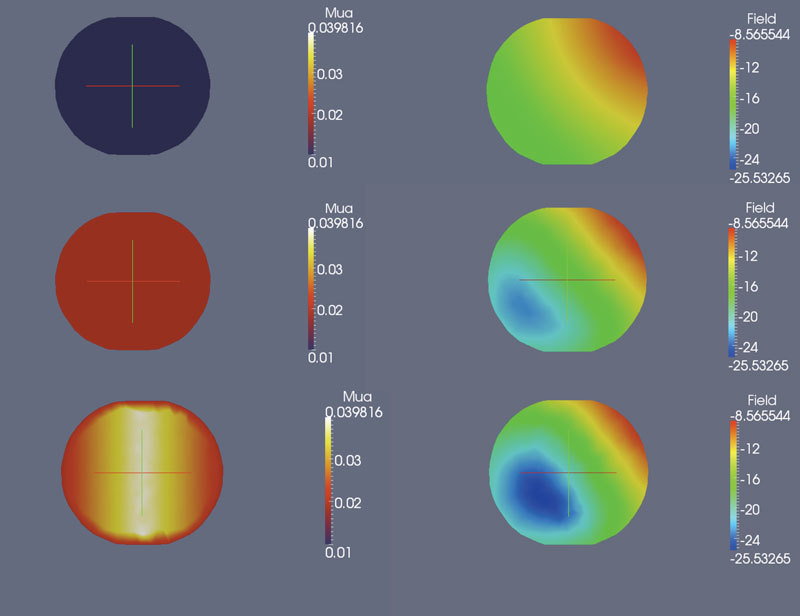
2-D cross-sections along the center of the interior spherical inclusion in test case 2 for (left column) and logarithm of fluence (right column). The background was always homogeneous. Top row shows cross-section of sphere for a homogeneous domain (1:1 contrast between sphere and background), Middle row shows 2:1 contrast between sphere and background and bottom row shows a spatially varying distribution in the sphere (2:1 varying). As expected the fluence decreases with increasing heterogeneity.
3.4 Analysis of computational times between Coupled FE-BEM and FEM
The computational time required by coupled FE-BEM was a function of the surface mesh size and was found to scale as Ns3.2, where Ns is the number of nodes in the surface mesh. This outcome was expected given that the matrix assembly and solving the BEM component of the coupled model consumed the most time and the BEM was found to scale with surface node size as Ns3.5. The scaling was obtained for the two region and three region problems in complex domains presented here, but was smaller (Ns2.7 quoted previously for BEM [22]) in simple two region domains. The FEM component of the coupled model consumed less than 0.5% of the total time.
Since the computational time of coupled FE-BEM scales with surface mesh size, it is reasonable to assume that the speed-up of the coupled model when compared to stand-alone FEM will be a function of the ratio of the number of surface to full 3D volume nodes (Ns/N). Figure 7 (top row) shows a plot of the ratio of computational times of coupled FE-BEM to FEM time, as a function of Ns/N, the values for Ns and N can be found in Table 1 (first column and last columns respectively). The plot shows that for ratio of Ns/N < 20%, coupled FE-BEM was faster (ratio of times < 1) whereas for Ns/N > 20%, stand-alone FEM was faster (ratio of times > 1). This data did not include the computational time for creating a large 3D volume mesh for FEM. It is important to note that when the meshing time for FEM was included, coupled FE-BEM was always faster than FEM (ratio < 1) for the cases presented here (ratio of times ranged from 0.14 to 0.92).
Fig. 7.
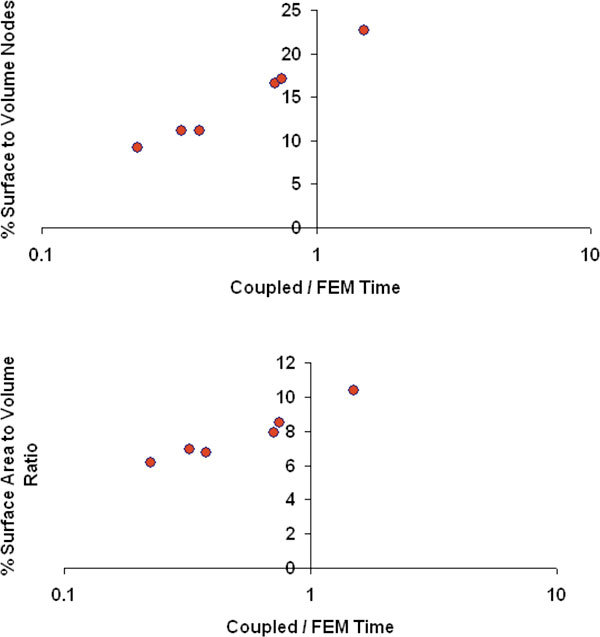
Ratio of computational time of coupled FE-BEM to stand-alone FEM for the six test cases, plotted as a function of % surface to volume nodes (top) from the respective meshes (Ns/N) where Ns is the number of boundary nodes in the coupled mesh and N is the number of nodes in the FEM mesh and % surface area to volume ratio (bottom) of the total tissue domain.
Since the metric (Ns/N) requires a volume mesh to be created, we also chose the physical surface area to volume ratio (SA/V) as another metric for comparing computational times, and can be obtained from image segmentation. Figure 7 (bottom row) shows that the coupled model was faster than FEM (ratio of times < 1) when SA/V < 10%. These plots illustrate that we can use quantitative metrics to determine the most efficient 3D forward model for the imaging domain under consideration.
3.5 Analysis of computational times between Coupled FE-BEM and BEM
A similar comparison was performed for the ratio of computational times of coupled FE-BEM and BEM. Since the number of surface nodes was the same for the coupled FE-BEM and BEM models (See Table 1), the time differences depend on the total number of volume nodes used in the interior tissue region (Nv = Nb + Ni) as compared to the surface nodes (Nb) on the boundary in the same region (see region II in schematic of Fig. 2). For small Nb/Nv, the volume nodes dominate such that coupled FE-BEM was longer to compute than BEM. For larger Nb/Nv, surface nodes dominate and hence coupled FE-BEM was faster than BEM. Overall, the differences in the two models were less than 10% for the test cases presented here (see Fig. 8 , top row). A ratio of 50% Nb/Nv appeared to be the delineating value. Similarly, a ratio of 20% appeared to separate the two models in terms of ratio of interior tissue surface area (ISA) to interior tissue volume (IV), see Fig. 8 (bottom).
Fig. 8.
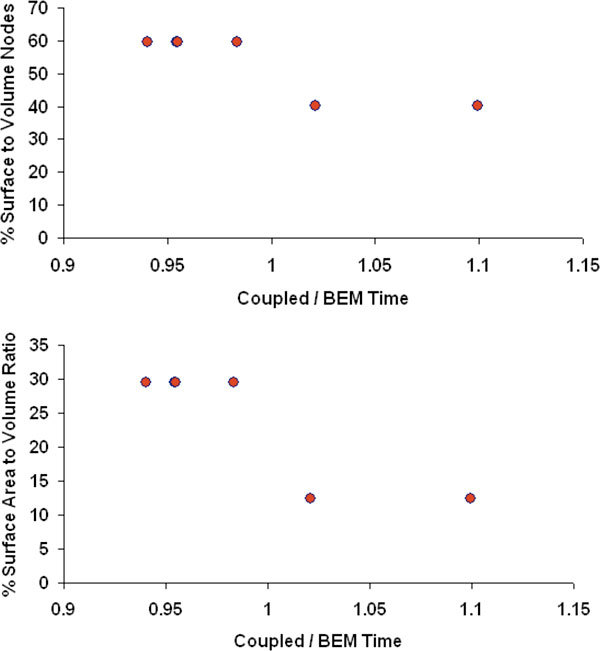
Ratio of computational time of coupled FE-BEM model to BEM for the six test cases, plotted as a function of % surface to volume nodes (top) of the interior tissue (Nb/Nv) where Nb is the number of nodes on boundary of interior tissue and Nv is the number of volume nodes of interior tissue, and % surface area to volume ratio (ISA/IV) (bottom) of the interior tissue domain.
4. Discussion and Conclusions
Coupled FE-BEM methods have been used extensively in other fields such as electrostatics [37], electromagnetics [38] and in biomedical applications to model cardiac tissue [39]; among others, Here we present application of this technique to diffuse optical tomography. The coupled FE-BEM method provides an elegant solution to the practical problem in multi-modality optical imaging of how to model heterogeneity in tissues whose boundaries are known, without complex volumetric meshing of the full 3D domain. In this method, the volume meshing has not been eliminated, but rather the size of the domains were reduced for which it is needed. Therefore, this has an impact on both the meshing time as well as the computational time for the forward solver.
Different implementation options exist [40], and we chose one does not change the bandwidth of the matrices involved. Specifically, the sparsity of the FEM matrix, which is a highly desirable aspect of finite elements, was not altered. No increase in the size of dense BEM matrix to be solved occurred as well. The computational time of the coupled method was governed primarily by the BEM matrix size (> 99% of total time) for the domains described here. This will likely change for larger volumetric FEM computations within the domain, or larger areas of heterogeneity, but is not anticipated in the current application. Comparison to existing and validated numerical models based on FEM alone and BEM alone showed good agreement with RMS differences of less than 0.5 in logarithm of intensity and less than 2.5 degrees in phase.
The coupled FE-BEM method incorporates the idea of soft priors directly into the forward model itself, which is different from traditional techniques where regularization is used in the image reconstruction or inverse problem. The choice of numerical technique for the forward model will depend on the problem, the imaging domain and its approximations with respect to homogeneity/heterogeneity. These a priori assumptions when used intelligently can greatly influence the choice of the model to be used. We have shown that the coupled FE-BEM is faster than FEM when the surface to volume node ratio was less than 20% and when the total surface area to volume was less than 10%. However, when meshing time was included, the coupled FE-BEM was always faster and the ratio of computational times (Coupled / FEM) ranged from 0.14 to 0.92. Coupled FE-BEM was comparable to BEM ( ± 10%) for the range of mesh sizes and tissue types examined here. We have presented results from realistic breast-shaped models in these simulations. While the results presented here are from breast geometries, the model can be applied to other tissue regions as well.
In conclusion, a coupled FE-BEM method was implemented for modeling light diffusion in 3D for multi-modality optical imaging systems and the results show good agreement with existing numerical models but utilize a fraction of the volume mesh size required by corresponding FEM techniques.
5. Appendix
Equation (17) describes the matrix form of the BEM for a single region. For an external region consisting of boundaries a and b, in region I, the matrix formulation extension of Eq. (17) is
| (22) |
| (23) |
Substituting the boundary condition in Eq. (3) for the outer boundary, Eq. (23) becomes:
| (24) |
which yields Eq. (19). For successive layers bounded by a, b and c, the matrix for BEM is
| (25) |
and the FEM relationship is given for an interior region as which is used along with continuity conditions to derive the coupled FE-BEM given by:
| (26) |
Acknowledgments
This work was funded by NIH-NIBIB grant R01EB007966 and patient data collected through NCI grant P01CA080139.
References and links
- 1.Weissleder R., Pittet M. J., “Imaging in the era of molecular oncology,” Nature 452(7187), 580–589 (2008). 10.1038/nature06917 [DOI] [PMC free article] [PubMed] [Google Scholar]
- 2.Cerussi A., Hsiang D., Shah N., Mehta R., Durkin A., Butler J., Tromberg B. J., “Predicting response to breast cancer neoadjuvant chemotherapy using diffuse optical spectroscopy,” Proc. Natl. Acad. Sci. U.S.A. 104(10), 4014–4019 (2007). 10.1073/pnas.0611058104 [DOI] [PMC free article] [PubMed] [Google Scholar]
- 3.Schulmerich M. V., Cole J. H., Dooley K. A., Morris M. D., Kreider J. M., Goldstein S. A., Srinivasan S., Pogue B. W., “Noninvasive Raman tomographic imaging of canine bone tissue,” J. Biomed. Opt. 13(2), 020506 (2008). 10.1117/1.2904940 [DOI] [PMC free article] [PubMed] [Google Scholar]
- 4.Carpenter C. M., Pogue B. W., Jiang S., Dehghani H., Wang X., Paulsen K. D., Wells W. A., Forero J., Kogel C., Weaver J. B., Poplack S. P., Kaufman P. A., “Image-guided optical spectroscopy provides molecular-specific information in vivo: MRI-guided spectroscopy of breast cancer hemoglobin, water, and scatterer size,” Opt. Lett. 32(8), 933–935 (2007). 10.1364/OL.32.000933 [DOI] [PubMed] [Google Scholar]
- 5.Niedre M. J., de Kleine R. H., Aikawa E., Kirsch D. G., Weissleder R., Ntziachristos V., “Early photon tomography allows fluorescence detection of lung carcinomas and disease progression in mice in vivo,” Proc. Natl. Acad. Sci. U.S.A. 105(49), 19126–19131 (2008). 10.1073/pnas.0804798105 [DOI] [PMC free article] [PubMed] [Google Scholar]
- 6.Schweiger M., Arridge S. R., “Comparison of two- and three-dimensional reconstruction methods in optical tomography,” Appl. Opt. 37(31), 7419–7428 (1998). 10.1364/AO.37.007419 [DOI] [PubMed] [Google Scholar]
- 7.Yalavarthy P. K., Lynch D. R., Pogue B. W., Dehghani H., Paulsen K. D., “Implementation of a computationally efficient least-squares algorithm for highly under-determined three-dimensional diffuse optical tomography problems,” Med. Phys. 35(5), 1682–1697 (2008). 10.1118/1.2889778 [DOI] [PMC free article] [PubMed] [Google Scholar]
- 8.Schweiger M., Dorn O., Zacharopoulos A., Nissila I., Arridge S. R., “3D level set reconstruction of model and experimental data in Diffuse Optical Tomography,” Opt. Express 18(1), 150–164 (2010). 10.1364/OE.18.000150 [DOI] [PubMed] [Google Scholar]
- 9.Boverman G., Miller E. L., Brooks D. H., Isaacson D., Fang Q., Boas D. A., “Estimation and statistical bounds for three-dimensional polar shapes in diffuse optical tomography,” IEEE Trans. Med. Imaging 27(6), 752–765 (2008). 10.1109/TMI.2007.911492 [DOI] [PMC free article] [PubMed] [Google Scholar]
- 10.Zacharopoulos A. D., Schweiger M., Kolehmainen V., Arridge S. R., “3D shape based reconstruction of experimental data in Diffuse Optical Tomography,” Opt. Express 17(21), 18940–18956 (2009). 10.1364/OE.17.018940 [DOI] [PubMed] [Google Scholar]
- 11.Srinivasan S., Pogue B. W., Dehghani H., Leblond F., Intes X., “Data subset algorithm for computationally efficient reconstruction of 3-D spectral imaging in diffuse optical tomography,” Opt. Express 14(12), 5394–5410 (2006). 10.1364/OE.14.005394 [DOI] [PubMed] [Google Scholar]
- 12.Zhang Q., Brukilacchio T. J., Li A., Stott J. J., Chaves T., Hillman E., Wu T., Chorlton M., Rafferty E., Moore R. H., Kopans D. B., Boas D. A., “Coregistered tomographic x-ray and optical breast imaging: initial results,” J. Biomed. Opt. 10(2), 024033–0240339 (2005). 10.1117/1.1899183 [DOI] [PubMed] [Google Scholar]
- 13.Davis S. C., Samkoe K. S., O’Hara J. A., Gibbs-Strauss S. L., Payne H. L., Hoopes P. J., Paulsen K. D., Pogue B. W., “MRI-coupled fluorescence tomography quantifies EGFR activity in brain tumors,” Acad. Radiol. 17(3), 271–276 (2010). 10.1016/j.acra.2009.11.001 [DOI] [PMC free article] [PubMed] [Google Scholar]
- 14.Schulz R. B., Ale A., Sarantopoulos A., Freyer M., Soehngen E., Zientkowska M., Ntziachristos V., “Hybrid system for simultaneous fluorescence and x-ray computed tomography,” IEEE Trans. Med. Imaging 29(2), 465–473 (2010). 10.1109/TMI.2009.2035310 [DOI] [PubMed] [Google Scholar]
- 15.Li C., Wang G., Qi J., Cherry S. R., “Three-dimensional fluorescence optical tomography in small-animal imaging using simultaneous positron-emission-tomography priors,” Opt. Lett. 34(19), 2933–2935 (2009). 10.1364/OL.34.002933 [DOI] [PMC free article] [PubMed] [Google Scholar]
- 16.Paulsen K. D., Jiang H., “Enhanced frequency-domain optical image reconstruction in tissues through total-variation minimization,” Appl. Opt. 35(19), 3447–3458 (1996). 10.1364/AO.35.003447 [DOI] [PubMed] [Google Scholar]
- 17.Yalavarthy P. K., Pogue B. W., Dehghani H., Carpenter C. M., Jiang S., Paulsen K. D., “Structural information within regularization matrices improves near infrared diffuse optical tomography,” Opt. Express 15(13), 8043–8058 (2007). 10.1364/OE.15.008043 [DOI] [PubMed] [Google Scholar]
- 18.Yuan Z., Zhang Q., Sobel E. S., Jiang H., “Tomographic x-ray-guided three-dimensional diffuse optical tomography of osteoarthritis in the finger joints,” J. Biomed. Opt. 13(4), 044006 (2008). 10.1117/1.2965547 [DOI] [PubMed] [Google Scholar]
- 19.Hyde D., Miller E. L., Brooks D. H., Ntziachristos V., “Data specific spatially varying regularization for multimodal fluorescence molecular tomography,” IEEE Trans. Med. Imaging 29(2), 365–374 (2010). 10.1109/TMI.2009.2031112 [DOI] [PubMed] [Google Scholar]
- 20.Carpenter C. M., Srinivasan S., Pogue B. W., Paulsen K. D., “Methodology development for three-dimensional MR-guided near infrared spectroscopy of breast tumors,” Opt. Express 16(22), 17903–17914 (2008). 10.1364/OE.16.017903 [DOI] [PMC free article] [PubMed] [Google Scholar]
- 21.Boverman G., Miller E. L., Li A., Zhang Q., Chaves T., Brooks D. H., Boas D. A., “Quantitative spectroscopic diffuse optical tomography of the breast guided by imperfect a priori structural information,” Phys. Med. Biol. 50(17), 3941–3956 (2005). 10.1088/0031-9155/50/17/002 [DOI] [PubMed] [Google Scholar]
- 22.Srinivasan S., Pogue B. W., Carpenter C., Yalavarthy P. K., Paulsen K. D., “A boundary element approach for image-guided near-infrared absorption and scatter estimation,” Med. Phys. 34(11), 4545–4557 (2007). 10.1118/1.2795832 [DOI] [PubMed] [Google Scholar]
- 23.Zhang X., Badea C. T., Johnson G. A., “Three-dimensional reconstruction in free-space whole-body fluorescence tomography of mice using optically reconstructed surface and atlas anatomy,” J. Biomed. Opt. 14(6), 064010 (2009). 10.1117/1.3258836 [DOI] [PMC free article] [PubMed] [Google Scholar]
- 24.Custo A., Boas D. A., Tsuzuki D., Dan I., Mesquita R., Fischl B., Grimson W. E., Wells W., 3rd, “Anatomical atlas-guided diffuse optical tomography of brain activation,” Neuroimage 49(1), 561–567 (2010). 10.1016/j.neuroimage.2009.07.033 [DOI] [PMC free article] [PubMed] [Google Scholar]
- 25.Pogue B. W., Jiang S., Dehghani H., Kogel C., Soho S., Srinivasan S., Song X., Tosteson T. D., Poplack S. P., Paulsen K. D., “Characterization of hemoglobin, water, and NIR scattering in breast tissue: analysis of intersubject variability and menstrual cycle changes,” J. Biomed. Opt. 9(3), 541–552 (2004). 10.1117/1.1691028 [DOI] [PubMed] [Google Scholar]
- 26.J. Sikora, A. Zacharopoulos, A. Douiri, M. Schweiger, L. Horesh, S. R. Arridge, and J. Ripoll, “Diffuse photon propagation in multilayered geometries,” Phys Med Biol (2006). [DOI] [PubMed] [Google Scholar]
- 27.Vaupel P., Kallinowski F., Okunieff P., “Blood flow, oxygen and nutrient supply, and metabolic microenvironment of human tumors: a review,” Cancer Res. 49(23), 6449–6465 (1989). [PubMed] [Google Scholar]
- 28.A. Ishimaru, Wave propagation and scattering in random media (Academic Press, Inc., New York, 1978), Vol. 1. [Google Scholar]
- 29.Patterson M. S., Wilson B. C., Wyman D. R., “The propagation of optical radiation in tissue I. models of radiation transport and their application,” Lasers Med. Sci. 6(2), 155–168 (1991). 10.1007/BF02032543 [DOI] [Google Scholar]
- 30.Arridge S. R., Schweiger M., Hiraoka M., Delpy D. T., “A finite element approach for modeling photon transport in tissue,” Med. Phys. 20(2), 299–309 (1993). 10.1118/1.597069 [DOI] [PubMed] [Google Scholar]
- 31.D. R. Lynch, Numerical partial differential equations for environmental scientists and engineers (Springer, 2005). [Google Scholar]
- 32.C. A. Brebbia and J. Dominguez, Boundary elements: an introductory course.
- 33.http://materialise.com/materialise/view/en/92078-Mimics.html, retrieved.
- 34.S. Srinivasan, C. Carpenter, B. W. Pogue, and K. D. Paulsen, “Image-guided near infrared spectroscopy using boundary element method: phantom validation,” in SPIE 2009 BiOS Biomedical Optics Symposium: Multimodal Biomedical Imaging IV, 2009) [DOI] [PMC free article] [PubMed] [Google Scholar]
- 35.Dehghani H., Srinivasan S., Pogue B. W., Gibson A., “Numerical modelling and image reconstruction in diffuse optical tomography,” Philos. Transact. A Math. Phys. Eng. Sci. 367(1900), 3073–3093 (2009). 10.1098/rsta.2009.0090 [DOI] [PMC free article] [PubMed] [Google Scholar]
- 36.Ghadyani H., Sullivan J. M., Jr, Wu Z., “Boundary recovery for delaunay tetrahedral meshes using local topological transformations,” Finite Elem. Anal. Des. 46(1-2), 74–83 (2010). 10.1016/j.finel.2009.06.022 [DOI] [PMC free article] [PubMed] [Google Scholar]
- 37.Bradley C. P., Harris G. M., Pullan A. J., “The computational performance of a high-order coupled FEM/BEM procedure in electropotential problems,” IEEE Trans. Biomed. Eng. 48(11), 1238–1250 (2001). 10.1109/10.959319 [DOI] [PubMed] [Google Scholar]
- 38.H. Ammari, ed., Modeling and computations in electromagnetics (Springer, 2007). [Google Scholar]
- 39.Fischer G., Tilg B., Modre R., Huiskamp G. J., Fetzer J., Rucker W., Wach P., “A bidomain model based BEM-FEM coupling formulation for anisotropic cardiac tissue,” Ann. Biomed. Eng. 28(10), 1229–1243 (2000). 10.1114/1.1318927 [DOI] [PubMed] [Google Scholar]
- 40.Paulsen K. D., Liu W., “Memory and operations count scaling of coupled finite element and boundary element systems of equations,” Int. J. Numer. Methods Eng. 33(6), 1289–1303 (1992). 10.1002/nme.1620330612 [DOI] [Google Scholar]


