Abstract
Inevitable discrepancies between the mouse tissue optical properties assumed by an experimenter and the actual physiological values may affect the tomographic localization of bioluminescent sources. In a previous work, the simplifying assumption of optically homogeneous tissues led to inaccurate localization of deep sources. Improved results may be obtained if a mouse anatomical map is provided by a high-resolution imaging modality and optical properties are assigned to segmented tissues. In this work, the feasibility of this approach was explored by simulating the effect of different magnitude optical property errors on the image formation process of a combined optical–PET system. Some comparisons were made with corresponding simulations using higher spatial resolution data that are typically attainable by CCD cameras. In addition, simulation results provided insights on some of the experimental conditions that could lead to poor localization of bioluminescent sources. They also provided a rough guide on how accurately tissue optical properties need to be known in order to achieve correct localization of point sources with increasing tissue depth under low background noise conditions.
Introduction
Tomographic localization of bioluminescent sources is challenging due to the large amount of absorption and scattering of optical photons travelling through biological tissues (Rice et al 2001). In contrast, the far weaker attenuation that annihilation gamma rays experience in tissues enables positron emission tomography (PET) to be a truly tomographic imaging modality for small animals (Chatziioannou 2002). Our laboratory is in the process of developing a combined optical–PET (OPET) mouse imaging system (Prout et al 2004, Rannou et al 2004) as an exploration tool for the relative, tissue depth-dependent, detection sensitivity and source localization capacity of the two modalities in a spatially co-registered setting.
We have previously demonstrated the theoretical capacity of the OPET system to localize sources accurately when the mouse tissue optical properties were known exactly (Alexandrakis et al 2005). However, due to uncertainties in experimental conditions, discrepancies between the assumed and true optical properties will exist in terms of both magnitude and spatial distribution. Unfortunately, the practically simplest approximation of ignoring the mouse anatomy and assuming optically homogeneous tissues results in severe localization errors for non-superficial sources (Kuo et al 2004, Alexandrakis et al 2005, Chaudhari et al 2005, Dehghani et al 2006).
In this work, optical properties were assigned to the tissues of a mouse anatomical map, obtained from a high-resolution micro-MRI scan (Segars et al 2004). The effects of errors in assigned tissue optical properties on the tomographic localization of point-like and distributed sources in the gut area were examined. In addition, comparisons were made between our OPET simulation findings where detectors had 2.2 mm resolution and simulations for detectors having the higher spatial resolution of CCD cameras.
Methods
The computational methods for simulating the propagation of bioluminescence photons in a cylindrical mouse torso image volume and the reconstruction of sources within that volume have been previously described in detail (Alexandrakis et al 2005). Briefly, the optical properties characterizing photon–tissue interactions were defined by wavelength-dependent absorption (μa) and transport scattering coefficients (), in units of mm−1, that were characteristic of each tissue. Photon propagation in a 26 mm diameter mouse torso was modelled by the diffusion equation for optical properties at five wavelengths (600, 625, 650, 675 and 700 nm) spanning the emission spectrum of firefly luciferase at 37 °C (Kuo et al 2004). The diffusion equation was solved numerically by the publicly available finite-element TOAST software (Arridge et al 1993). TOAST was used to calculate the point source system response, known as the P-matrix, on a cubic grid of 2 mm spacing which spanned the whole image volume. Virtual photon flux measurements were performed by OPET detectors (2.2 mm × 2.2 mm, 384 in total) as well as by high-resolution detectors (HiResOPET, 0.65 mm × 0.65 mm, 2200 in total) spanning the same geometrical field-of-view (FOV, 17.6 mm axially and 34.6 mm radially).
Errors in the assumed optical properties were expressed as percentages of baseline values for each mouse tissue (Alexandrakis et al 2005) at all emission wavelengths. The P-matrix was computed once using these baseline values, which represented an experimenter’s best guess of the true tissue optical properties. Virtual experimental measurements were generated for sources embedded in tissues having optical properties that differed from baseline values by various amounts. These differences represented the discrepancies between μa and/or tissue values assumed by the experimenter and the corresponding true values. Positive/negative magnitude errors corresponded to underestimation/overestimation of the true optical properties. Therefore, assuming optical properties that were lower than the true values represented a positive error.
An expectation maximization (EM) algorithm (Shepp and Vardi 1982) utilized the P-matrix to find the emission source distribution having the highest Poisson likelihood of generating the observed detector counts in each of the simulated experimental measurements. For reasons of computational efficiency, the EM algorithm maximized the logarithm of the Poisson likelihood. Reconstructions were terminated after 5000 iterations. Unless otherwise stated, the simulated detector measurements were noise-free. As the absolute intensity assigned to sources by the EM algorithm was dependent on the P-matrix voxel size and on background noise (Liow and Strother 1993), we did not attempt to define any criteria for the spatial extent of reconstructed sources but only examined their relative intensity distributions.
Results
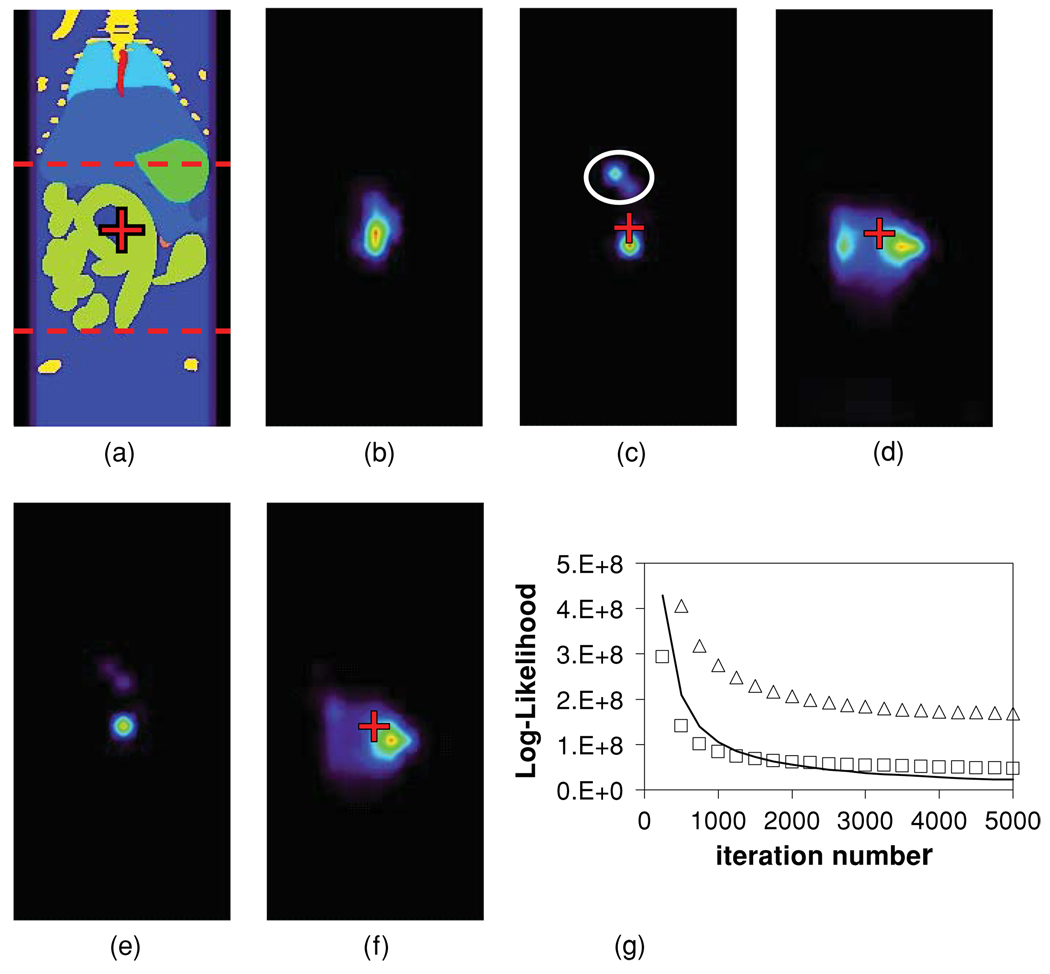
In the OPET detector geometry, a point source at the mouse torso centre (figure 1(a), red cross) was correctly reconstructed to encompass the true source location (figure 1(b)) when all tissue optical properties were known exactly. However, a +50% error in the gut μa, all other properties being kept at baseline values, resulted in a concentration of the reconstructed source distribution near its peak value (figure 1(c)). In addition, the reconstructed peak activity was localized below the true source location and artefactual sources appeared in the liver (figure 1(c), white oval). On the other hand, a −50% error in the gut μa resulted in an apparent smearing of the reconstructed source while the peak activity was off-centre compared to its true location (figure 1(d)). In contrast to the OPET case (figure 1(c)), a HiResOPET reconstruction recovered the true source location in the +50% μa error case, though minor liver artefacts persisted (figure 1(e)). For the HiResOPET −50% μa error case, smearing of the source was reduced compared to OPET but the peak activity was still off its true location (figure 1(f)). Errors in the gut alone produced reconstruction results (not shown) which were qualitatively similar to the corresponding μa cases. In addition, optical property errors in the surrounding fat or skin alone also affected the localization of the point source at the torso centre (not shown), but comparatively less than corresponding errors in the gut alone. Interestingly, the EM log-likelihood of the OPET-reconstructed sources for a −50% μa error in the gut and for baseline optical properties (figure 1(g), open squares and solid curve, respectively) converged to similar values, meaning that both emission distributions matched detector data almost equally well, despite their very different image appearances (figures 1(b) and (d)). Therefore, an experimenter may not be alerted to negative errors in the assumed optical properties from any large discrepancies between the OPET data modelled using the P-matrix and the corresponding virtual measurements. In contrast, the corresponding EM log-likelihood (figure 1(g), open triangles) for the +50% μa error case (figure 1(c)) converged to higher values, indicating greater discrepancies between EM predictions and detector data.
Figure 1.
(a) Coronal view of the mouse torso with a point source located in the gut (red cross). The source was centred in the OPET geometric FOV (red dashed lines). Different colours correspond to different tissue types (lime green: gut; dark blue: adipose tissue; purple: skin; light blue: liver and spleen; bright green: stomach; turquoise: lungs; yellow: bone; orange: kidneys; red: blood). (b) OPET reconstruction for the point source in (a) using baseline optical properties. (c) OPET reconstruction for a +50% μa error in the gut (red cross: true source location; white oval: artefactual source). (d) OPET reconstruction for a −50% μa error in the gut. (e) HiResOPET reconstruction for a +50% μa error in the gut. (f) HiResOPET reconstruction for a −50% μa error in the gut. (g) EM log-likelihood of the OPET-reconstructed sources for +50% (open triangles) and −50% (open squares) μa errors in the gut and for baseline optical properties (solid curve).
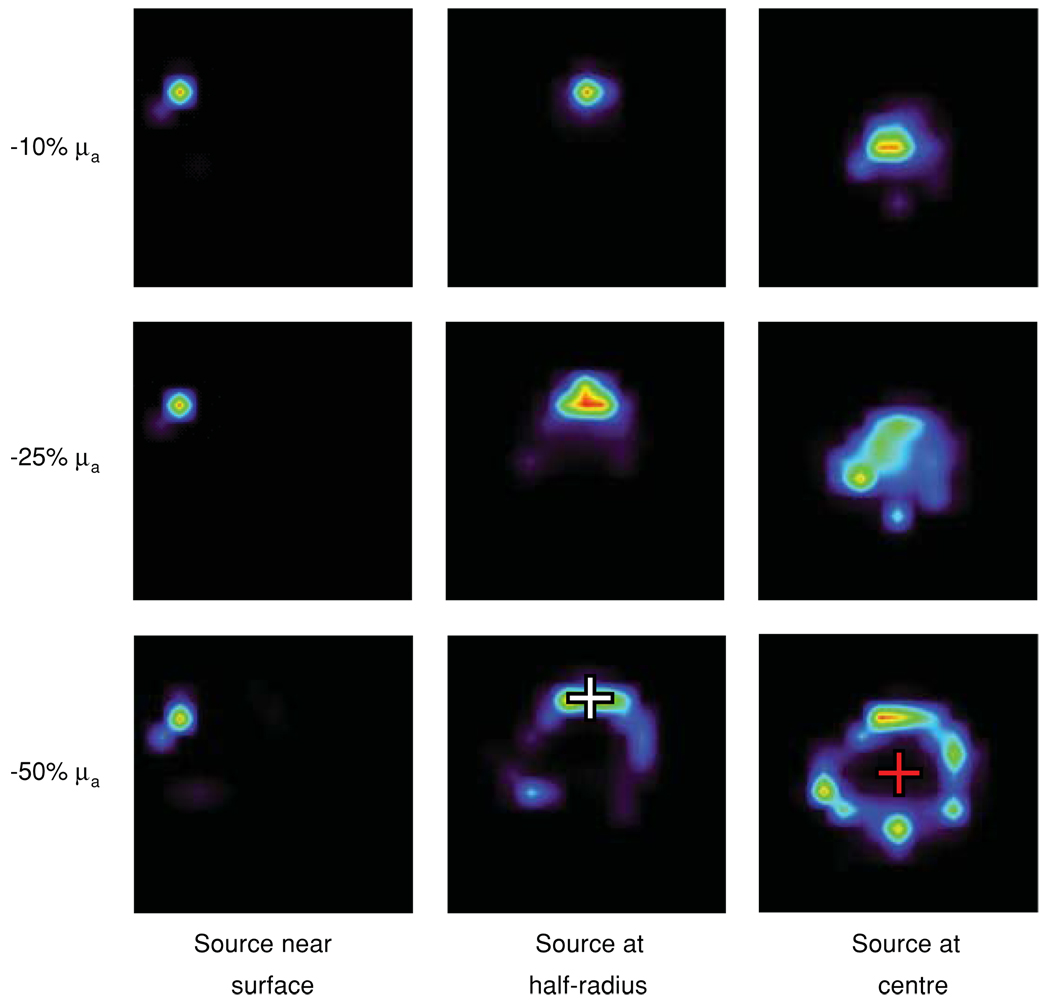
The μa or error values were subsequently varied for all tissues in concert (±10% to ±100% in μa, ±10% to ±75% in ). The effects of these errors on the reconstruction of point sources at the torso centre, half-radius and near the surface were examined. Typical results are shown in figure 2. For increasing negative μa errors, reconstructed sources localized less well with increasing point-source depth. A point source at 3 mm from the skin surface (column 1) was well localized irrespective of error magnitude. For a −50% μa error, the reconstructed source at half-radius, i.e. at 6.5 mm from the torso surface, was distorted into a ring-like shape but peak intensities were assigned to voxels encompassing the true source location (row 3, column 2, white cross), while for higher negative errors reconstructions failed (not shown). For the same μa error, the source at the centre reconstructed as a ring of activity around the true source location (row 3, column 3, red cross). Corresponding errors were qualitatively similar to those shown above for μa (not shown). On the other hand, positive μa and errors in the reconstructions of point sources at the torso centre and at half-radius resulted in artefactual sources in the liver volume, much like those seen in figure 1(c). The relative intensity of the artefactual sources increased with increasing positive error, but only the point source at the torso centre was mis-localized (as in figure 1(c)).
Figure 2.
Three point sources were placed one at a time at 3 mm from the surface (column 1), at half-radius (column 2, white cross) and at the torso centre (column 3, red cross). Reconstructed source distributions are shown as a function of error in μa (rows) and point-source depth (columns).
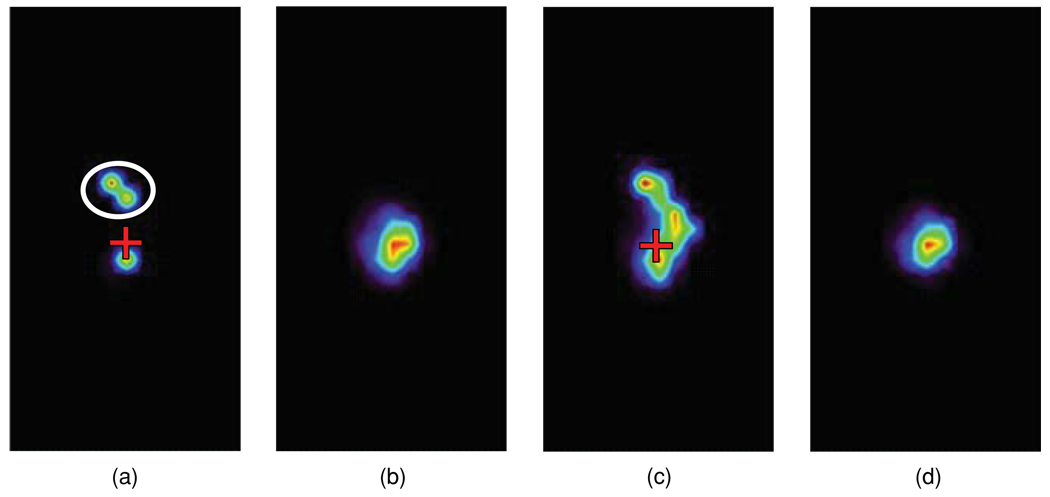
When errors of the same sign occurred in both μa and , reconstruction results were further degraded. For example, +25% μa and errors for all tissues resulted in strong artefactual sources in the liver (figure 3(a), white oval). In addition, when both μa and errors were −25%, the reconstruction failed (not shown). In practice, it is likely that optical properties will have a combination of positive and negative errors of different magnitudes. It is impossible to explore the resulting vast numbers of possible error combinations. In a sample simulation (figure 3(b)), when all tissues had −25% errors in μa and +25% errors in , a point source at the torso centre was localized better than in the cases of all positive or all negative errors. It thus seemed that errors in opposite directions partially cancelled out each other leading to improved source localization. When uniform background noise was added to the OPET detector data at a signal-to-noise ratio (SNR) of 5, the reconstructed source activity at the torso centre was smeared above and below its true location (figure 3(c), red cross). In contrast, the reconstruction of corresponding HiResOPET data preserving the total detected flux was more robust to the same noise level and was similar to the OPET noise-free case (figure 3(d)).
Figure 3.
(a) OPET reconstruction for the point source in figure 1(a) when errors in both μa and were +25% for all tissues (red cross: true source location; white oval: artefactual sources). (b) OPET reconstruction for −25% μa and +25% errors. (c) As in (b), but for background noise added to the OPET detector data at SNR = 5 (red cross: true source location). (d) HiResOPET reconstruction at SNR = 5.
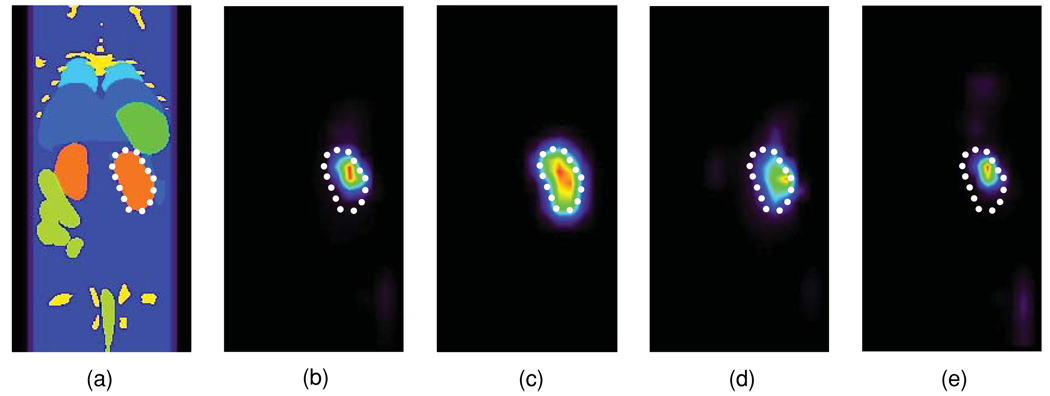
The effect of optical property errors on the reconstruction of a uniform intensity source in the shape of a kidney (figure 4(a), white dotted curve) was also investigated. Even for baseline optical properties, peak intensities in the reconstructed source distribution were shifted towards the surface compared to the kidney volume centre of gravity (figure 4(b)). The partial volume effect was then emulated by resampling the kidney image at 2 mm voxel resolution, to match the P-matrix voxel size employed in the EM reconstructions, and by convolving the resulting source image with a Gaussian kernel (full-width half-maximum = 3 mm, i.e. 1.5 image voxels). In contrast to the reconstructed source seen in figure 4(b), emulation of the partial volume effect produced a significantly more uniform and properly centred intensity distribution (figure 4(c)). When all tissues had a −50% error in μa, the reconstructed intensity distribution was more uniform compared to the baseline case, though peak intensity locations deviated even further towards the surface (figure 4(d)). As was the case for point sources (figure 1(c)), when all tissues had a +50% μa error, the reconstructed distributed source became even more concentrated around its peak intensities compared to baseline (figure 4(e)). The corresponding simulations using HiResOPET detector data produced very similar results (not shown).
Figure 4.
(a) Coronal view of the mouse torso with one of the kidneys acting as a uniform intensity emission source (white dotted curve). (b) EM reconstruction using the true tissue optical properties. (c) Three-dimensional Gaussian blurring of the kidney source image volume resampled at 2 mm voxel resolution (see the text) using a 3 mm kernel. (d) EM reconstruction for a −50% μa error in all tissues. (e) EM reconstruction for a +50% μa error in all tissues.
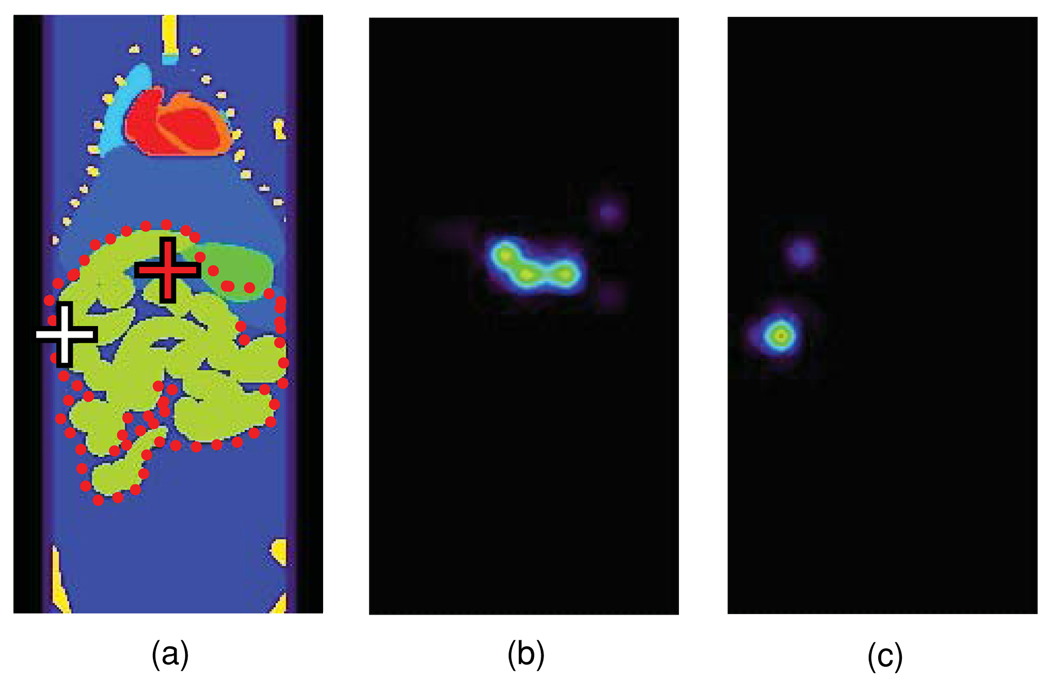
The need to determine the anatomical map of each mouse being imaged can be an additional source of uncertainty in the assignment of tissue optical properties. Typically, micro-MRI systems are less accessible than micro-CT, which however have a much lower soft tissue contrast (Ford et al 2003). As a result, tissue boundaries become ill-defined and tissue segmentation errors may occur. A worst-case scenario was simulated by artificially assigning the gut optical properties to an image volume containing parts of the liver, spleen, stomach and some fat in-between the gut folds (volume cross section outlined in figure 5(a)). Positive and negative discrepancies between μa and values for these tissues relative to bowel spanned two orders of magnitude. In one test case, a point source was placed near the actual gut–liver interface at the torso centre and in another a point source was placed at the gut–fat interface near the torso surface (red and white crosses, respectively, in figure 5(a)). The OPET-reconstructed source at the torso centre included the true source volume but also suffered distortions (figure 5(b)). In contrast, the source near the surface was localized correctly (figure 5(c)).
Figure 5.
(a) Coronal view of the mouse torso including a cross section of the volume (red dotted curve) in which all tissues were assigned the gut optical properties. Point sources were placed near the torso centre (red cross) and near the tissue surface (white cross). (b) EM reconstruction for the point source at the torso centre. (c) EM reconstruction for the point source near the torso surface.
Another practical difficulty could arise when the conditions for diffuse photon propagation in tissues are not satisfied due to non-scattering inclusions such as gas pockets in the gut. OPET measurements in the presence and absence of a gas pocket (~125 mm3) were simulated by a previously reported (Alexandrakis et al 2005) Monte Carlo code (MC, 106 photon histories for each of five emission wavelengths—see Methods section). EM reconstructions were performed using the diffusion-theory-calculated P-matrix, which did not take into account that pocket’s presence. In a worst-case scenario, a point source was placed on a gut wall facing the gas pocket (figure 6(a), red cross). This placement resulted in a false localization of the point source near the surface (figure 6(b)). Contrarily, in the pocket’s absence the source was localized correctly (figure 6(c)). Moreover, the localization of a point source 6 mm away from the gas pocket (figure 6(a), white cross) was not significantly perturbed by its presence (figure 6(d)).
Figure 6.
(a) Transverse view of the mouse torso with a gas pocket in the gut (white area) and two point sources—one adjacent (red cross) and one 6 mm away from it (white cross). (b) The source adjacent to the pocket was falsely localized near the surface and away for its true location (red cross). (c) Reconstructed source in the absence of a gas pocket. (d) Reconstructed source at 6 mm away from the gas pocket.
Discussion and conclusions
The impact of inaccurate tissue optical property assignments on the tomographic localization of bioluminescent sources was explored by simulation of an OPET imaging system. The localization of sources was affected by optical property errors in all tissues encountered by the emitted photons. Tissue absorption and scattering errors of the same sign and percentile magnitude had qualitatively similar effects on the reconstructed images.
The effects of tissue μa and underestimation on the EM-reconstructed images were different compared to those resulting from overestimation of these values by the same amount (figures 1(c) and (d) and figures 4(d) and (e)). The capacity to localize sources for a given optical property error magnitude was impaired with source depth (figure 2, columns). In addition, correct localization gradually failed at a given source depth as the magnitude of optical property errors increased (figure 2, rows). Errors of opposite sign in μa and resulted in a partial compensation of their detrimental effects in the reconstructed images (figure 3(a)). Tissue segmentation errors contributed to optical property assignment errors, which in turn affected the localization of sources in deep tissues (figure 5(b)). The violation of photon diffusion conditions due to the presence of non-scattering inclusions in the gut also affected the localization of emission sources situated in their immediate vicinity (figure 6(b)). Importantly, the kidney source simulations demonstrated the increased difficulty of reconstructing distributed sources correctly using the EM algorithm even when all tissue optical properties were known exactly (figure 4(b)).
For all the cases where only OPET data results were presented, the corresponding HiResOPET reconstructions have also been performed (not shown). The general observation was that for noise-free HiResOPET data source localization was somewhat improved, but image reconstruction artefacts were similar to those seen for OPET data (e.g. figures 1(e) and (f)). More importantly, increased detector spatial sampling improved robustness to a spatially uniform background noise (e.g. figures 3(c) and (d)). However, this work did not explore how source localization could deteriorate under realistic noise conditions. Mouse tissues are known to have a spatially heterogeneous autoluminescence background (Troy et al 2004), which was not modelled here. In addition, low SNR measurements could be dominated by any unaccounted differences between the actual experimental system’s performance and its theoretical model. In future experimental work, we propose to explore the performance of the OPET system, currently under development in our laboratory, over a wide range of SNR conditions.
The required percentile accuracy in tissue optical properties for correct localization of sources in the gut area of the mouse torso is a function of source location. In addition to that, the required accuracy is also a function of the actual physiological optical property values. The simulations performed for both OPET and HiResOPET data, using physiologically relevant optical properties, provided a rough rule of thumb guide for point sources in the absence of any significant noise background: errors in μa and for all tissues in the gut area should not exceed ~10% for sources at the torso centre (13 mm deep) and ~25% for sources at the torso half-radius. For sources near the surface, any choice of optical properties within the range of physiological values would suffice. More work is needed in order to attain accurate reconstructions of distributed sources.
Acknowledgments
This work was supported by the NIBIB R01-EB001458, NIH/NCI R25 CA098010:01 and DE-FC02-02ER63520 grants.
References
- Alexandrakis G, Rannou FR, Chatziioannou AF. Tomographic bioluminescence imaging by use of a combined optical-PET (OPET) system: a computer simulation feasibility study. Phys. Med. Biol. 2005;50:4225–4241. doi: 10.1088/0031-9155/50/17/021. [DOI] [PMC free article] [PubMed] [Google Scholar]
- Arridge SR, Schweiger M, Hiraoka M, Delpy DT. A finite element approach for modeling photon transport in tissue. Med. Phys. 1993;20:299–309. doi: 10.1118/1.597069. [DOI] [PubMed] [Google Scholar]
- Chatziioannou AF. Molecular imaging of small animals with dedicated PET tomographs. Eur. J. Nucl. Med. Mol. Imaging. 2002;29:98–114. doi: 10.1007/s00259-001-0683-3. [DOI] [PubMed] [Google Scholar]
- Chaudhari AJ, Darvas F, Bading JR, Moats RA, Conti PS, Smith DJ, Cherry SR, Leahy R. Hyperspectral and multispectral bioluminescence optical tomography for small animal imaging. Phys. Med. Biol. 2005;50:5421–5441. doi: 10.1088/0031-9155/50/23/001. [DOI] [PubMed] [Google Scholar]
- Dehghani H, Davis S, Jiang S, Pogue BW, Paulsen KD, Patterson MS. Spectrally-resolved bioluminescence optical tomography. Opt. Lett. 2006;31:365–367. doi: 10.1364/ol.31.000365. [DOI] [PubMed] [Google Scholar]
- Ford NL, Thornton MM, Holdsworth DW. Fundamental image quality limits for microcomputed tomography in small animals. Med. Phys. 2003;30:2869–2877. doi: 10.1118/1.1617353. [DOI] [PubMed] [Google Scholar]
- Kuo C, Coquoz O, Stearns DG, Rice B. Diffuse luminescence tomography of in vivo bioluminescent markers using multi-spectral data; Society for Molecular Imaging 3rd Annual Meeting (St. Louis); Cambridge, MA: MIT Press; 2004. p. 227. [Google Scholar]
- Liow JS, Strother SC. The convergence of object dependent resolution in maximum likelihood based tomographic image reconstruction. Phys. Med. Biol. 1993;38:55–70. doi: 10.1088/0031-9155/38/1/005. [DOI] [PubMed] [Google Scholar]
- Prout DL, Silverman RW, Chatziioannou A. Detector concept for OPET—a combined PET and optical imaging system. IEEE Trans. Nucl. Sci. 2004;51:752–756. doi: 10.1109/TNS.2004.829736. [DOI] [PMC free article] [PubMed] [Google Scholar]
- Rannou FR, Kohli V, Prout DL, Chatziioannou AF. Investigation of OPET performance using GATE, a Geant4-based simulation software. IEEE Trans. Nucl. Sci. 2004;51:2713–2717. doi: 10.1109/TNS.2004.835737. [DOI] [PMC free article] [PubMed] [Google Scholar]
- Rice BW, Cable MD, Nelson MB. In vivo imaging of light-emitting probes. J. Biomed. Opt. 2001;6:432–440. doi: 10.1117/1.1413210. [DOI] [PubMed] [Google Scholar]
- Segars WP, Tsui BM, Frey EC, Johnson GA, Berr SS. Development of a 4D digital mouse phantom for molecular imaging research. Mol. Imaging Biol. 2004;6:149–159. doi: 10.1016/j.mibio.2004.03.002. [DOI] [PubMed] [Google Scholar]
- Shepp LA, Vardi Y. Maximum likelihood reconstruction for emission tomography. IEEE Trans. Med. Imaging. 1982;1:113–122. doi: 10.1109/TMI.1982.4307558. [DOI] [PubMed] [Google Scholar]
- Troy T, Jekic-McMullen D, Sambucetti L, Rice B. Quantitative comparison of the sensitivity of detection of fluorescent and bioluminescent reporters in animal models. Mol. Imaging. 2004;3:9–23. doi: 10.1162/15353500200403196. [DOI] [PubMed] [Google Scholar]


