

Abstract
Objectives
No reliable molecular biomarker is currently available for clinical application in the management of head and neck cancer patients. The AKT/MTOR pathway is activated in 90-100% of HNSCC and could be promising biomarkers closely linked to cancer incidence.
Methods
Oral mucosa from non-cancer patients were compared to HNSCC tumors and junctional zone mucosa. The candidate biomarkers MTOR, AKT, 4EBP1, and S6 kinase, signaling components upstream and downstream of MTOR that appear dysregulated in HNSCC were evaluated using immunohistochemistry (IHC) and western blot.
Results
Expression of phosphorylated AKT and phosphorylated MTOR were significantly higher in cancer patient tumors compared to non-cancer oral mucosa samples (p=0.004 and p=0.026 respectively) by western. pMTOR and p4EBP1 expression were higher in patient junctional zones compared to tumors (p=0.017 and p=0.022 respectively) and no difference in p-AKT or p-S6 expression in HNSCC patients' junctional zone compared to tumors. IHC demonstrated p-MTOR expression was 81.9% sensitive and 100% specific in differentiating cancer from non-cancer mucosa, while p-4EBP1 expression by IHC was only 50.0% sensitive and 95.5% specific in differentiating normal mucosa from HNSCC (p<0.01).
Conclusions
Phosphorylated MTOR appears to be a reliable biomarker by both western (p=0.026) and IHC in human head and neck cancer (p<0.001). Moreover, phosphorylated AKT, which is immediately upstream of MTOR, is a potential biomarker that should be further studied. Clinical trials with MTOR inhibitors are being evaluated for HNSCC, and selecting patients that are likely to respond to these inhibitors requires identifying and validating predictive biomarkers of response.
Keywords: 4EBP1, S6 kinase, HNSCC, oral mucosa
Introduction
Head and neck cancer is the fifth most common malignancy worldwide, and accounts for 3.3 percent of malignancies in the United States 1, with an estimated 47,560 Americans developing HNSCC and 11,260 deaths annually 2. Treatment advances have not significantly improved the overall survival rates (∼45%) over the last three decades 3. Second primary tumors (SPT) from early stage disease treatment failure, and recurrence/metastasis in advanced stage disease result in increased morbidity and mortality. The probability of SPT occurs at a constant risk per year following initial treatment with a 5-year survival rate of 25% due to field cancerization in these patients.
Early stage detection of HNSCC offers the best opportunity for a good prognosis. Five year survival rates of HNSCC are one of the lowest among all types of cancer due to detection of advanced stage disease. These patients endure morbid surgical treatments leading to functional as well as cosmetic debilities. Better disease management may be facilitated with early detection through biomarkers that play a role in predicting pre-cancers that could progress to invasive lesions or recurrences.
In 1992, the Food and Drug Administration (FDA) published the “accelerated approval” rule that accelerates therapeutic approval based on surrogate endpoints that predict clinical benefit of therapeutics4. Therefore, an emphasis on identifying and validating biomarkers has been a goal of HNSCC research. Newer classifications of the disease are also possible on the basis of understanding molecular mechanisms underlying HNSCC that provides a reliable biomarker to predict response to treatment 5, determine absence or presence of cancer and serve as a surrogate endpoint to assist monitoring a patient's disease status during the course of treatment. Biomarkers as intermediate endpoints could more rapidly assess interventions for primary cancer prevention and interventions as well as address clinical trial feasibility issues including large patient numbers, length of study, and cost when cancer occurrence or recurrence is used as an endpoint 6. Our objective was to identify a marker that is consistently present in tumor tissue and absent in normal tissue, and determine sensitivity and specificity using two commonly used approaches: western blot and IHC to determine which targets could be used consistently and reliably in a pathway that is activated in a majority of HNSCC. Currently a reliable biomarker has not been validated for application in the clinical practice of head and neck cancer.
Signaling pathways upstream and downstream of MTOR appear dysregulated in 90-100% of HNSCC 7 suggesting that markers in the AKT/MTOR pathway (Fig. 1) are integral to the process of tumorigenesis and survival. Activation of the AKT/MTOR signaling pathway functionally activates eukaryotic initiation factor 4E (eIF4E) 8. eIF4E is overexpressed in tumor-free surgical margins and is an independent predictor of recurrence 9. As the degree of dysplasia increases, there is an increase in overexpression of eIF4E in surgical margins of HNSCC patients10. Overexpression of eIF4E leads to increased translation of mRNAs with highly structured untranslated regions (UTR) which up regulates a number of oncogene products involved in tumor progression 11.
Figure 1.

AKT/MTOR pathway. IRS1 = insulin receptor substrate 1, PI3K = phosphoinositide 3-kinase, PIP3 = Phosphatidylinositol (3,4,5)-trisphosphate (PtdIns(3,4,5)P3), PTEN = phosphatase and tensin homolog, PDK1 = 3-phosphoinositide-dependent kinase-1, PDK2 = 3-phosphoinositide-dependent kinase-2, AKT = another kinase of transcription, GSK3 = glycogen synthase kinase 3, CyclinD1 = regulates transition from G1 to S phase, MDM2 = murine double minute oncogene 2, p53 = tumor protein 53, TSC2 = tuberous sclerosis complex 2, TSC1 = tuberous sclerosis complex 1, RHEB = Ras homolog enriched in brain, MTOR = mammalian target of rapamycin, MTORC1 = mammalian target of rapamycin complex 1, MTORC2 = mammalian target of rapamycin complex 2, RAPTOR = regulatory associated protein of MTOR, RICTOR = RAPTOR independent companion of MTOR, MLST8 = MTOR associated protein, LST8 homolog (S. cerevisiae), MAPKAP1 = mitogen-activated-protein-kinase-associated protein 1, EIF4EBP1 = eukaryotic translation initiation factor 4E binding protein 1, 4E = eukaryotic translation initiation factor 4E, S6K= p70-ribosomal protein S6 kinase, S6 = ribosomal protein S6.
MTOR signaling is activated in many cancer types and in conditions of proliferative dysregulation 12. Activation of the AKT/MTOR pathway contributes to carcinogenesis by inducing cell survival, proliferation, and angiogenesis in a variety of cell types 13,14. MTOR modulates 4EBP1 by direct phosphorylation and thereby releases bound eIF4E, regulating the translational machinery. MTOR inhibitors have been evaluated in several clinical trials of mixed solid tumor entities that include SCC with promising results 15. Hence we studied AKT/MTOR pathway component expression in HNSCC patients as a potentially reliable biomarker. A reliable biomarker must demonstrate sensitivity and specificity. The most commonly used techniques for biomarker validation are western blot, polymerase chain reaction, IHC, mass spectrometry and multidimensional liquid chromatography. IHC allows for a semi-quantitative assessment unlike western blot analysis that allows for measuring a quantitative change in biomarkers but may also include total tumor tissue, such as stroma and infiltrating host inflammatory cells. An advantage of IHC analysis over western analysis is the ability to distinguish non-viable and non-tumor components such as stroma that are not included in the scoring of the biomarker analyzed. We show here a comparison of IHC with western blot analysis for biomarker evaluation of HNSCC patients to identify a reliable and consistent biomarker in this pathway for HNSCC.
Materials and Methods
Samples and Controls
Study samples were obtained from newly diagnosed HNSCC patients (Tables I and II) treated at Louisiana State University Health Science Center and the Overton Brooks Veterans Administration Hospital who had surgical resection as primary treatment modality. Whenever feasible, cancer samples included tumor tissue and the adjacent advancing mucosa edge referred to here as the junctional zone. For non-cancer patients, uvulas were collected from patients undergoing uvulopalatopharyngoplasty for sleep apnea, and all procedures were performed in accordance with the Helsinki Declaration of 1975 (revised 1983). The study was approved by the institutional review board, and informed consent was obtained from all participants. Subjects were enrolled from 2000 to 2008. Data from 72 head and neck cancer tumors and 22 non-cancer uvula samples were analyzed by IHC and 44 tumor, 19 junctional zone and 29 uvula samples were analyzed by western. Biomarker expression was compared between tumor, junctional zone and uvula by western. Tumor and junctional zone samples were also combined to form a group representing cancer patients and compared to uvula samples representing non-cancer patients. The junctional zone tissues for western blot analysis were collected from 12 larynx, 4 oral cavity and 3 oropharynx cancers. Comparison also included biomarker expression among various malignant anatomical sites. It was also possible to examine expression of the markers over time. This included biopsies from the same patient at two time points, i.e. from the subject's diagnostic biopsy and subsequent resection surgery. In addition, within-sample variability from tumors and junctional zone were also analyzed, as expression within a lesion could change due to the heterogeneous nature of the tumor, as can occur with very large or necrotic tumors.
Table I. Demographic and Clinical Characteristics of Patients Analyzed with IHC.
| Sex | Male | 52 | 72.2% |
| Female | 20 | 27.8% | |
| Race | White | 43 | 59.7% |
| Asian | 3 | 4.2% | |
| African-American | 26 | 36.1% | |
| Age | <55 | 26 | 36.1% |
| 55-64 | 28 | 38.9% | |
| >64 | 18 | 25.0% | |
| Primary Tumor Site | Oral Cavity | 35 | 48.6% |
| Oropharynx | 4 | 5.6% | |
| Larynx | 33 | 45.8% | |
| Clinical TNM Stage | I | 8 | 11.1% |
| II | 18 | 19.7% | |
| III | 17 | 25.0% | |
| IV | 25 | 23.6% | |
| Unknown | 4 | 34.7% | |
| Clinical T Stage | T1 | 8 | 11.1% |
| T2 | 18 | 25.0% | |
| T3 | 17 | 23.6% | |
| T4 | 25 | 34.7% | |
| Tx | 4 | 5.6% | |
| Clinical N Stage | N0 | 32 | 44.4% |
| N1 | 10 | 13.9% | |
| N2 | 25 | 34.7% | |
| N3 | 1 | 1.4% | |
| Unknown | 4 | 5.6% | |
| Differentiation | Well-differentiated | 3 | 4.2% |
| Moderate | 45 | 62.5% | |
| Poor | 13 | 18.1% | |
| Unknown | 11 | 15.3% |
Table II. Demographic and Clinical Characteristics of Patients Analyzed with Western Blot.
| Uvula | |||
| Sex | Male | 23 | 79.3% |
| Female | 6 | 20.7% | |
| Race | White | 18 | 62.1% |
| African American | 11 | 37.9% | |
| Other | 0 | 0% | |
| Age | <55 | 25 | 86.2% |
| 55-64 | 3 | 10.3% | |
| >64 | 1 | 3.4% | |
| HNSCC | |||
| Sex | Male | 37 | 84.1% |
| Female | 7 | 15.9% | |
| Race | White | 28 | 63.6% |
| Asian | 1 | 2.3% | |
| African-American | 15 | 34.1% | |
| Age | <55 | 20 | 45.5% |
| 55-64 | 14 | 31.8% | |
| >64 | 10 | 22.7% | |
| Primary Tumor Site | Oral Cavity | 15 | 34.1% |
| Oropharynx | 14 | 31.8% | |
| Hypopharynx | 2 | 4.5% | |
| Larynx | 13 | 29.5% | |
| Clinical TNM Stage | I | 1 | 2.3% |
| II | 7 | 15.9% | |
| III | 7 | 15.9% | |
| IV | 29 | 65.9% | |
| Clinical T Stage | T1 | 1 | 2.3% |
| T2 | 9 | 20.5% | |
| T3 | 12 | 27.3% | |
| T4 | 22 | 50.0% | |
| Clinical N Stage | N0 | 16 | 36.4% |
| N1 | 5 | 11.4% | |
| N2 | 22 | 50.0% | |
| N3 | 1 | 2.4% | |
| Differentiation | Well-differentiated | 3 | 6.8% |
| Moderate | 31 | 70.5% | |
| Poor | 4 | 9.1% | |
| Unknown | 6 | 13.6% | |
Western Blot Analysis
Soluble proteins were extracted according to laboratory protocol 8 with the following rabbit polyclonal primary antibodies from Cell Signaling, Beverly, MA: phospho 4EBP1 (Thr37/46, 1:300 dilution), phospho S6 ribosomal protein (serine 235/236, 1:100), phospho-AKT (Ser473, 1:100), phospho-MTOR (Ser2448, 1:100). Expression levels of each marker was quantified by normalizing to actin. The number of tumor or junctional zone samples with positive expression was scored for samples with relative expression greater than the relative expression of the non-cancer uvula samples on each western, and negative expression was scored for samples with relative expression less than the average relative expression of the non-cancer uvula samples on each western.
Immunohistochemical analysis
IHC staining for p-4EBP1 and p-MTOR was performed as described previously 8. The slides were read and scored by the study pathologist (FA) who was unaware of the clinical details. Depending on the number of cells stained and the intensity of staining, the score was allotted. For both antibodies, no staining was scored as [-] (minus), weak or focal staining as [+], intermediate staining as [++], and strong staining as [+++]. The scoring was further simplified for this study by considering only ++ and +++ as positive staining while − and + (focal) as negative staining. Here only the basal layer staining was considered in the determination of positive and negative staining, disregarding the staining status of the superficial epithelial layers. Our retrospective study 16 was confirmed by our prospective study 9 that showed recurrence was predicted only when the basal cell layer was positive and that non-cancer patients had no expression in the basal cell layer although there was some staining of the superficial layers.
Statistics applied for the analysis
The data on the biomarker expression levels obtained by western was analyzed statistically with SPSS (version 16.0). Analysis was done to compare the different biomarker expression in different groups of patients. The paired Wilcoxon test was used for variability analysis at two time points, i.e. tumor obtained at the time of diagnosis (panendoscopy) and then a few weeks later at the time of the resection. The difference in the p-MTOR, p-4EBP1, p-AKT and p-S6 levels between the tumor and non-cancer uvula samples, between junctional zone and uvula samples was examined by western using a Mann-Whitney U test. The difference in biomarker levels between the tumor samples and the junctional zone was examined using a Wilcoxon Sign Rank Test. Sensitivity and specificity of IHC expression of p-MTOR and p-4EBP1 for predicting HNSCC was calculated, and analyzed by Chi-Square test for independence.
Results
Biomarker analysis by western
Tumor samples had significantly higher levels of p-MTOR than uvula samples (p=0.026). Tumor samples also had significantly higher levels of p-AKT than uvula samples (p=0.004). Interestingly, tumor samples had significantly lower levels of p-4EBP1 than uvula samples (p<0.001). There was no statistically significant difference in the p-S6 levels between tumor samples (m place =46.49) and uvula samples (m=54.88; U=815.500, p=.179). After combining tumor and junctional zone, similar results were noted as when tumor alone was compared to non-cancer uvula samples.
To determine if the difference in the above samples could be due to combining the potentially less active tumor core and actively dividing junctional zone mucosa, we compared the tumor samples to the junctional zone mucosa. Tumor samples had significantly lower levels of p-MTOR than the corresponding junctional zone samples (p=0.017). p-4EBP1 levels were also lower in the tumor tissue as compared to the junctional zone samples (p=0.022), suggesting the junctional zone is the more active rapidly dividing region of the tumor. There was no statistically significant difference in the levels of p-AKT (p=0.248) and p-S6 (p=0.058) between the tumor samples and the junctional zone tissue.
Junctional zone samples had significantly higher levels of p-MTOR than uvula samples (p=0.001). Similarly junctional zone samples had significantly higher levels of p-AKT compared to uvula samples (p=0.009). There was no statistically significant difference in p-4EBP1 levels in junctional zone tissue samples and uvula samples (p=0.11). Similarly p-S6 levels were not different when comparing junctional zone tissue with uvula samples (p=0.625).
When the three different sites in the head and neck were compared for biomarker expression (i.e. larynx, oral cavity and oropharynx) there was no difference in the expression of pAKT, pMTOR, pS6, and p4EBP1 based on cancer site as determined by the Kruskal-Wallis test (p values 0.31, 0.25, 0.34, and 0.36 respectively).
We also compared the number of tumor and junctional zone samples for expression of each marker (Table III). Not surprisingly, a higher percentage of junctional zone samples were positive compared to the percentage of tumors positive for p-AKT (94.1% vs 72.7%), p-MTOR (81.3% vs 60.0%), p-S6 (57.9% vs 38.6%) and p-4EBP1 (52.6% vs 22.7%). Additionally, p-AKT and p-MTOR were highly sensitive in the junctional zone, suggesting the junctional zone is the more active rapidly dividing region of the tumor and is the best region of the tumor to assess for marker analysis.
Table III. Biomarker Expression of the Entire Tissue Sample by Western or in the Basal Cell Layer by IHC.
| Western* | ||||
| Tumors | p-AKT | p-MTOR | p-S6 | p-4EBP1 |
| + | 32 | 18 | 17 | 10 |
| - | 12 | 12 | 27 | 34 |
| Total | 44 | 30 | 44 | 44 |
| Junctional Zone | ||||
| + | 16 | 13 | 11 | 10 |
| - | 1 | 3 | 8 | 9 |
| Total | 17 | 16 | 19 | 19 |
| Sensitivity Tumors | 72.7% | 60.0% | 38.6% | 22.7% |
| Junctional Zone | 94.1% | 81.3% | 57.9% | 52.6% |
| IHC | ||||
| Tumors | p-MTOR | p-4EBP1 | ||
| + | 59 | 36 | ||
| - | 13 | 36 | ||
| Total | 72 | 72 | ||
| Uvula | ||||
| + | 0 | 1 | ||
| - | 22 | 21 | ||
| Total | 22 | 22 | ||
| Sensitivity | 81.9% | 50.0% | ||
| Specificity | 100% | 95.5% | ||
We determined that biopsy at two different time points is not important for intra-tumoral variability of AKT/MTOR pathway biomarkers, especially among advanced tumors, which are typically large. It was possible to examine the variability between patients, in the same patient taken at two time points, i.e. at the time of biopsy and then at the time of surgery. We did not have sufficient tissue to analyze p-MTOR for comparison at two different time points due to the small biopsy size. There were no differences in tissue levels of the biomarkers p-AKT, p-S6 and p-4EBP1 taken at biopsy and approximately 3 weeks later during surgery (p values 0.13, 0.32 and 0.13, respectively). This illustrates that without intervention, there are no spatial changes over time in the biomarkers.
Biomarker analysis by Immunohistochemistry
Tissue availability limited complete analysis to only p-MTOR and p-4EBP1 biomarker expression by IHC in 72 HNSCC patients (Table III). IHC analysis of 72 tumor and 22 uvula samples demonstrated tumor samples overexpressed p-MTOR (81.9% vs. 0%) and p-4EBP1 (50.0% vs. 4.5%) compared to uvula samples. p-MTOR sensitivity (81.9%) and specificity (100%) was greater than p-4EBP1. This suggests p-MTOR overexpression may be a diagnostic marker for HNSCC. We further analyzed p-4EBP1 and p-MTOR staining in the basal cell layer, upper third, and middle third layers of the epithelium (Fig. 2) to determine if IHC could explain why tumor samples had significantly lower levels of p-4EBP1 than uvula samples by western unlike that noted with p-MTOR. Surprisingly although only 4.5% of uvula samples stained positive for p-4EBP1 in the basal cell layer 69.4% and 61.1% of the uvula samples stained positive in the superficial layers (both middle third and upper third) unlike p-MTOR staining with no staining of the basal cell layer and only 22.2% and 16.7% stained positive in the superficial layers (both middle third and upper third). IHC criteria for positive staining is defined as overexpression of p-4EBP1 and p-MTOR in the basal cell layer. Therefore, by IHC criteria, the uvulas were significantly lower in p-4EBP1 expression than tumors. However, as western involves homogenization of all epithelial layers, the uvulas appeared to have higher expression of p-4EBP1 than tumors.
Figure 2.
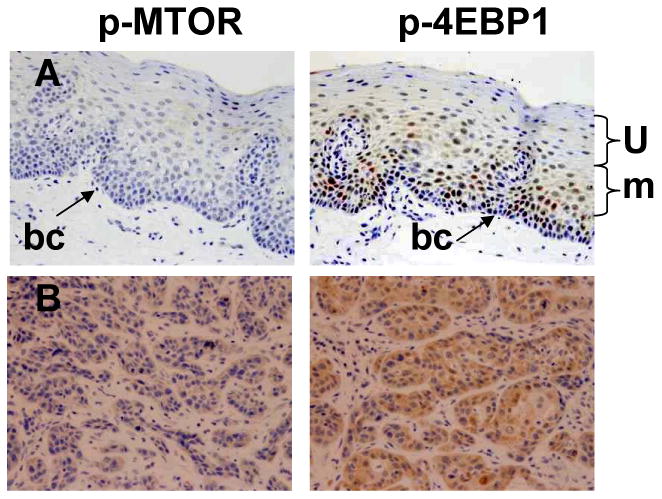
Biomarker analysis by IHC. A. Representative non-cancer uvula patient samples with negative (blue) staining of basal cell layer (bc, arrow), although some staining is noted in the superficial layers (u, m). B. Representative tumor samples with strong positive (brown) staining of the indicated antibody. BC- basal cell layer, m- middle third layer epithelium, u-upper third layer epithelium.
Discussion
International Conference of Harmonisation (ICH) guideline E9 on statistical principles for clinical trials recommends validation of surrogate endpoints such as biomarkers by regression analysis or the sensitivity-specificity approach 17. We show here that p-MTOR appears to be a sensitive and specific biomarker by both western and even more so by IHC. p-AKT which is immediately upstream of MTOR was also confirmed by western, and is a potential biomarker that should be further studied by IHC. HNSCC is one of the few cancers where AKT/MTOR is activated in almost all tumors 7, suggesting its sensitivity as a biomarker for HNSCC diagnosis and treatment response. A large international study by the NIDCR showed a high degree of AKT activation (99%) by IHC 7. We did not have sufficient tissue to confirm these results by IHC.
Previous studies have shown a higher degree of p-MTOR activation 18 than our study (93% vs. 81.9%). One explanation is site of origin since the previous study was restricted to tonsil cancer and our study included all head and neck sites. Our results indicate p-MTOR expression is significantly higher in cancer patient junctional zone tumors compared to non-cancer oral mucosa samples, and is highly sensitive and specific for HNSCC by western and IHC. MTOR inhibitors are now being evaluated in clinical trials for HNSCC 19, and selecting patients that are likely to respond to these inhibitors requires identifying and validating predictive biomarkers of response.
We found the site of biopsy does matter, depending on the biomarker analyzed and technique used. 4EBP1 plays a critical role in controlling cell survival and proliferation 20,21 through binding inhibition of EIF4E. Phosphorylation of 4EBP1 releases eIF4E and activates protein synthesis. Therefore, 4EBP1 is tightly regulated as it plays a central role in cell transformation. We found p-4EBP1 expression significantly higher in normal non-cancer uvula tissue compared to tumor, but no significant difference between uvula and junctional zone tissue. However, when tumor and junctional zone tissues were combined, the difference was no longer significant, which may suggest the junctional zone of tumors represents the tumor better than the core biopsy, which may be potentially less active. Our analysis consistently found more p-4EBP1 expression in the superficial layers of the uvula samples than in the tumor samples (Fig. 2), and may account for the higher expression of p-4EBP1 in the non-cancer uvula samples than in the tumor samples by western, where the entire tissue is homogenized, unlike IHC. 4EBP1 is inactive upon phosphorylation, and other studies have shown p-4EBP1 overexpression correlates with more aggressive forms of cancer 21. One-half of the HNSCC tumor tissues analyzed by IHC in our study overexpressed p-4EBP1, consistent with the moderate to strong p-4EBP1 overexpression in cervical cancer 21.
We did not have sufficient tissue to compare all markers in tumors to uvulas by IHC. It is possible that similar to p-4EBP1, p-S6 may demonstrate superficial epithelium staining is higher than in the tumors, and is consistent with a previous report demonstrating p-S6 expression is restricted to suprabasal layers 22. Western blot analysis of p-S6 demonstrated no statistically significant difference between tumor or junctional zone samples and non-cancer patient uvula samples. We found p-S6 overexpressed more in early stage (50%, n=8) compared to late stage (36.1%, n=36) HNSCC, although this difference may be due to the relatively small available sample size of the early stage tumors. There was no statistically significant difference between grade of tumor differentiation and expression of the biomarkers (p≥0.0925).
Western blot analysis demonstrated non-cancer patient uvula samples had lower p-MTOR expression than head and neck cancer patients irrespective of biopsy location, i.e. whether the sample was tumor or junctional zone tissue, and was further overexpressed in the junctional zone tissue. This suggests that higher p-MTOR expression is specific to cancer patients. Expression of p-MTOR was further confirmed by IHC, with 100% specificity when comparing cancer to non-cancer samples, indicating that p-MTOR is a valid and reliable biomarker of HNSCC, irrespective of technique. Universal expression of EGFR led to its role as a HNSCC biomarker since EGFR signaling activates a variety of pathways including AKT/MTOR, although a majority of patients do not respond to EGFR inhibitors 23. This indicates a need for more specific markers of HNSCC. MTOR appears to be the specific and sensitive biomarker for HNSCC.
Problems with validating biomarker arise from individual patient variation, cancer variability, stage, and location of biopsy. Lippman 24 proposed four criteria for biomarkers as intermediate endpoints and our data demonstrates that p-MTOR in particular meet these requirements. Lippman's first criterion is that biomarker expression in normal tissue should be different from that in high risk tissue. Biomarker analysis of p-MTOR expression in oral mucosa from non-cancer patients and tumors from HNSCC patients demonstrated that p-MTOR was sensitive and specific in differentiating cancer from non-cancer mucosa. Lippman's second criterion is that biomarkers can be detected in small tissue specimens, and we have successfully detected the various AKT/MTOR biomarkers on samples often as small as 5mm38,16. Lippman's third criterion is that biomarkers can be expressed in a quantity or pattern that can be correlated with the stage of carcinogenesis, and MTOR activation is an early and frequent event in HNSCC 25. We do not link recurrence to biomarkers of cancer occurrence in this study. We have previously shown that AKT/MTOR activation correlates with EIF4E, and EIF4E correlates with recurrence 8. Lippman's fourth criterion is that preclinical or early clinical data should indicate that the condition represented by a biomarker can be modulated by study agents. Significant inhibition of the MTOR signaling pathway in HNSCC preclinical models and clinical trials has been achieved with the MTOR inhibitors rapamycin and temsirolimus 19,22,26, fulfilling Lippman's fourth criterion. Although IHC is the standard in cancer diagnosis 27, we show here that western blot analysis, which uses less sample and is quantitative, was equally effective at validating p-MTOR as a biomarker in head and neck cancer. Compared to IHC analysis, western analysis is less expensive, less time consuming, requires less tissue and antibody, is comparatively easy to quantify, and requires less expertise for the analysis. However, all non-tumor components are present in the samples analyzed by western due to homogenization of samples, which could explain the unexpected p-4EBP1 results. IHC analysis has the ability to distinguish non-tumor components such as stroma that are not included in the scoring of the biomarker analyzed, although this also makes automated scoring more difficult and requires analysis by an experienced pathologist.
Conclusion
The ultimate goal of these studies is to integrate biomarkers into an effective treatment strategy for better disease management. ICH E9 guidelines recommend that biomarkers must demonstrate sensitivity and specificity for patient selection to minimize the risk of treating patients who may not otherwise benefit from a particular therapy. IHC is the universal standard in cancer diagnosis 27, although biomarkers remain to be validated for head and neck cancer treatment response. Validating biomarkers can facilitate understanding a patients' response to treatment, drug mechanisms, and disease progression or recurrence. This is especially important in head and neck cancer where up to 50% of patients with advanced stage disease develop a recurrence of HNSCC.
Acknowledgments
We are especially grateful to Wanda Green at LSUHSC-Shreveport for her IHC staining, and Sheila Anderson and Jeff Aaron from the Overton Brooks VA Medical Center.
Disclosure of funding: This work was supported by NIH R01 CA 102363-01 to C.O. Nathan
Footnotes
Conflict of Interest: None.
References
- 1.Parkin D, Pisani P, Ferlay J. Global cancer statistics. CA Cancer J Clin. 1999;49:33–64. doi: 10.3322/canjclin.49.1.33. [DOI] [PubMed] [Google Scholar]
- 2.Jemal A, Thun M, Ries L, et al. Annual Report to the Nation on the Status of Cancer, 1975–2005, Featuring Trends in Lung Cancer, Tobacco Use, and Tobacco Control. Journal of the National Cancer Institute. 2008;100:1672–1694. doi: 10.1093/jnci/djn389. [DOI] [PMC free article] [PubMed] [Google Scholar]
- 3.Vokes E, Weichselbaum R, Lippman S, Hong W. Head and neck cancer. N Engl J Med. 1993;328:184–194. doi: 10.1056/NEJM199301213280306. [DOI] [PubMed] [Google Scholar]
- 4.21CFR314.510 and 21CFR601.41, revised as of April 1, 2009.
- 5.Chang S, Califano J. Current status of biomarkers in head and neck cancer. J Surg Oncol. 2008;97:640–643. doi: 10.1002/jso.21023. [DOI] [PubMed] [Google Scholar]
- 6.Vourlekis J, Szabo E. Predicting Success in Cancer Prevention Trials. JNCI. 2003;95:178–179. doi: 10.1093/jnci/95.3.178. [DOI] [PubMed] [Google Scholar]
- 7.Molinolo A, Hewitt S, Amornphimoltham P, et al. Dissecting the Akt/mammalian target of rapamycin signaling network: emerging results from the head and neck cancer tissue array initiative. Clin Can Res. 2007;13:4964–4973. doi: 10.1158/1078-0432.CCR-07-1041. [DOI] [PubMed] [Google Scholar]
- 8.Nathan C, Amirghahari N, Abreo F, et al. Overexpressed eIF4E is functionally active in surgical margins of head and neck cancer patients via activation of the Akt/mammalian target of rapamycin pathway. Clin Can Res. 2004;10:5820–5827. doi: 10.1158/1078-0432.CCR-03-0483. [DOI] [PubMed] [Google Scholar]
- 9.Nathan C, Amirghahari N, Rice C, Abreo F, Shi R, Stucker F. Molecular analysis of surgical margins in head and neck squamous cell carcinoma patients. Laryngoscope. 2002;112:2129–2140. doi: 10.1097/00005537-200212000-00003. [DOI] [PubMed] [Google Scholar]
- 10.Nathan C, Franklin S, Abreo F, Nassar R, DeBenedetti A, Glass J. Analysis of surgical margins with the molecular marker eIF4E: a prognostic factor in patients with head and neck cancer. J Clin Oncol. 1999;17:2909–2914. doi: 10.1200/JCO.1999.17.9.2909. [DOI] [PubMed] [Google Scholar]
- 11.Pickering B, Willis A. The implications of structured 5′ untranslated regions on translation and disease. Semin Cell Dev Biol. 2005;16:39–47. doi: 10.1016/j.semcdb.2004.11.006. [DOI] [PubMed] [Google Scholar]
- 12.Meric-Bernstam F, Gonzalez-Angulo A. Targeting the mTOR signaling network for cancer therapy. J Clin Oncol. 2009;27:2278–2287. doi: 10.1200/JCO.2008.20.0766. [DOI] [PMC free article] [PubMed] [Google Scholar]
- 13.Huang S, Houghton P. Targeting mTOR signaling for cancer therapy. Curr Opin Pharmacol. 2003;3:371–377. doi: 10.1016/s1471-4892(03)00071-7. [DOI] [PubMed] [Google Scholar]
- 14.Huang S, Houghton P. Inhibitors of mammalian target of rapamycin as novel antitumor agents: from bench to clinic. Curr Opin Investig Drugs. 2002;3:295–304. [PubMed] [Google Scholar]
- 15.Konings I, Verweij J, Wiemer E, Sleijfer S. The applicability of mTOR inhibition in solid tumors. Curr Cancer Drug Targets. 2009;9:439–450. doi: 10.2174/156800909788166556. [DOI] [PubMed] [Google Scholar]
- 16.Nathan C, Franklin S, Abreo F, et al. Expression of eIF4E during head and neck tumorigenesis: possible role in angiogenesis. Laryngoscope. 1999;109:1253–1258. doi: 10.1097/00005537-199908000-00013. [DOI] [PubMed] [Google Scholar]
- 17.Cleophas T, Zwinderman A, Chaib A. Novel procedures for validating surrogate endpoints in clinical trials. Curr Clin Pharmacol. 2007;2:123–128. doi: 10.2174/157488407780598126. [DOI] [PubMed] [Google Scholar]
- 18.Brown R, Zhang P, Lun M, et al. Morphoproteomic and pharmacoproteomic rationale for mTOR effectors as therapeutic targets in head and neck squamous cell carcinoma. Ann Clin Lab Sci. 2006;36:273–282. [PubMed] [Google Scholar]
- 19.Nathan C, Mills G, Rong X, et al. An exploratory biomarker trial of an mTOR inhibitor in subjects with newly diagnosed advanced stage HNSCC. Proceedings AACR Supplement. 2007;48:42. [Google Scholar]
- 20.Heesom K, Gampel A, Mellor H, Denton R. Cell cycle-dependent phosphorylation of the translational repressor eIF-4E binding protein-1 (4E-BP1) Curr Biol. 2001;11:1374–1379. doi: 10.1016/s0960-9822(01)00422-5. [DOI] [PubMed] [Google Scholar]
- 21.Topisirovic I, Ruiz-Guitierrez M, Borden K. Phosphorylation of the Eukaryotic Translation Initiation Factor eIF4E Contributes to Its Transformation and mRNA Transport Activities. Cancer Res. 2004;64:8639–8642. doi: 10.1158/0008-5472.CAN-04-2677. [DOI] [PubMed] [Google Scholar]
- 22.Amornphimoltham P, Patel V, Sodhi A, et al. Mammalian target of rapamycin, a molecular target in squamous cell carcinomas of the head and neck. Cancer Res. 2005;65:9953–9961. doi: 10.1158/0008-5472.CAN-05-0921. [DOI] [PubMed] [Google Scholar]
- 23.Cooper J, Cohen E. Mechanisms of resistance to EGFR inhibitors in head and neck cancer. Head Neck. 2009 doi: 10.1002/hed.21109. [DOI] [PubMed] [Google Scholar]
- 24.Lippman S, Lee J, Lotan R, Hittelman W, Wargovich M, Hong W. Biomarkers as Intermediate End Points in Chemoprevention Trials. J Natl Cancer Inst. 1990;82:555–560. doi: 10.1093/jnci/82.7.555. [DOI] [PubMed] [Google Scholar]
- 25.Molinolo A, Amornphimoltham P, Squarize C, Castilho R, Patel V, Gutkind J. Dysregulated molecular networks in head and neck carcinogenesis. Oral Oncol. 2009;45:324–334. doi: 10.1016/j.oraloncology.2008.07.011. [DOI] [PMC free article] [PubMed] [Google Scholar]
- 26.Nathan C, Amirghahari N, Rong X, et al. Mammalian target of rapamycin inhibitors as possible adjuvant therapy for microscopic residual disease in head and neck squamous cell cancer. Cancer Res. 2007;67:2160–2168. doi: 10.1158/0008-5472.CAN-06-2449. [DOI] [PubMed] [Google Scholar]
- 27.Zwierzina H. Biomarkers in drug development. Ann Oncol. 2008;19:33–37. doi: 10.1093/annonc/mdn309. [DOI] [PubMed] [Google Scholar]