

Abstract
Diffusion imaging and bound pool fraction (BPF) mapping are two quantitative magnetic resonance imaging techniques that measure microstructural features of the white matter of the brain. Diffusion imaging provides a quantitative measure of the diffusivity of water in tissue. BPF mapping is a quantitative magnetization transfer (qMT) technique that estimates the proportion of exchanging protons bound to macromolecules, such as those found in myelin, and is thus a more direct measure of myelin content than diffusion. In this work, we combine BPF estimates of macromolecular content with measurements of diffusivity within human white matter tracts. Within the white matter, the correlation between BPFs and diffusivity measures such as fractional anisotropy and radial diffusivity was modest, suggesting that diffusion tensor imaging and bound pool fractions are complementary techniques. We found that several major tracts have high BPF, suggesting a higher density of myelin in these tracts. We interpret these results in the context of a quantitative tissue model.
Keywords: magnetic resonance imaging, bound pool fractions, quantitative magnetization transfer, diffusion tensor imaging, white matter, myelin, relaxometry, qMRI, g-ratio
1. Introduction
Most long-range axons in the white matter of the vertebrate brain are wrapped in myelin, a dielectric material, to enable rapid and metabolically efficient conduction of neural signals over long distances (Rushton, 1951; Waxman, 1975; Baumann and Pham-Dinh, 2001). Myelin has long been known to be important in healthy brain function due to the debilitating effects of demyelinating diseases such as Multiple Sclerosis. In addition, white matter microstructural features such as myelination are important in learning and cognition more generally (see (Fields, 2008) for a review).
Diffusion imaging is a non-invasive Magnetic Resonance (MR) method that provides quantitative information about how water diffuses within the brain (Le Bihan et al., 1988; Basser et al., 1994). Water diffusion probes microscopic tissue structure, so that when properly interpreted, macroscopic diffusion imaging measurements can provide insights into several aspects of tissue microstructure. Diffusion Tensor Imaging (DTI) has been used to measure white matter in development (e.g., (Mukherjee et al., 2001)), normal brain function (e.g., (Stufflebeam et al., 2008)), and pathology (e.g., (Sundgren et al., 2004)). The diffusion tensor in white matter is often anisotropic; its orientation indicates the dominant orientation of the axons that comprise the white matter, and its magnitude measures diffusivity along and across the axons. Diffusion anisotropy is affected by myelination (Song et al., 2002) and is sometimes interpreted as reflecting the degree of myelination. But in addition to being affected by myelination, diffusion anisotropy is also affected by factors such as fiber tract geometry (Beaulieu, 2002), especially in regions where tracts cross. Given these multiple influences, diffusion anisotropy without supplementary measures is not a reliable indicator of myelination (Paus, 2009). However, DTI combined with a more direct measure of myelination can provide a more complete understanding of white matter tissue microstructure.
Magnetization transfer (MT) measures an additional MR contrast mechanism that is sensitive to white matter microstructure. Myelin is approximately 80% lipid and 20% protein (Laule et al., 2007); the MT myelin sensitivity arises because of the large number of myelin-bound protons that exchange magnetization with the unbound protons (Edzes and Samulski, 1977; Wolff and Balaban, 1989). The MT effect can be quantified using the magnetization transfer ratio (MTR) (Dousset et al., 1992), and it can be adequately modelled using a two-pool model (Henkelman et al., 1993; Morrison and Henkelman, 1995; Levesque and Pike, 2009). A quantitative relationship between measures of MTR and myelin has been demonstrated in several types of studies (Kucharczyk et al., 1994; Rademacher et al., 1999; Filippi et al., 1995; Schmierer et al., 2004). During development the MTR increases in heavily myelinated tracts (Rademacher et al., 1999). The association of MTR with myelin has been validated in animal studies, postmortem tissue samples, and demyelinating diseases (Horsfield, 2005) including multiple sclerosis in vivo (Filippi et al., 1995), and ex vivo (Schmierer et al., 2004).
While MTR is sensitive to myelination, the MTR metric includes contributions from several MR parameters (Sled and Pike, 2000; Henkelman et al., 2001), such as the longitudinal relaxation rate T1, the exchange rate k, and the bound pool fraction (BPF), defined as the fraction of exchanging protons that are bound to macromolecules. These contrasts can combine to make myelin loss invisible on an MTR map. For example, some MS lesions are associated with an increase of the longitudinal relaxation, which counteracts the decrease in the BPF (Levesque et al., 2005). Several quantitative magnetization transfer (qMT) methods have been proposed to separate the contribution of these different contrasts (Sled and Pike, 2001; Ramani et al., 2002; Yarnykh, 2002; Ropele et al., 2003; Cercignani et al., 2005; Gochberg and Gore, 2007; Gloor et al., 2008). While there has not been a comprehensive study comparing all of these methods, the pulsed off-resonance techniques (Sled and Pike, 2001; Ramani et al., 2002; Yarnykh, 2002; Cercignani et al., 2005) appear to provide consistent measurements of the macromolecular pool size (Tofts, 2003; Cercignani and Barker, 2008) that are comparable to ex-vivo results (Stanisz et al., 2005).
Recently DTI has been correlated with qMT measurements in ex-vivo mouse brains (Ou et al., 2009a,b) and in humans (Underhill et al., 2009). Ou et al. found that in the unmyelinated brains of shiverer mice the radial diffusivity was higher and the bound pool fraction was lower compared to the corresponding measures in myelinated brains of control littermates (Ou et al., 2009a). Underhill et al., on the other hand, found a weak correlation between qMT parameters and diffusion measurements in white matter, but found a strong correlation of qMT parameters with FA and RD in grey matter. They attributed these results to the variable density of myelinated axons in grey matter.
Here we show that diffusion measures and qMT measures are complementary and we demonstrate the benefits of combining these two measurement techniques to gain insight into tissue microstructure. As diffusion tractography has no information about the myelin content of the fiber tracts, adding qMT to the mix allows us to identify the level of myelination of fiber tracts. By computing qMT and diffusion parameters along major white matter fascicles, we show that qMT and diffusion anisotropy covary across these structures. In addition we identify the tractography fibers with the highest qMT values and show that these heavily myelinated tracts are clustered into distinct fiber groups with small variations across subjects. Several of these high qMT tracts are not particularly high in diffusion anisotropy, further demonstrating the complementary nature of the two measures. Finally, we also replicate the previous finding of a weak coupling between diffusion measures and qMT measures by (Underhill et al., 2009) when we compare across all white matter voxels. However, our detailed analyses of the corpus callosum show that in this region of high fiber direction coherence, the correlation between the diffusion and qMT parameters is higher than in other white matter regions.
To understand the relationship between these two measures of white matter microstructure, we create a quantitative tissue model that predicts the relationship between several tissue properties and the qMT and diffusion measures. This model shows that the fiber density in the white matter affects both qMT and diffusion measures, but only qMT is sensitive to myelin density. Based on this model, we hypothesize that the observed covariance between qMT and diffusion is primarily due to the effect of the fiber density. When qMT and diffusion anisotropy diverge, this can be due to low fiber direction coherence (which affects only diffusion) and myelin density (which affects only qMT). We propose that these measures can be combined in regions of high fiber direction coherence to estimate the myelin g-ratio, which is defined as the ratio between the axon caliber and the total caliber of the axon plus its myelin sheath (i.e., the fiber caliber) (Rushton, 1951). Finally, we speculate that this g-ratio may form a novel MR contrast mechanism that varies between different white matter fascicles and across individuals.
2. Methods
Measurements were performed on five healthy human volunteers using a 1.5T GE Signa MRI scanner and an 8-channel head coil. We collected high-resolution T1-weighted anatomical images for each subject using an 8-minute sagittal 3D-SPGR sequence (1×1×1 mm3 voxel size). The following anatomical landmarks were manually defined in the T1 images: the anterior commissure (AC), the posterior commissure (PC), and the mid-sagittal plane. With these landmarks, we used a rigid-body transform to convert the T1-weighted images to the conventional AC-PC aligned space. This T1-weighted image was used as a common reference for alignment of the T1, BPF and DTI maps.
We used cross-relaxation imaging (Yarnykh and Yuan, 2004) to estimate the T1 relaxation time and the bound pool fraction. Unlike the T1 relaxation time, which is an average of the longitudinal relaxation times of the protons in different tissues comprising white matter (Fullerton et al., 1984), the bound pool fraction is only sensitive to the protons bound to macromolecules. The way this specificity is achieved is with off-resonance magnetization transfer pulses, that excite the protons bound to macromolecules, such as those found in myelin, leaving the water protons unperturbed. This makes bound pool fractions more specific to myelin content, even though mapping the BPF parameter takes about five times longer than a T1 mapping sequence.
The T1 map was obtained using four variable flip-angle SPGR scans (TR = 20 ms, TE = 2.4 ms, α = 4°, 10°, 20°, 30°) and a linear fitting procedure (Fram et al., 1987). Before computing the T1 maps, the raw images were automatically aligned to the T1-weighted reference image using a rigid body mutual information algorithm and resampled to 2 mm isotropic voxels using a 7th-order b-spline algorithm based on code from SPM5 (Friston and Ashburner, 2004). The T1 histograms were shifted to ensure all volunteers had the same white matter peaks. This was done to avoid drifts in the T1 values across subjects due to the small flip angle errors that are common on MR scanners.
The T1 mapping procedure was followed by magnetization transfer SPGR scans with variable offset frequency (TR = 32 ms, TE = 2.4 ms, α = 10°, Δ = 3, 6, 9, 12 kHz). These scans effectively sample the z-spectrum of brain tissue, which is modeled by a SuperLorentzian function (Morrison et al., 1995). According to the qMT model, the evolution of the free and the bound pool magnetization is represented by a linear system,
where A represents the magnetization transfer between the two pools, B is the direct effect of the MT pulse, and C is the longitudinal recovery in the absence of external pulses (Yarnykh and Yuan, 2004). The prediction model makes a priori assumptions about all unknown parameters except for the cross-relaxation rate k and the bound pool fraction. A non-linear least-squares Levenberg-Marquardt algorithm (implemented in MATLAB using the lsqnonlin routine) was used to find the k and BPF values that minimize the prediction error. As with the T1 maps above, the raw MT-weighted images were automatically aligned to the T1-weighted reference image using a rigid body mutual information algorithm and resampled to 2 mm isotropic voxels using a 7th-order b-spline algorithm before fitting the qMT model.
Whole-brain DTI measurements were performed using a diffusion-weighted spin-echo EPI sequence with isotropic 2 mm3 resolution. We measured 80 diffusion directions (40 non-colinear) with a b-value of and seven repeats of the same sequence with no diffusion weighting. Eddy current distortions and subject motion in the diffusion-weighted images were removed by a 14-parameter constrained non-linear co-registration, based on the expected pattern of distortions given the phase-encode direction (Rohde et al., 2004). This procedure registers each diffusion-weighted image to the mean of the non-diffusion-weighted (b = 0) images using a two-stage coarse-to-fine approach that maximizes the normalized mutual information.
The mean of the non-diffusion-weighted images was automatically aligned to the T1-weighted reference image using a rigid body mutual information algorithm. All raw images from the diffusion sequence were resampled to 2-mm isotropic voxels by combining the motion correction, eddy-current correction, and anatomical alignment transforms into one omnibus transform and resampling the data using a trilinear algorithm based on code from SPM5 (Friston and Ashburner, 2004). An eddy-current intensity correction (Rohde et al., 2004) was applied to the diffusion-weighted images at the resampling stage. The rotation component of the omnibus coordinate transform was applied to the diffusion-weighting gradient directions to preserve their orientation with respect to the resampled diffusion image. The tensors were then fit using a least-squares algorithm.
Our DTI acquisitions used an EPI readout, so we had to ensure that our diffusion maps were properly co-registered with the BPF maps. Therefore, we scanned at 1.5T where the EPI distortions are less severe than those at higher field strengths. We also used an 8 channel head coil with partial k-space acquisition, which further reduced the EPI distortions (Bammer et al., 2002). The total time for performing all measurements was about one hour and was split into two sessions.
For analyses that measured just the white matter, we used a white matter mask that was automatically generated by selecting voxels with T1 values between 0.6 and 1.4 seconds, and FA greater than 0.2. We looked at the relationship between BPF and FA in the whole brain, in the white matter, and in the mid-sagittal region of the corpus callosum. The corpus callosum was segmented in five regions, in accordance with the segmentation performed by Aboitiz et al (Aboitiz et al., 1992).
DTI fiber tractography, visualization, and analysis was performed using mrDiffusion (Dougherty et al., 2005) and CINCH (Sherbondy et al., 2005; Akers, 2006). Whole-brain tractography was initiated by seeding all white matter on a 1-mm grid. Fibers were tracked from these seed points using a deterministic streamlines tracking algorithm (Basser et al., 2000; Conturo et al., 1999; Mori et al., 1999) with a fourth-order RungeKutta path integration method and 1-mm fixed-step size. A continuous tensor field was estimated using trilinear interpolation of the tensor elements. Starting from the initial seed point, fibers were traced in both directions along the principal diffusion axis. Path tracing proceeded until the FA fell below 0.15 or until the angle between the current and previous path segments exceeded 30. We discarded all fibers shorter than 50 mm and longer than 250 mm.
The large set of fibers from whole brain tractography was used to find fibers with very high FA and those with very high BPF (Figure 4). However, to summarize the diffusion and qMT properties in several major white matter fascicles (Figure 3), we restricted our analysis to several major white matter tracts. For this, the fiber tracts from the whole brain tractography were automatically classified into twenty fiber structures as defined in JHU white-matter tractography atlas (Wakana et al., 2007) using a modified form of the reference ROI approach (Wakana et al., 2007; Zhang et al., 2008; Hua et al., 2008; Zhang et al., 2010). Specifically, we manually defined reference ROIs (rROIs) describing two waypoints for each of the 20 major white matter tracts described in (Wakana et al., 2007). These ROIs were drawn in MNI space on the ICBM-DTI-81 atlas by two experts. The rROIs were warped from MNI space into each individuals diffusion space and fibers were retained if they passed through any pair of rROIs. Note that some fibers passed through the rROIs for more than one major tract. Thus, we applied an additional inclusion criterion by warping each fiber to MNI space and measuring the approximate overlap between the fiber points and each of major tracts of the probabilistic JHU tractography atlas (Wakana et al., 2007). The fiber was classified as representing the JHU tract with which it had the highest degree of overlap.
Figure 4.
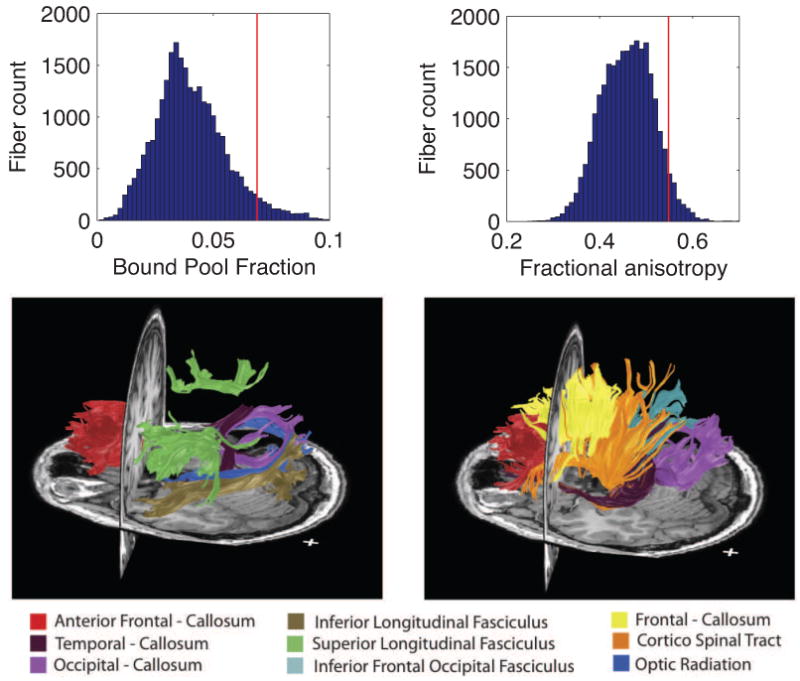
Fibers with highest FA and BPF measures. (left) The distribution of fibers with a BPF score in the 95th percentile. The fibers with high BPF include many samples from three major tracts that do not pass through the corpus callosum: the superior longitudinal fasciculus, the inferior longitudinal fasciculus and the optic radiation. (right) The distribution of fibers with FA score in the 95th percentile.
Figure 3.

FA and BPF measurements averaged across major white matter fascicles. The two major fascicles that form the splenium and genu of the corpus callosum (forceps major and minor, respectively) are shown with squares. For the nine symmetric tracts, each is shown in a different color and left and right hemispheres are indicated with a left- or right-pointing triangle. There were no obvious assymetries, so we fit covariance ellipses to the combined data across hemisphere. The one-standard-deviation ellipse is shown for each major fascicle.
For all analyses involving tractography fibers, the underlying measurement values were summarized across the entire tract by taking the mean of the values at each point in every fiber that comprised the tract. This is effectively a weighted average, where those voxels at the core of a tract have many fibers passing through them and thus contribute more heavily to the tract average than those voxels at the fringe of a tract.
The custom image processing and visualization software used in our analyses is available as part of our open-source mrDiffusion package, available for download from http://vistalab.stanford.edu/. (SVN revision 1919).
3. Results
3.1. Voxelwise analysis: FA and BPF do not covary closely
Figure 1 shows two axial slices with an FA and BPF map from one healthy volunteer. There are numerous locations where FA can be high and BPF low, or conversely.
Figure 1.
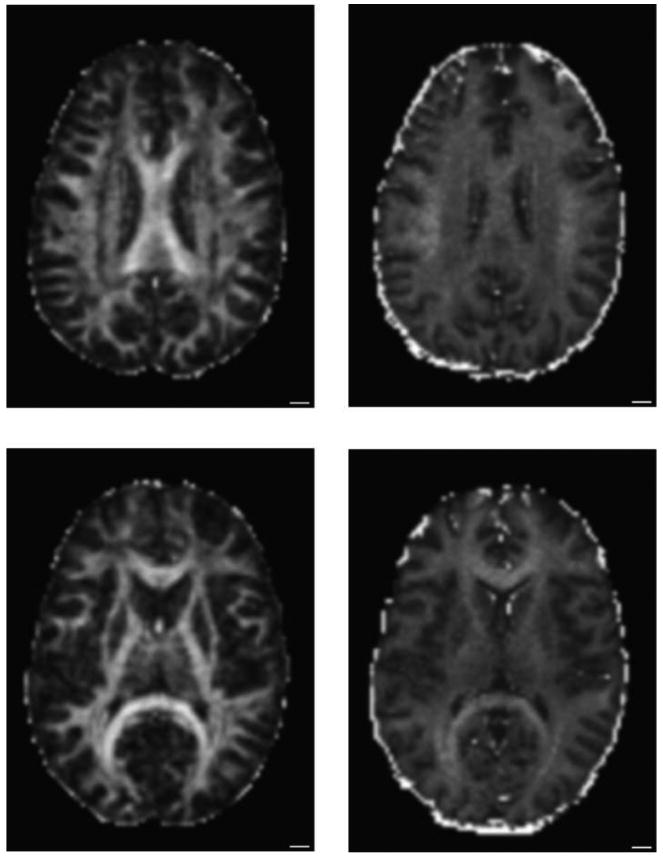
Dissociation of BPF and FA. (Left) FA maps from two axial slices of a healthy volunteer (Right) BPF maps from the same two slices. For example, the superior longitudinal fasciculus shown in the top slice has high bound pool fraction, but moderate FA. Conversely, in the bottom slice, the internal capsule has high FA, but its BPF is no different from its surroundings.
To understand the relationship between FA and BPF across the whole brain, we used a median-split to separate voxels with high and low BPF. Figure 2a shows, across all five subjects, the distribution of FA measures for voxels with BPF below the median and separately for voxels with BPF above the median. Voxels with low BPF (mainly CSF and grey matter) have lower FA. Voxels with high BPF (mainly white matter) have a wide range of FA values. While Figure 1 shows examples of both types of dissociation, Figure 2a indicates that across the whole brain, regions with high BPF and low FA are more common than regions with high FA and low BPF.
Figure 2.
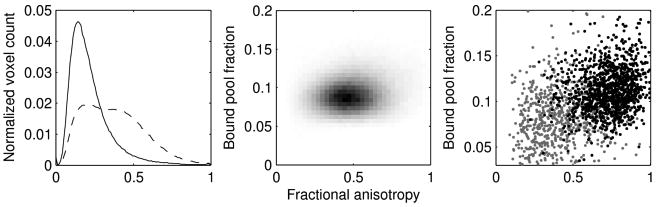
Comparison of BPF and FA across all subjects. a) Distribution of FA in voxels with low (solid) and high (dashed) BPF Values. Voxels with low BPF (mainly CSF and grey matter) have lower FA. Voxels with high BPF (mainly white matter) have a wide range of FA values. b) 2D histogram of all the white matter voxels. c) Scatterplots for FA and BPF values from voxels in the mid-sagittal plane of the corpus callosum. The gray points are voxels that are at the edge of the callosal ROI and the black points are from the core of the callosal ROI.
We then computed the relationship between FA and BPF restricted to the white matter (Figure 2b). The correlation plots show that when restricted to the white matter, BPF and FA are not closely coupled. The correlations between BPF and FA across all white matter voxels for the five volunteers were 0.12, 0.16, 0.15, 0.14, and 0.19. All these correlations were statistically significant (p < 0.0001) due to the large number of voxels, but the variance in FA accounted for by BPF was at best 4%.
3.2. FA and BPF covary in a region of high directional coherence
To see if the coupling between FA and BPF was tighter in regions with high within-voxel fiber direction coherence, we next restricted our analysis to voxels in the mid-sagittal plane of the corpus callosum. These scatterplots are shown in Figure 2c. Within the corpus callosum, the correlations were consistently better than those across all white matter (0.35, 0.26, 0.25, 0.28, and 0.35, all p < 0.001). These correlations remained even when we removed the voxels at the edge of the corpus callosum (shown as gray points in Figure 2c) that were potentially partial-volumed with the surrounding CSF. When the edge voxels were removed by eroding the callosal ROIs, the correlations were 0.21, 0.45, 0.19, 0.42, and 0.38 (black points in Figure 2c; all p < 0.01 except the third with p = 0.07), accounting for up to 20% of the variance.
To determine if the lack of correlation between BPF and FA is due to noise, we estimated the measurement reliability of BPF and FA by repeating our measurements in separate scan sessions on one subject. The FA measures showed good reliability, with a voxelwise correlation of 0.68 across voxels within the mid-sagittal plane of the corpus callosum. Across all voxels in the white matter, the correlation was comparable at 0.61. However, the BPF measurement was not as reliable, with a voxelwise correlation of 0.29 in the corpus callosum (0.38 within all the white matter). Given these reliability estimates, the maximum correlation we can expect betwen BPF and FA is . The correlations that we observe are somewhat lower than this. Expressed in terms of variance explained, if both BPF and FA measured the same underlying tissue properties, we would expect the percent variance explained to be 18%. Our callosal analysis found that the percent variance explained varied across subjects, but did exceed 14% in three out of five subjects. Therefore, we can conclude that in regions of high fiber direction coherence, BPF and diffusion anisotropy substantially overlap in their sensitivity to underlying tissue properties, but we also note that this overlap is not perfect.
3.3. FA and BPF measures across major fiber tracts are correlated
While the BPF measures have substantial noise, the large-scale patterns evident in Figure 1 are clearly repeatable both within and across subjects, as well as across labs (e.g., see (Yarnykh and Yuan, 2004), Figure 3). To quantify these large-scale patterns, we used fiber tractography to identify the large fascicles within each subject and performed an ROI analysis to average the measures over larger spatial regions and thus obtain more robust estimates of BPF and FA.
The results of this tract-based analysis are shown in Figure 3. The relationship between FA and BPF is much more evident when the data are analyzed at this macroscopic scale. The two callosal tracts (forceps major and minor) both have high FA and high BPF, while the uncinate fasciculus and the hippocampal projection of the cingulum both have low FA and low BPF. The correlation coefficient (r) between FA and BPF across all these major tracts was 0.65, with p = 0.002. The relationship between BPF and FA appears to be roughly linear, except for the cortico-spinal tract and the forceps major, which appear to fall below the linear trend evident in the other tracts.
3.4. BPF identifies fiber tracts with high macromolecular content
The top of Fig. 4 shows histograms of fibers generated by whole-brain diffusion tractography and scored by the BPF (left) and FA values (right) of the voxels those fibers pass through. In the bottom of Fig. 4 we show the fibers with BPF scores above the 95th percentile and those with FA scores above the 95th percentile. The fibers tended to form clusters and we manually labelled these clusters based on known white matter anatomy. There is some overlap between the top BPF and the top FA fibers, but there are also substantial differences. Most of the fibers with high average FA pass through the corpus callosum. In contrast, the high BPF group includes fibers from three major tracts that do not pass through the corpus callosum: the superior longitudinal fasciculus, the inferior longitudinal fasciculus and the optic radiation. This over-all pattern was quite consistent across subjects, but there was some individual variability (see Supplemental Materials for data from all five subjects).
4. Quantitative Tissue Model
We created a quantitative tissue model to help interpret the relationship between BPF and diffusion measures. The model enables us to estimate the effects of tissue properties such as axon geometry and density on the diffusion signal. The tissue model consists of a set of cylinders, representing white matter fibers, packed into a small (200 μm3) voxel. The cylinders model the outer hull of an axon surrounded by a myelin sheath.
The diffusion simulations were performed using a numerical simulation method (Szafer et al., 1995; Ford and Hackney, 1997; Peled, 2007). We ran the simulations on tissue structures that more closely resemble white matter tissue than these earlier studies. Our diffusion simulation methods and tissue models are identical to those of Alexander et al. ((Alexander et al., 2010)) and very similar to those of Hall et al. ((Hall and Alexander, 2009)) and Balls and Frank (Balls and Frank, 2009). Our tissue model was created by positioning the N fibers within the simulated voxel. To achieve a random packing, each fiber was placed by randomly sampling positions within the voxel until a position was found in which the outer perimeter of the fiber was no closer than 0.05 μm from the previously placed fibers. The fibers were positioned in order of size, from largest to smallest, to expedite the algorithm. The diffusion simulation used 100,000 particles moving in Brownian motion with a timestep of 0.01 ms. Particles within a fiber moved with an apparent diffusivity of 1.6 μm/ms and those outside the fibers moved with an apparent diffusivity of 2.1 μm/ms. The exact values of these parameters did not substantively affect the results, as long as they were kept within a biologically plausible range. For these diffusion simulations, we did not model a separate myelin compartment. Regions near the edge of the voxel were discarded to avoid contaminating the results with edge effects. The simulated diffusion-weighting pulse sequence approximated our DTI sequence (δ = 18 ms, Δ = 20 ms, gradient amplitude = 40 mT/m). We ran the simulations on an nVidia Tesla C10 parallel processor card using the nVidia CUDA software development library.
In simulations of the callosum, which has high fiber direction coherence, the cylinders were oriented in the same direction. The cylinder diameters were sampled from published fiber caliber distributions of post-mortem human corpus callosum ((Aboitiz et al., 1992), Figure 4; dimensions scaled by 1.5 to account for shrinkage due to fixation). Aboitiz et al. report five different fiber caliber distributions for five different regions of the corpus callosum. Simulations were carried out by sampling N fibers according to the fiber caliber distribution of each region. The parameter N sets the fiber density, and the simulations were performed for a range of different fiber densities.
Once N fibers were selected, we computed the proportion of the voxel that is filled with fibers (the fiber volume fraction or FVF):
| (1) |
where rn is the n-th fiber radius and d is the simulated voxel size. We use the FVF rather than the fiber density to quantify the fiber packing density because it is independent of the axon caliber distribution. As our simulation shows, using the FVF also makes the predicted FA values quite comparable for the different fiber caliber distributions.
We performed simulations for each of the five callosal segments across a range of FVFs. The FVF has a significant impact on the diffusivity, but the fiber caliber distribution has only a small effect on FA. Figure 5 shows that higher fiber counts (i.e., N in equation 1) are associated with higher FA. When plotted in this way, the data also show a large effect of fiber caliber on the simulated FA. However, this effect is almost entirely due to the extra space occupied by large fibers; when we account for this space by including the fiber calibers to compute the FVF according to equation 1, the effect of the fiber caliber distribution nearly disappears. For the five fiber caliber distributions that we simulated, the largest FA difference between any pair of size distributions was 5%. Since the effect of the caliber distribution was small relative to the measurement noise in our data (quantified above in the FA repeatability analysis), we collapsed across the different fiber caliber distributions and fit a simple model. The quadratic curve summarizes the relationship between FVF and FA for all fiber caliber distributions combined, and gives us a way to infer the FVF from the FA measurement:
Figure 5.
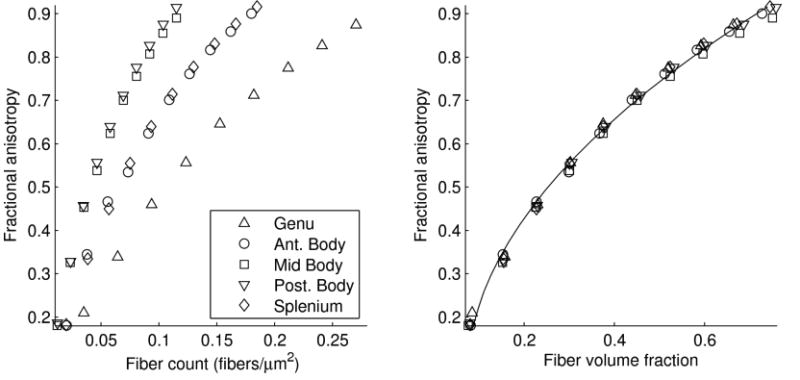
Fractional anisotropy as a function of fiber count and fiber volume fraction (FVF) for five different fiber caliber distributions drawn from published post-mortem measurements of the human corpus callosum (Aboitiz et al., 1992). (Left) Higher fiber counts are associated with higher FA for all five size distributions. For any particular fiber count, regions with more large fibers (mid body and posterior body) had higher FA, while the genu, with many small fibers, had lower FA. (Right) When we account for the volume differences between the different calibers and plot FA as a function of FVF, the effect of the fiber caliber is greatly diminished. The smooth quadratic curve summarizes the relationship between FVF and FA for all fiber caliber distributions combined.
| (2) |
The myelin volume fraction (MVF) is the fraction of the total volume that is occupied by the myelin sheaths and thus is a subset of the FVF. MVF can be computed with a simple expression by assuming that the inner axon diameter is a fixed proportion of the total outer fiber diameter (Rushton, 1951). For cylindrical fibers, the MVF for a given voxel is:
| (3) |
where rn is the n-th fiber radius, g is the ratio of the inner axon diameter to the outer fiber diameter, and d is the simulated voxel size.
To estimate the MVF value from BPF measurements, we must turn to empirical measurement. Dula et al. (Dula et al., 2010) loooked at the relationship between in-vivo BPF measures and ex-vivo MVF measures in mice, and concluded that the BPF measure is sensitive to myelin content, but not to other microstructural features, such as size. BPF was measured with a quantitative MT method similar to ours and MVF was measured histologically with quantitative myelin staining. They found a simple relationship between the two measures, with MVF equal to 2.5 times BPF. We use this scaling constant to convert the measured BPF values to MVF.
Now that we have methods to estimate both MVF and FVF, we can compute the axon-to-fiber ratio (g) by combining equations 1 and 3:
| (4) |
Thus we have a parameter-free model to predict the g-ratio from BPF and diffusion anisotropy measurements when axons are arranged in parallel. We now apply this model to estimate the g-ratio using our FA and BPF measurements in the corpus callosum, a white matter structure with high fiber direction coherence. We compared the FA and BPF values across five different segments of the corpus callosum for our five volunteers (Table 1 and Figure 6). These measurements confirm that there are similar trends in the corpus callosum for BPF and FA. Namely, the genu and the splenium have higher BPF and FA compared to the body of the CC.
Table 1.
Mean axial diffusivity, radial diffusivity, FA, and BPF values in the corpus callosum for five subjects.
| qMR quantity | Genu | Anterior Body | Mid Body | Posterior Body | Splenium |
|---|---|---|---|---|---|
| AD (10−3mm2/s) | 1.73 (0.214) | 1.51 (0.152) | 1.54 (0.147) | 1.65 (0.226) | 1.98 (0.121) |
| RD (10−3mm2/s) | 0.42 (0.062) | 0.47 (0.042) | 0.46 (0.043) | 0.46 (0.113) | 0.29 (0.037) |
| FA | 0.71 (0.067) | 0.63 (0.023) | 0.65 (0.045) | 0.67 (0.098) | 0.84 (0.017) |
| BPF | 0.13 (0.007) | 0.11 (0.009) | 0.10 (0.011) | 0.10 (0.010) | 0.12 (0.006) |
Figure 6.
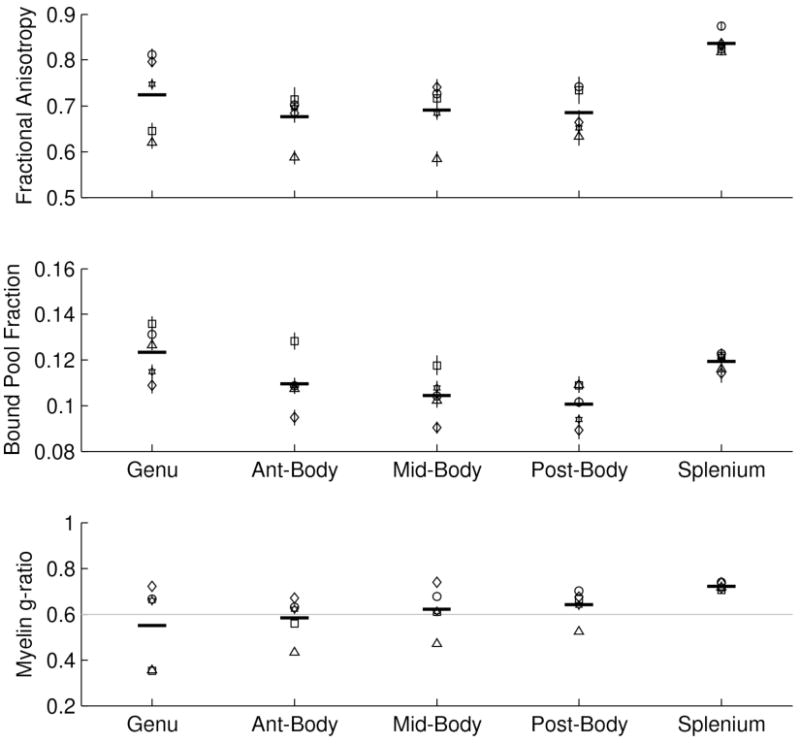
FA, BPF and g-ratio in five callosal segments. The mean FA (top), BPF (middle) and g-ratio (bottom) is shown for each of five callosal segments. Each subject's mean value is indicated by a different symbol and these symbols are consistent across the two plots. The error bar at each point indicates the standard error of the mean across all the voxels in a subject's callosal segment. The thick horizontal bar indicates the group mean.
Figure 6 shows the mean FA, BPF, and the estimated myelin g-ratios for each of five measured callosal segments. Each subjects mean value is indicated by a different symbol and these symbols are consistent across the three plots. The error bars in the FA, BPF, and g plots indicate the standard error of the mean across all the voxels in a subjects callosal segment. The thick horizontal bar indicates the group mean. Figure 7 shows simulated tissue cross-sections of five callosal regions derived from our estimated FVF and MVF values and published fiber caliber distributions.
Figure 7.
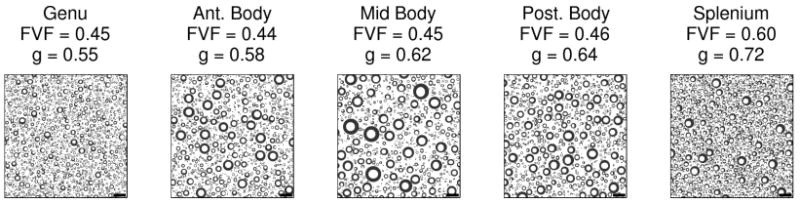
Simulated tissue cross-sections of five callosal regions derived from the estimated FVF and MVF values and published fiber caliber distributions (Aboitiz et al., 1992). The scale bar indicates 10 μm
5. Discussion
The weak correlation that we observe between FA and BPF in our voxelwise analysis of the white matter of healthy volunteers is consistent with the findings of Underhill et al. (Underhill et al., 2009). However, we show that in areas with high directional coherence, such as the corpus callosum, the correlation between BPF and FA increases. These results suggest that BPF (and thus myelin density) and FA are more closely coupled in areas with high directional coherence.
In addition to BPF, alternative methods based on a multi-compartment T2 model have been proposed to measure the myelin content of tissue (MacKay et al., 1994; Deoni et al., 2008). These methods compute the fraction of water trapped between the myelin layers (myelin water fraction or MWF). Mädler et al. found the MWF to be correlated with FA, which seems to contradict the low correlation between BPF and FA reported by Underhill et al. However, our work shows that by using different analysis techniques, we could replicate the findings of both groups (See Fig. 2 and Fig. 3). This does not mean, however, that BPF and MWF necessarily measure the same tissue properties. Recent work by Dula et al. and Levesque et al. suggests that, in addition to being sensitive to myelin content, MWF is also sensitive to tissue geometry and water exchange, while the BPF is a measure that is more specific to overall myelin content (Levesque and Pike, 2009; Dula et al., 2010).
Our tissue model and diffusion simulations show that both BPF and diffusion anisotropy are sensitive to the FVF in myelinated tissue. Thus, we speculate that the observed covariance between FA and BPF is primarily due to variations in the FVF. Tissue properties that are expected to have differential effects on diffusion and BPF are fiber direction coherence, which affects diffusion anisotropy but not BPF, and myelin density, which affects BPF much more than it affects diffusion. We propose that these tissue properties vary across the white matter and perhaps across individuals, and thus cause FA and BPF to be somewhat dissociated. Finally, our model also shows that, across an anatomically plausible range of fiber caliber distributions, the fiber caliber distribution does not affect FA. Likewise, BPF is not expected to be affected by the fiber caliber distribution as long as the g-ratio remains constant.
These observations may explain why thick fibers, such as those found in the corticospinal tract or the body of the corpus callosum, do not appear in our catalog of highly myelinated fibers. While we expect these white matter regions to have a high proportion of large and heavily myelinated fibers, the FVF in such regions may be lower than that of regions with smaller caliber fibers. As suggested by (Aboitiz et al., 1992), larger caliber axons might require more glial support and thus tend to have a high proportion of glial volume-to-axon volume. Also, some of these regions may also happen to have a higher proportion of crossing fibers that reduces diffusion anisotropy.
The absence of the corticospinal tract from the top fibers might also be due to the gross anatomical orientation of the tract. We have observed a slight gradient in the T1 values across the head that results in lower BPF values in more inferior regions where the corticospinal tract descends into the brain stem. Thus, we can not rule out the possibility that the lower BPF in the corticospinal tract might be due to an artifact of the RF field inhomogeneity that causes the flip angles to be lower than expected in inferior regions of the brain. To distinguish between these two options will require accurate measures of the B1 field. While we remain confident in our BPF measurements throughout most of the brain, which is near the magnet isocenter, we must be cautious about the BPF measures in the most inferior regions of the brain.
We observed that some white matter regions have consistently high BPF but only modest FA, such as the optic radiation and superior longitudinal fasciculus (SLF). We hypothesize that these regions show this pattern due to a high FVF and a large proportion of crossing fibers. For example, many medial-to-lateral connections, such as those from the corpus callosum, interdigitate with the anterior-posterior fibers that comprise the SLF (e.g., see (Tournier et al., 2004), Figure 8). The optic radiation is a sheet-like structure (Sherbondy et al., 2008) that is also likely perforated by fibers passing in the medial-lateral direction. As our simulation shows, a crossing pattern predicts a lower FA while myelin density remains constant. However, it does not explain why the BPF in the SLF is higher than nearby regions of white matter. To explain that, we hypothesize that the crossing geometry in the SLF and optic radiation involves a significant amount of interdigitation. If two fiber tracts interdigitate, then some type of compression must occur to maintain the total fiber volume. Therefore, in such regions, either the axons get compressed to a reduced caliber (e.g., see (Perge et al., 2009), Figure 1d) and/or the glia are squeezed out. Based on our BPF measures, we estimate that the MVF in the SLF is about 32%, while the MVF in regions surrounding the SLF is about 23%. This suggests that some glial volume reduction occurs in the SLF, which causes the FVF (and thus the MVF) to increase compared to surrounding regions. Unfortunately, due to the known crossing architecture in this region, we cannot use diffusion anisotropy to directly measure the FVF and test this hypothesis.
Our tissue simulation and diffusion measurements suggest that axons and their myelin sheaths comprise 44% to 61% of the volume fraction in the corpus callosum. While the post-mortem report of Aboitiz did not directly report fiber volume percentage, we can infer from their reported fiber counts and size distributions an average FVF of 71%. This value is somewhat higher than what we find. We expect that this discrepancy is due to the loss of extracellular water in the tissue preparation methods used to process post-mortem samples. Barazany et. al. (Barazany et al., 2009) also found a discrepancy between MR measures of FVF and histological measures of FVF that they attribute to tissue shrinkage. In fact, our estimate for the corpus callosum is remarkably close to the estimated FVF of 57% in optic nerve, as reported by (Perge et al., 2009), who used fixation methods that specifically avoid volumetric distortions.
The ablity to measure the g-ratio in vivo is important for understanding the development of the human brain, and the model presented here provides a potential tool for making such measurements. The neural conduction speed for any given fiber caliber has a broad maximum around a g-ratio of 0.6 (Rushton, 1951; Waxman, 1975), which is in agreement with our corpus callosum measurements. While the theoretically optimal g value is around 0.6, measurements show that the relationship between axon caliber and myelin sheath thickness may not be strictly linear. In general, larger axons have thicker myelin sheaths, but measurements in the lumbar nerve of cats show that this relationship is logarithmic, ranging from 0.4 in the smallest fibers to 0.8 in the largest ones(Berthold et al., 1983). Measurements of human peripheral nerves show that the g-ratio is lower in older than in younger children, with axon caliber reaching its maximum by five years of age, while the g-ratio starts at 0.8 in infants, and can drop as low as 0.4 around 16 years of age (Friede and Beuche, 1985; Schröder et al., 1988). Finally, variations in the g-ratio have recently been proposed to be associated with sex differences in brain development (Paus, 2009). The range of values reported in literature is similar to the g-ratio variations we observed in our study.
A histology study is needed to validate our findings in the corpus callosum, as well as to confirm the observed pattern of highly myelinated fibers outside the callosum. The constant that relates the myelin density to the BPF has been taken from the work of Dula et al. and remains to be validated in a larger study, but this work suggests that there is a one-to-one correspondence between the BPF and the myelin content. Our tissue model relies on this assumption, and it does not take into account the effect of extra-axonal environment on the diffusion measurements.
Another limitation of our study is the noise in the BPF measurement, as well as the choice of a two-pool qMT model with many fixed parameters. A model that allows for more compartments combined with more samples of the z-spectrum would result in a more reliable fit, which could change our correlations. However, Levesque et al. recently performed a four pool simulation of the qMT fitting procedure, and found that in the brain the two pool model is sufficient (Levesque and Pike, 2009).
6. Conclusion
Measuring the growth and distribution of the white matter is critical for understanding brain structure and function. Here we show that qMT and diffusion measures are complementary measures of white matter microstructure. We also introduce a quantitative tissue model that suggests a novel method for measuring the average myelin sheath thickness (g-ratio) by combining diffusion and qMT measures. This work, combined with recently developed methods for estimating axon caliber distributions (Assaf et al., 2008; Barazany et al., 2009; Alexander, 2008), will offer a more complete understanding of the human brain and may prove useful in assessment of white matter diseases.
Supplementary Material
Acknowledgments
This work was supported by the NIH (EB002524, EB005790, EB006471, EY15000), GE Healthcare, and the Bio-X Student Fellowship. We thank Roland Bammer for the diffusion imaging pulse sequence and Ewart Thomas for helpful comments on the analysis methods. We would like to thank Christian Beaulieu and two anonymous reviewers for helpful comments on an early draft of this manuscript.
Footnotes
Publisher's Disclaimer: This is a PDF file of an unedited manuscript that has been accepted for publication. As a service to our customers we are providing this early version of the manuscript. The manuscript will undergo copyediting, typesetting, and review of the resulting proof before it is published in its final citable form. Please note that during the production process errors may be discovered which could affect the content, and all legal disclaimers that apply to the journal pertain.
References
- Aboitiz F, Scheibel AB, Fisher RS, Zaidel E. Fiber composition of the human corpus callosum. Brain Res. 1992 Dec;598(1-2):143–53. doi: 10.1016/0006-8993(92)90178-c. [DOI] [PubMed] [Google Scholar]
- Akers D. Proceedings of UIST. ACM Press; 2006. Cinch: A cooperatively designed marking interface for 3d pathway selection; pp. 33–42. [Google Scholar]
- Alexander DC. A general framework for experiment design in diffusion mri and its application in measuring direct tissue-microstructure features. Magn Reson Med. 2008 Aug;60(2):439–48. doi: 10.1002/mrm.21646. [DOI] [PubMed] [Google Scholar]
- Alexander DC, Hubbard PL, Hall MG, Moore EA, Ptito M, Parker GJM, Dyrby TB. Orientationally invariant indices of axon diameter and density from diffusion mri. Neuroimage. 2010 Oct;52(4):1374–1389. doi: 10.1016/j.neuroimage.2010.05.043. [DOI] [PubMed] [Google Scholar]
- Assaf Y, Blumenfeld-Katzir T, Yovel Y, Basser PJ. Axcaliber: a method for measuring axon diameter distribution from diffusion mri. Magn Reson Med. 2008 Jun;59(6):1347–54. doi: 10.1002/mrm.21577. [DOI] [PMC free article] [PubMed] [Google Scholar]
- Balls GT, Frank LR. A simulation environment for diffusion weighted mr experiments in complex media. Magn Reson Med. 2009 Sep;62(3):771–8. doi: 10.1002/mrm.22033. [DOI] [PMC free article] [PubMed] [Google Scholar]
- Bammer R, Auer M, Keeling SL, Augustin M, Stables LA, Prokesch RW, Stollberger R, Moseley ME, Fazekas F. Diffusion tensor imaging using single-shot sense-epi. Magn Reson Med. 2002 Jul;48(1):128–36. doi: 10.1002/mrm.10184. [DOI] [PubMed] [Google Scholar]
- Barazany D, Basser PJ, Assaf Y. In vivo measurement of axon diameter distribution in the corpus callosum of rat brain. Brain. 2009 May;132(Pt 5):1210–20. doi: 10.1093/brain/awp042. [DOI] [PMC free article] [PubMed] [Google Scholar]
- Basser PJ, Mattiello J, LeBihan D. Mr diffusion tensor spectroscopy and imaging. Biophys J. 1994 Jan;66(1):259–67. doi: 10.1016/S0006-3495(94)80775-1. [DOI] [PMC free article] [PubMed] [Google Scholar]
- Basser PJ, Pajevic S, Pierpaoli C, Duda J, Aldroubi A. In vivo fiber tractography using DT-MRI data. Magn Reson Med. 2000 Oct;44(4):625–32. doi: 10.1002/1522-2594(200010)44:4<625::aid-mrm17>3.0.co;2-o. [DOI] [PubMed] [Google Scholar]
- Baumann N, Pham-Dinh D. Biology of oligodendrocyte and myelin in the mammalian central nervous system. Physiol Rev. 2001 Apr;81(2):871–927. doi: 10.1152/physrev.2001.81.2.871. [DOI] [PubMed] [Google Scholar]
- Beaulieu C. The basis of anisotropic water diffusion in the nervous system - a technical review. NMR Biomed. 2002;15(7-8):435–55. doi: 10.1002/nbm.782. [DOI] [PubMed] [Google Scholar]
- Berthold CH, Nilsson I, Rydmark M. Axon diameter and myelin sheath thickness in nerve fibres of the ventral spinal root of the seventh lumbar nerve of the adult and developing cat. J Anat. 1983 May;136(Pt 3):483–508. [PMC free article] [PubMed] [Google Scholar]
- Cercignani M, Barker GJ. A comparison between equations describing in vivo MT: the effects of noise and sequence parameters. J Magn Reson. 2008 Apr;191(2):171–83. doi: 10.1016/j.jmr.2007.12.012. [DOI] [PMC free article] [PubMed] [Google Scholar]
- Cercignani M, Symms MR, Schmierer K, Boulby PA, Tozer DJ, Ron M, Tofts PS, Barker GJ. Three-dimensional quantitative magnetisation transfer imaging of the human brain. Neuroimage. 2005 Aug;27(2):436–441. doi: 10.1016/j.neuroimage.2005.04.031. [DOI] [PubMed] [Google Scholar]
- Conturo TE, Lori NF, Cull TS, Akbudak E, Snyder AZ, Shimony JS, McKinstry RC, Burton H, Raichle ME. Tracking neuronal fiber pathways in the living human brain. Proc Natl Acad Sci U S A. 1999 Aug;96(18):10422–7. doi: 10.1073/pnas.96.18.10422. [DOI] [PMC free article] [PubMed] [Google Scholar]
- Deoni SCL, Rutt BK, Jones DK. Investigating exchange and multicomponent relaxation in fully-balanced steady-state free precession imaging. J Magn Reson Imaging. 2008 Jun;27(6):1421–1429. doi: 10.1002/jmri.21079. [DOI] [PubMed] [Google Scholar]
- Dougherty RF, Ben-Shachar M, Deutsch G, Potanina P, Bammer R, Wandell BA. Occipital-callosal pathways in children: Validation and atlas development. Ann N Y Acad Sci. 2005 Dec;1064:98–112. doi: 10.1196/annals.1340.017. [DOI] [PubMed] [Google Scholar]
- Dousset V, Grossman RI, Ramer KN, Schnall MD, Young LH, Gonzalez-Scarano F, Lavi E, Cohen JA. Experimental allergic encephalomyelitis and multiple sclerosis: lesion characterization with magnetization transfer imaging. Radiology. 1992 Feb;182(2):483–491. doi: 10.1148/radiology.182.2.1732968. [DOI] [PubMed] [Google Scholar]
- Dula AN, Gochberg DF, Valentine HL, Valentine WM, Does MD. Multiexponential t2, magnetization transfer, and quantitative histology in white matter tracts of rat spinal cord. Magn Reson Med. 2010 Apr;63(4):902–909. doi: 10.1002/mrm.22267. [DOI] [PMC free article] [PubMed] [Google Scholar]
- Edzes HT, Samulski ET. Cross relaxation and spin diffusion in the proton NMR or hydrated collagen. Nature. 1977 Feb;265(5594):521–523. doi: 10.1038/265521a0. [DOI] [PubMed] [Google Scholar]
- Fields RD. White matter in learning, cognition and psychiatric disorders. Trends Neurosci. 2008 Jul;31(7):361–70. doi: 10.1016/j.tins.2008.04.001. [DOI] [PMC free article] [PubMed] [Google Scholar]
- Filippi M, Campi A, Dousset V, Baratti C, Martinelli V, Canal N, Scotti G, Comi G. A magnetization transfer imaging study of normal-appearing white matter in multiple sclerosis. Neurology. 1995 Mar;45(3 Pt 1):478–482. doi: 10.1212/wnl.45.3.478. [DOI] [PubMed] [Google Scholar]
- Ford JC, Hackney DB. Numerical model for calculation of apparent diffusion coefficients (adc) in permeable cylinders–comparison with measured adc in spinal cord white matter. Magn Reson Med. 1997 Mar;37(3):387–94. doi: 10.1002/mrm.1910370315. [DOI] [PubMed] [Google Scholar]
- Fram EK, Herfkens RJ, Johnson GA, Glover GH, Karis JP, Shimakawa A, Perkins TG, Pelc NJ. Rapid calculation of T1 using variable flip angle gradient refocused imaging. Magn Reson Imaging. 1987;5(3):201–208. doi: 10.1016/0730-725x(87)90021-x. [DOI] [PubMed] [Google Scholar]
- Friede RL, Beuche W. Combined scatter diagrams of sheath thickness and fibre calibre in human sural nerves: changes with age and neuropathy. J Neurol Neurosurg Psychiatry. 1985 Aug;48(8):749–756. doi: 10.1136/jnnp.48.8.749. [DOI] [PMC free article] [PubMed] [Google Scholar]
- Friston KJ, Ashburner J. Generative and recognition models for neuroanatomy. Neuroimage. 2004 Sep;23(1):21–4. doi: 10.1016/j.neuroimage.2004.04.021. [DOI] [PubMed] [Google Scholar]
- Fullerton GD, Cameron IL, Ord VA. Frequency dependence of magnetic resonance spin-lattice relaxation of protons in biological materials. Radiology. 1984 Apr;151(1):135–8. doi: 10.1148/radiology.151.1.6322223. [DOI] [PubMed] [Google Scholar]
- Gloor M, Scheffler K, Bieri O. Quantitative magnetization transfer imaging using balanced SSFP. Magn Reson Med. 2008 Sep;60(3):691–700. doi: 10.1002/mrm.21705. [DOI] [PubMed] [Google Scholar]
- Gochberg DF, Gore JC. Quantitative magnetization transfer imaging via selective inversion recovery with short repetition times. Magn Reson Med. 2007 Feb;57(2):437–441. doi: 10.1002/mrm.21143. [DOI] [PMC free article] [PubMed] [Google Scholar]
- Hall MG, Alexander DC. Convergence and parameter choice for monte-carlo simulations of diffusion mri. IEEE Trans Med Imaging. 2009 Sep;28(9):1354–1364. doi: 10.1109/TMI.2009.2015756. [DOI] [PubMed] [Google Scholar]
- Henkelman RM, Huang X, Xiang QS, Stanisz GJ, Swanson SD, Bronskill MJ. Quantitative interpretation of magnetization transfer. Magn Reson Med. 1993 Jun;29(6):759–766. doi: 10.1002/mrm.1910290607. [DOI] [PubMed] [Google Scholar]
- Henkelman RM, Stanisz GJ, Graham SJ. Magnetization transfer in MRI: a review. NMR Biomed. 2001 Apr;14(2):57–64. doi: 10.1002/nbm.683. [DOI] [PubMed] [Google Scholar]
- Horsfield MA. Magnetization transfer imaging in multiple sclerosis. J Neuroimaging. 2005;15(4 Suppl):58S–67S. doi: 10.1177/1051228405282242. [DOI] [PubMed] [Google Scholar]
- Hua K, Zhang J, Wakana S, Jiang H, Li X, Reich DS, Calabresi PA, Pekar JJ, van Zijl PCM, Mori S. Tract probability maps in stereotaxic spaces: analyses of white matter anatomy and tract-specific quantification. Neuroimage. 2008 Jan;39(1):336–347. doi: 10.1016/j.neuroimage.2007.07.053. [DOI] [PMC free article] [PubMed] [Google Scholar]
- Kucharczyk W, Macdonald PM, Stanisz GJ, Henkelman RM. Relaxivity and magnetization transfer of white matter lipids at mr imaging: importance of cerebrosides and ph. Radiology. 1994 Aug;192(2):521–9. doi: 10.1148/radiology.192.2.8029426. [DOI] [PubMed] [Google Scholar]
- Laule C, Vavasour IM, Kolind SH, Li DKB, Traboulsee TL, Moore GRW, MacKay AL. Magnetic resonance imaging of myelin. Neurotherapeutics. 2007 Jul;4(3):460–84. doi: 10.1016/j.nurt.2007.05.004. [DOI] [PMC free article] [PubMed] [Google Scholar]
- Le Bihan D, Breton E, Lallemand D, Aubin ML, Vignaud J, Laval-Jeantet M. Separation of diffusion and perfusion in intravoxel incoherent motion mr imaging. Radiology. 1988 Aug;168(2):497–505. doi: 10.1148/radiology.168.2.3393671. [DOI] [PubMed] [Google Scholar]
- Levesque I, Sled JG, Narayanan S, Santos AC, Brass SD, Francis SJ, Arnold DL, Pike GB. The role of edema and demyelination in chronic T1 black holes: a quantitative magnetization transfer study. J Magn Reson Imaging. 2005 Feb;21(2):103–110. doi: 10.1002/jmri.20231. [DOI] [PubMed] [Google Scholar]
- Levesque IR, Pike GB. Characterizing healthy and diseased white matter using quantitative magnetization transfer and multicomponent t(2) relaxometry: A unified view via a four-pool model. Magn Reson Med. 2009 Dec;62(6):1487–96. doi: 10.1002/mrm.22131. [DOI] [PubMed] [Google Scholar]
- MacKay A, Whittall K, Adler J, Li D, Paty D, Graeb D. In vivo visualization of myelin water in brain by magnetic resonance. Magn Reson Med. 1994 Jun;31(6):673–677. doi: 10.1002/mrm.1910310614. [DOI] [PubMed] [Google Scholar]
- Mori S, Crain BJ, Chacko VP, van Zijl PC. Three-dimensional tracking of axonal projections in the brain by magnetic resonance imaging. Ann Neurol. 1999 Feb;45(2):265–9. doi: 10.1002/1531-8249(199902)45:2<265::aid-ana21>3.0.co;2-3. [DOI] [PubMed] [Google Scholar]
- Morrison C, Henkelman RM. A model for magnetization transfer in tissues. Magn Reson Med. 1995 Apr;33(4):475–482. doi: 10.1002/mrm.1910330404. [DOI] [PubMed] [Google Scholar]
- Morrison C, Stanisz G, Henkelman RM. Modeling magnetization transfer for biological-like systems using a semi-solid pool with a super-Lorentzian lineshape and dipolar reservoir. J Magn Reson B. 1995 Aug;108(2):103–113. doi: 10.1006/jmrb.1995.1111. [DOI] [PubMed] [Google Scholar]
- Mukherjee P, Miller JH, Shimony JS, Conturo TE, Lee BC, Almli CR, McKinstry RC. Normal brain maturation during childhood: developmental trends characterized with diffusion-tensor MR imaging. Radiology. 2001 Nov;221(2):349–58. doi: 10.1148/radiol.2212001702. [DOI] [PubMed] [Google Scholar]
- Ou X, Sun SW, Liang HF, Song SK, Gochberg DF. The MT pool size ratio and the DTI radial diffusivity may reflect the myelination in shiverer and control mice. NMR Biomed. 2009a Jun;22(5):480–487. doi: 10.1002/nbm.1358. [DOI] [PMC free article] [PubMed] [Google Scholar]
- Ou X, Sun SW, Liang HF, Song SK, Gochberg DF. Quantitative magnetization transfer measured pool-size ratio reflects optic nerve myelin content in ex vivo mice. Magn Reson Med. 2009b Feb;61(2):364–371. doi: 10.1002/mrm.21850. [DOI] [PMC free article] [PubMed] [Google Scholar]
- Paus T. Growth of white matter in the adolescent brain: Myelin or axon? Brain Cogn. 2009 Jul; doi: 10.1016/j.bandc.2009.06.002. [DOI] [PubMed] [Google Scholar]
- Peled S. New perspectives on the sources of white matter dti signal. IEEE Trans Med Imaging. 2007 Nov;26(11):1448–55. doi: 10.1109/TMI.2007.906787. [DOI] [PMC free article] [PubMed] [Google Scholar]
- Perge JA, Koch K, Miller R, Sterling P, Balasubramanian V. How the optic nerve allocates space, energy capacity, and information. J Neurosci. 2009 Jun;29(24):7917–28. doi: 10.1523/JNEUROSCI.5200-08.2009. [DOI] [PMC free article] [PubMed] [Google Scholar]
- Rademacher J, Engelbrecht V, Burgel U, Freund H, Zilles K. Measuring in vivo myelination of human white matter fiber tracts with magnetization transfer MR. Neuroimage. 1999 Apr;9(4):393–406. doi: 10.1006/nimg.1998.0416. [DOI] [PubMed] [Google Scholar]
- Ramani A, Dalton C, Miller DH, Tofts PS, Barker GJ. Precise estimate of fundamental in vivo MT parameters in human brain in clinically feasible times. Magn Reson Imaging. 2002 Dec;20(10):721–731. doi: 10.1016/s0730-725x(02)00598-2. [DOI] [PubMed] [Google Scholar]
- Rohde GK, Barnett AS, Basser PJ, Marenco S, Pierpaoli C. Comprehensive approach for correction of motion and distortion in diffusion-weighted MRI. Magn Reson Med. 2004 Jan;51(1):103–14. doi: 10.1002/mrm.10677. [DOI] [PubMed] [Google Scholar]
- Ropele S, Seifert T, Enzinger C, Fazekas F. Method for quantitative imaging of the macromolecular 1H fraction in tissues. Magn Reson Med. 2003 May;49(5):864–871. doi: 10.1002/mrm.10427. [DOI] [PubMed] [Google Scholar]
- Rushton WAH. A theory of the effects of fibre size in medullated nerve. J Physiol. 1951 Sep;115(1):101–22. doi: 10.1113/jphysiol.1951.sp004655. [DOI] [PMC free article] [PubMed] [Google Scholar]
- Schmierer K, Scaravilli F, Altmann DR, Barker GJ, Miller DH. Magnetization transfer ratio and myelin in postmortem multiple sclerosis brain. Ann Neurol. 2004 Sep;56(3):407–415. doi: 10.1002/ana.20202. [DOI] [PubMed] [Google Scholar]
- Schröder JM, Bohl J, von Bardeleben U. Changes of the ratio between myelin thickness and axon diameter in human developing sural, femoral, ulnar, facial, and trochlear nerves. Acta Neuropathol. 1988;76(5):471–83. doi: 10.1007/BF00686386. [DOI] [PubMed] [Google Scholar]
- Sherbondy A, Akers D, Mackenzie R, Dougherty R, Wandell B. Exploring connectivity of the brain's white matter with dynamic queries. IEEE Trans Vis Comput Graph. 2005;11(4):419–30. doi: 10.1109/TVCG.2005.59. [DOI] [PubMed] [Google Scholar]
- Sherbondy AJ, Dougherty RF, Napel S, Wandell BA. Identifying the human optic radiation using diffusion imaging and fiber tractography. J Vis. 2008;8(10):12.1–11. doi: 10.1167/8.10.12. [DOI] [PMC free article] [PubMed] [Google Scholar]
- Sled JG, Pike GB. Quantitative interpretation of magnetization transfer in spoiled gradient echo MRI sequences. J Magn Reson. 2000 Jul;145(1):24–36. doi: 10.1006/jmre.2000.2059. [DOI] [PubMed] [Google Scholar]
- Sled JG, Pike GB. Quantitative imaging of magnetization transfer exchange and relaxation properties in vivo using MRI. Magn Reson Med. 2001 Nov;46(5):923–931. doi: 10.1002/mrm.1278. [DOI] [PubMed] [Google Scholar]
- Song SK, Sun SW, Ramsbottom MJ, Chang C, Russell J, Cross AH. Dysmyelination revealed through mri as increased radial (but unchanged axial) diffusion of water. Neuroimage. 2002 Nov;17(3):1429–36. doi: 10.1006/nimg.2002.1267. [DOI] [PubMed] [Google Scholar]
- Stanisz GJ, Odrobina EE, Pun J, Escaravage M, Graham SJ, Bronskill MJ, Henkelman RM. T1, T2 relaxation and magnetization transfer in tissue at 3T. Magn Reson Med. 2005;54(3):507–512. doi: 10.1002/mrm.20605. [DOI] [PubMed] [Google Scholar]
- Stufflebeam SM, Witzel T, Mikulski S, Hämäläinen MS, Temereanca S, Barton JJS, Tuch DS, Manoach DS. A non-invasive method to relate the timing of neural activity to white matter microstructural integrity. Neuroimage. 2008 Aug;42(2):710–6. doi: 10.1016/j.neuroimage.2008.04.264. [DOI] [PMC free article] [PubMed] [Google Scholar]
- Sundgren PC, Dong Q, Gómez-Hassan D, Mukherji SK, Maly P, Welsh R. Diffusion tensor imaging of the brain: review of clinical applications. Neuroradiology. 2004 May;46(5):339–50. doi: 10.1007/s00234-003-1114-x. [DOI] [PubMed] [Google Scholar]
- Szafer A, Zhong J, Gore JC. Theoretical model for water diffusion in tissues. Magn Reson Med. 1995 May;33(5):697–712. doi: 10.1002/mrm.1910330516. [DOI] [PubMed] [Google Scholar]
- Tofts P. Wiley; Chichester, West Sussex: 2003. Quantitative MRI of the brain : measuring changes caused by disease. URL http://www.loc.gov/catdir/description/wiley037/2003041199.html. [Google Scholar]
- Tournier JD, Calamante F, Gadian DG, Connelly A. Direct estimation of the fiber orientation density function from diffusion-weighted mri data using spherical deconvolution. Neuroimage. 2004 Nov;23(3):1176–85. doi: 10.1016/j.neuroimage.2004.07.037. [DOI] [PubMed] [Google Scholar]
- Underhill HR, Yuan C, Yarnykh VL. Direct quantitative comparison between cross-relaxation imaging and diffusion tensor imaging of the human brain at 3.0 t. Neuroimage. 2009 Oct;47(4):1568–78. doi: 10.1016/j.neuroimage.2009.05.075. [DOI] [PubMed] [Google Scholar]
- Wakana S, Caprihan A, Panzenboeck MM, Fallon JH, Perry M, Gollub RL, Hua K, Zhang J, Jiang H, Dubey P, Blitz A, van Zijl P, Mori S. Reproducibility of quantitative tractography methods applied to cerebral white matter. Neuroimage. 2007 Jul;36(3):630–644. doi: 10.1016/j.neuroimage.2007.02.049. [DOI] [PMC free article] [PubMed] [Google Scholar]
- Waxman SG. Integrative properties and design principles of axons. Int Rev Neurobiol. 1975;18:1–40. doi: 10.1016/s0074-7742(08)60032-x. [DOI] [PubMed] [Google Scholar]
- Wolff SD, Balaban RS. Magnetization transfer contrast (MTC) and tissue water proton relaxation in vivo. Magn Reson Med. 1989 Apr;10(1):135–144. doi: 10.1002/mrm.1910100113. [DOI] [PubMed] [Google Scholar]
- Yarnykh VL. Pulsed Z-spectroscopic imaging of cross-relaxation parameters in tissues for human MRI: theory and clinical applications. Magn Reson Med. 2002 May;47(5):929–939. doi: 10.1002/mrm.10120. [DOI] [PubMed] [Google Scholar]
- Yarnykh VL, Yuan C. Cross-relaxation imaging reveals detailed anatomy of white matter fiber tracts in the human brain. Neuroimage. 2004 Sep;23(1):409–424. doi: 10.1016/j.neuroimage.2004.04.029. [DOI] [PubMed] [Google Scholar]
- Zhang W, Olivi A, Hertig SJ, van Zijl P, Mori S. Automated fiber tracking of human brain white matter using diffusion tensor imaging. Neuroimage. 2008 Aug;42(2):771–777. doi: 10.1016/j.neuroimage.2008.04.241. [DOI] [PMC free article] [PubMed] [Google Scholar]
- Zhang Y, Zhang J, Oishi K, Faria A, Jiang H, Li X, Akhter K, Rosa-Neto P, Pike G, Evans A, Toga A, Woods R, Mazziotta J, Miller M, van Zijl P, Mori S. Atlas-guided tract reconstruction for automated and comprehensive examination of the white matter anatomy. Neuroimage. 2010 May; doi: 10.1016/j.neuroimage.2010.05.049. [DOI] [PMC free article] [PubMed] [Google Scholar]
Associated Data
This section collects any data citations, data availability statements, or supplementary materials included in this article.