

Abstract
Doxorubicin (DOX) is one of the most commonly used chemotherapeutic drugs and a popular research tool due to the inherent fluorescence of the DOX molecule. After DOX injection, fluorescence imaging of organs or cells can provide information on drug biodistribution. Therapeutic and imaging capabilities combined in a DOX molecule make it an excellent theranostic agent. However, DOX fluorescence depends on a number of factors that should be taken into consideration when interpreting results of DOX fluorescence measurements. Discussing these problems is the main thrust of the current paper. The sensitivity of DOX fluorescence intensity to DOX concentration, local microenvironment, and interaction with model cellular components is illustrated by fluorescence spectra of paired DOX/phosphilipid, DOX/histone, DOX/DNA, and triple DOX/histone/DNA and DOX/phospholipid/DNA systems. DOX fluorescence is dramatically quenched upon intercalation into the DNA; DOX fluorescence is also self-quenched at high concentrations of molecularly dissolved DOX; in contrast, DOX fluorescence is increased after binding to the histone or partitioning into the phospholipid phase of PEG-phospholipid micelles or hydrophobic cores of polymeric micelles. While flow cytometry is commonly used for characterization of DOX intracellular uptake, the above aspects of DOX fluorescence may significantly complicate interpretation of flow cytometry results. High cell fluorescence measured by flow cytometry may provide deceptive information on the actual intracellular DOX concentration and may not correlate with the therapeutic efficacy if DOX does not penetrate into the site of action in cell nuclei. These problems are illustrated in the experiments on the intracellular trafficking of DOX encapsulated in poly(ethylene oxide)-co-polycaprolactone (PEG-PCL) micelles or PEG-PCL stabilized perfluorocarbon nanodroplets, with and without the application of ultrasound used as an external trigger. For efficient encapsulation in micelle cores, DOX is usually deprotonated, which removes the positive charge and enhances hydrophobicity of DOX molecule. It was found that the deprotonated DOX accumulated in the cell cytoplasm but did not penetrate into the cell nuclei. The same was true for the DOX encapsulated in micelles or nanodroplets, which may explain their low therapeutic efficacy in the absence of ultrasound. Ultrasound triggers DOX trafficking into the cell nuclei, which is especially pronounced in the presence of nanoemulsions that convert into microbubbles under the ultrasound action. Microbubble cavitation results in the transient permeabilization of both plasma and nuclear membranes thus allowing DOX penetration into the cell nuclei, which dramatically enhances therapeutic efficacy of DOX-loaded nanodroplet systems.
Keywords: Theranostics, Doxorubicin, fluorescence spectra, DNA, histone, micelles, nanoemulsions, ultrasound
Introduction
Doxorubicin (DOX), with a trade name Adriamycin is one of the most commonly used chemotherapeutic drugs. Since its inception in the 1960s, doxorubicin has been used for treatment of leukemias, Hodgkin's lymphoma, bladder, breast, stomach, lung, ovarian and thyroid cancers, soft tissue sarcoma, multiple myeloma, and other types of cancer. DOX is an anthracycline antibiotic in which a flat anthraquinone nucleus of the molecule is linked through a glycosidic bond at ring atom 7 to an amino sugar, daunosamine (Figure 1).
Figure 1.

Chemical structure of doxorubicin hydrochloride.
In order to increase aqueous solubility, amino group of the sugar is protonated by forming a DOX hydrochloride. The anthraquinone part of the molecule is highly lipophilic while sugar part is hydrophilic. DOX molecule contains acidic functions in the ring phenolic groups and a basic function in the sugar amino group. Therefore DOX molecule is both amphiphilic and amphoteric, which results in DOX binding to cell membranes and proteins.
Multiple mechanisms have been proposed to explain the cytostatic and cytotoxic actions of anthracyclines. The main mechanism of the DOX antineoplastic activity is thought to be associated with the intercalation of the planar anthracycline chromophore group between two base pairs of the DNA, with the six-member daunosamine sugar being localized in the minor groove of a double helix where it interacts with flanking base pairs adjacent to the intercalation site, as evidenced by crystal structure 1. DOX intercalation into DNA inhibits the progression of the enzyme topoisomerase II, which unwinds DNA for transcription. Topoisomerase I and II (topo I and II) are enzymes which alter the topological state of DNA through DNA strand cleavage, strand passage and relegation 2–4. Doxorubicin poisons these enzymes by stabilizing a putative reaction intermediate called the cleavable complex (cc) where the topoisomerase remains covalently attached to either one strand of DNA (topo I) or both strands of double helix (topo II) after strand cleavage. Formation of the cc may cause cell death either by interfering with replication forks, by promoting illegitimate genomic-DNA recombination, by arresting cells in the G2-phase of the cell cycle, or by inducing apoptosis. Other suggested mechanisms of DOX cytotoxicity include free radical formation, lipid peroxidation, and direct membrane effects. DOX binding to cell membranes ultimately results in production of active oxygen species, especially hydroxyl radicals generated in DOX enzymatic reduction catalyzed by iron and/or cupper ions 5–8; this results in a decline of mitochondrial oxidative phosphorylation. The attack of reactive oxygen species on the myocytes has been implicated as the main cause of a severe DOX cardiotoxicity 7, 9–14.
In an attempt to reduce cardiotoxicity and make DOX more tumor targetable, DOX was encapsulated in liposomes, and later in polyethylene glycol-coated (PEGylated) liposomes 15–20. DOX incorporated in PEGylated liposomal manifested reduced side effects (neutropenia, alopecia, and cardiotoxicity) 21. Incorporation of doxorubicin into polyethylene glycol-coated (pegylated) liposomes favorably altered the pharmacokinetics of the drug (for recent review see ref. 22). A pharmacokinetic profile of PEGylated liposomal DOX was characterized by an extended circulation time and a reduced volume of distribution, thereby promoting tumor uptake. Clinical studies showed the initial distribution phase with a half-life of 1 – 3 hours (to be compared with 5 min for a free DOX). The half-life of the second distribution phase was 30 – 90 hours. For a dose of 50 mg/m2, the volume of distribution was close to the blood volume, and the area under the concentration-time curve (AUC) was increased about 300-fold compared with free doxorubicin 16, 17. Studies of tissue distribution indicated preferential accumulation into various implanted tumors and human tumor xenografts, with an enhancement of drug concentrations in the tumor when compared with free drug. For the liposomal DOX, cardiotoxicity was markedly reduced. However, DOX encapsulation in liposomes caused a new toxicity problem called hand-foot syndrome 23–25. Later, DOX encapsulation in nanoparticles other than liposomes, including dendrimers, polymeric micelles, and nanoemulsions has been investigated 26–37. The total number of DOX-related publications amounts to more than 42,000 in a 40-year period starting with 1971. Among those, 535 entries are related to PEGylated liposomal DOX and 230 entries are related to DOX encapsulated in polymeric micelles.
In addition to being a commonly used antineoplastic agent, Doxorubicin is a popular research tool due to its inherent fluorescence associated with the central anthracycline chromophore group. In principle, this allows visualization of DOX distribution in various tissues or cells via fluorescence imaging. Therapeutic and imaging capabilities combined in a DOX molecule make it an excellent theranostic agent.
DOX fluorescence has been commonly used for characterization of its intracellular uptake using flow cytometry. However during the last decade, it became progressively clear that this approach may have serious limitations due to a strong dependence of DOX fluorescence intensity on its concentration and microenvironment 38, 39. In what follows, in model experiments, we illustrate dependence of DOX fluorescence intensity on interaction with various cell components such as the DNA, histone, and phospholipids. We use this information to characterize the intracellular DOX uptake and trafficking in ovarian carcinoma A2780 cells for DOX that is either molecularly dissolved (“free DOX”) or encapsulated in polymeric micelles or perfluorocarbon nanoemulsions. DOX delivery was or was not combined with the application of the therapeutic ultrasound used as an external trigger. The importance of this study stems from a broad application of DOX as chemotherapeutic agent, with the ultimate goal of enhancing DOX targeting to tumors, improving its therapeutic index and reducing systemic toxicity.
During the last decade, advances in nanomedicine have allowed the combination of various functionalities (e.g., chemotherapeutic agent, imaging agent, and targeting moiety) in one molecular or supramolecular construct. The family of nanoparticles of biomedical importance includes polymeric micelles, liposomes, and nano-emulsion droplets. Efforts of many laboratories have been focused on developing stimuli responsive nanoparticles that would allow drug targeting to tumors as well as spatial and temporal control of drug delivery 33. In earlier publications, we have shown that DOX encapsulation in Pluronic® micelles reduced its intracellular uptake while application of ultrasound triggered drug release from micelles and enhanced the intracellular uptake of both released drug and polymeric nanocarriers 30, 32, 36, 40–43.
Ultrasound-mediated drug delivery in nanocarriers offers a number of important benefits. Potentially, it may allow combining mild hyperthermia with enhanced extravasation of drug carriers, localized intratumoral drug release and enhanced intracellular uptake. These effects are enhanced in the presence of cavitating microbubbles 35. For many decades, microbubbles have been used in clinical practice only as ultrasound contrast agents. During the last decade, microbubbles have attracted attention as drug carriers and enhancers of drug and gene delivery and are now being widely investigated for this application 44–54. However short circulation time (minutes) and relatively large size (two to ten microns) of currently used commercial microbubbles does not allow effective extravasation into tumor tissue, preventing efficient tumor targeting. To solve this problem, we have recently developed novel drug-loaded perfluorocarbon nanoemulsions stabilized by biodegradable amphiphilic block copolymers 35, 55–57. Using DOX 35 or paclitaxel loaded perfluoropentane (PFP) nanoemulsions combined with tumor-directed therapeutic ultrasound 56, 58, we have achieved effective regression of ovarian, breast, and pancreatic tumors. Without ultrasound, low therapeutic effect of the PFP nanodroplet-encapsulated DOX and no therapeutic effect of the PFP nanodroplet-encapsulated paclitaxel were observed 35, 56, 58. Empty (i.e. not drug loaded) nanodroplet combined with ultrasound produced no therapeutic effects, indicating that strong therapeutic effects observed in drug loaded nanoemulsion/ultrasound therapy were exerted by the ultrasound activated action of drug rather than mechanical action of ultrasound.
Many features of the mechanism/mechanisms involved in the ultrasound mediated drug/gene delivery with and without nanodroplets or microbubbles remain obscure. This has inspired current study in which either molecularly dissolved, or micelle and nanodroplet-encapsulated DOX was used as a reporter on the effect on drug intracellular uptake and trafficking. DOX formulations were characterized by optical and fluorescence spectroscopy while DOX intracellular distribution was visualized by laser confocal microscopy.
Materials and Methods
Materials
Doxorubicin hydrochloride; lyophilized Histone (Type III – S, from Calf Thymus) and Deoxyribonucleic acid (Sodium Salt, from Calf Thymus) (DNA) were obtained from Sigma-Aldrich (St. Louis, Missouri, USA). Poly(ethylene glycol)–co–polycaprolactone (PEG, 2000 Da - PCL, 2,600 Da) was purchased from Polymer Source, Quebec, Canada. PEGylated phospholipid 1,2-distearoyl-sn-glycero-3-phosphoethanolamine-N-methoxy (polyethylene glycol)-2000] (ammonium salt) (PEG-PE) was obtained from Avanti Polar Lipids (Alabaster, Alabama). Perfluoro-15-crown-5-ether (PFCE), Hoechst 33258, DAPI, phosphate buffered saline (PBS), tetrahydrofuran (THF, purity ≥ 99.9%), triethylamine (TEA, purity ≥ 99.5%), and dimethyl sulfoxide (DMSO, purity ≥ 99.7%) were obtained from Sigma-Aldrich (St. Louis, Missouri, USA) and used without further purification. Perfluoropentane (PFP) was purchased from Fluoromed Inc. (Round Rock, Texas, USA). TE buffer was obtained from Fisher Bioreagents Inc. (Pittsburgh, Pennsylvania, USA).
Preparation of empty PEG-PCL micelles
PEG-PCL was dissolved in tetrahydrofuran (THF) and filtered deionized water was added to induce micelle formation. The solution was dialyzed through a 3,500 Da cutoff SpectraPor membrane (Spectrum Laboratories Inc, Rancho Dominguez, CA) in order to remove the organic solvent. At the final stage, micellar solution was dialyzed against PBS. The micellar solution was refrigerated until use.
Preparation of DOX-loaded PEG-PCL micelles
Commercial doxorubicin (Sigma aldrich, St. Louis, MO) is marketed as hydrochloride salt in order to increase its aqueous solubility. However for efficient incorporation of the drug into the hydrophobic micelle cores, the drug needs to be hydrophobised. This was achieved by incubating DOX solution in DMSO overnight with 1:2 molar ratio of triethylene amine (TEA), which resulted in deprotonation of the sugar amino group. A 5% solution of PEG-PCL in THF was mixed with the deprotonated DOX solution in DMSO followed by addition of filtered PBS to obtain a final copolymer concentration of 1% (w/v). Typically in various preparations, DOX concentration in this mixture was 50 μg/mL to 65 μg/mL and DMSO concentration was less than 1.6 % (v/v). The mixture was vortexed to accelerate mixing. The organic solvent was removed by evaporation in a nitrogen stream. The micellar solution formed was ultracentrifuged at 4,000 g for 60 min through a 30,000 Da cutoff membrane to remove free DOX. The residual micellar solution inside the membrane compartment was diluted by a solution of empty PEG-PCL micelles to produce desired copolymer and DOX concentration.
Preparation of DOX-loaded nanoemulsions
Using a cooled pipette tip, empty or DOX-containing micellar solutions were placed in a cooled container and a desired volume of either perfluoro-15-crown-5-ether (PFCE) or perfluoropentane (PFP) was added; the mixture was sonicated in ice-cold water by 20-kHz ultrasound (cup-horn installation, Sonics, Newtown, CT) to generate the PFCE or PFP nanoemulsions until all perfluorocarbon was transferred into the nanoemulsion.
Confirming DOX loading into nanodroplets by fluorescence imaging
DOX loaded 1 % PFCE and PFP emulsion solutions were centrifuged and resuspended in PBS. A drop of the solution was placed on a glass slide and fluorescence of DOX bound to the droplets was examined using an inverted confocal microscope (Olympus IX81, Olympus America Inc., Center Valley, PA), with 60x/1.45 - standard oil immersion eyepiece. DOX fluorescence was excited at 488 nm and the emission was detected through 570 nm bandpass emission filter. The images were processed using ImageJ software59
Size distribution of micelles and droplets
Size distributions of micelles and nanoemulsions were analyzed using dynamic light scattering (Delsa Nano S, Beckman Coulter, BREA, CA), which produced reliable size measurements in the range from 10 nm to 3 μm. However droplets larger than 1 μm precipitated from the suspension during measurement procedure and could not be reliably measured by light scattering. Therefore the size and concentration of larger droplets was characterized by the optical microscopy.
Fluorescence spectroscopy
UV-Vis absorbance and fluorescence spectra of the samples were recorded using a microplate reader (SpectraMax M2e, Molecular devices, Sunnyvale, CA). The DOX absorbance was measured in the wavelength range of 400 to 550 nm. DOX fluorescence was excised at 488 nm and fluorescence spectra were obtained over the wavelength range of 535 to 650 nm. The samples were measured in Corning® 96 well plate (black plate with a clear bottom) (Sigma Aldrich, St Louis, MO).
Measurements of DOX incorporation into micelles and nanodroplets
DOX concentration in the micelles was quantified based on the control curve that manifested linear dependence of DOX optical density on concentration. The degree of DOX incorporation into droplets was measured by depletion from the supernatant after droplet removal from the micellar solution by centrifugation.
Characterization of DOX interaction with various cellular components by fluorescence spectroscopy
In order to characterize the effect of DOX interaction with the DNA, histone, or phospholipids, DOX fluorescence spectra were recorded before and after introduction of corresponding agents into the DOX solution in PBS. In a stock solution, DNA was dissolved in the TE buffer (10mM Tris-HCl containing 1mM EDTA • Na2, pH ~ 8.0). Histone was dissolved in PBS. The experiments were run in triplicates. The differences between samples prepared in parallel did not exceed 10%. In addition, for each sample, spectra were recorded in three consecutive days after the sample preparation. Samples were kept in darkness at 4 °C; however some drop of the DOX fluorescence (not exceeding 20%) was observed on the third day; the normalized spectra and the trends remained unchanged.
Cell culture
A2780 ovarian cancer cells were cultured in RPMI-1640 medium (Sigma Aldrich, St Louis, MO) supplemented with 10% heat deactivated fetal bovine serum (FBS) (USA Scientific Inc., Orlando, FL ) and 1% penicillin–streptomycin (Sigma Aldrich, St Louis, MO). The cells were maintained at 37 °C in a humidified atmosphere with 5 % CO2.
Confocal imaging
A2780 cells were grown in an 8-well cover glass chamber (LabTek Chambered Cover Glass, NUNC, Rochester, NY) and incubated with various DOX formulations. Hoechst 33258 stain (Sigma Aldrich, St Louis, MO) was added after the incubation to identify cell nuclei. Confocal laser fluorescence images of the cells were obtained using inverted confocal microscope (Olympus IX81, Olympus America Inc., Center Valley, PA). Emission filters were 570 nm for DOX and 480 nm for Hoechst. Image slices of the cells attached to the cover slip were recorded at an incremental step of 0.5 μm from the bottom to the top of the cell layer in the z-direction. The images recorded were stacked in the z-direction and processed using ImageJ software 59
Sonication of suspended cells
A2780 cells were trypsinized and resuspended in RPMI 1640 media. The cell suspension was mixed 2:1 volume ratio with the following DOX-containing formulations: PBS solution of hydrophilic DOX-HCl or deprotonated DOX; DOX encapsulated in a 1.4 % PEG-PCL micellar solution; DOX encapsulated in a 1 % PFCE/1.4% PEG-PCL nanoemulsion; DOX encapsulated in a 1 % PFP/1.4% PEG-PCL nanoemulsion. Cell suspensions were sonicated in a Samco transfer pipette (Samco Scientific Corporation, CA), with ultrasound generated by Omnisound 3000 instrument (Accelerated Care Plus Inc, Sparks, NV); 1-MHz continuous wave (CW) or pulsed ultrasound with 33% duty cycle was delivered at 3.4 W/cm2 nominal power density, which corresponded to the 1.18 MPa actual peak-to-peak ultrasound pressure at the site of the sample; 3-MHz ultrasound was applied at 2 W/cm2 nominal power density, corresponding to 1.7 MPa peak-to-peak actual ultrasound pressure at the site of the sample. The ultrasound probe and the pipette, with a distance of 0.5 cm between them, were immersed in a water bath maintained at 37 °C. Ultrasound exposure was 60 s for CW ultrasound and 180 s for pulsed ultrasound, which provided the same total ultrasound exposure. Ultrasound pressure was measured using ONDA needle hydrophone (Onda HNR-0500) (calibrated in October, 2009) placed in front of the probe with a distance of 0.5 cm from the probe. Prior to sonication, cell suspensions in the desired formulation were incubated for 20 minutes at 37 °C. After ultrasound treatments, a drop of a cell suspension was place on a glass slide and imaged with confocal microscope as described above.
Sonication of substrate-attached cells through the agarose gel
A2780 cells were grown in 10-mL capacity OptiCell units (Biocrystal, Westerville, OH) to 90% confluence, upon which the cells were stained with 4', 6-diamidino-2-phenylindole (DAPI) (Sigma Aldrich, St. Louis, MO). The concentration of DAPI was 140 μg/mL. After incubation for 30 minutes at 37 °C, the media in OptiCell was replaced with 1.2% (w/v) agarose solution in PBS (Agarose II, GBiosciences, Maryland Heights, MO) containing either DOX-loaded micelles or DOX-loaded PFCE droplets added to the agarose solution at 37 °C. The gelling temperature of agarose was 24–28 °C. The final copolymer and DOX concentrations in the agarose gel were 4 μg/mL DOX/0.28 % PEG-PCL for the micellar formulation 4 μg/mL DOX/0.4% PFCE/0.28 % PEG-PCL for the nanodroplet formulation. The agarose solutions gelled upon cooling within 5 minutes after injection into the OptiCell units. The OptiCells were sonicated at 25 °C with different ultrasound parameters applied to different regions of the same OptiCell. After sonication, cells were imaged using confocal microscopy. Emission filters were 570 nm for DOX and 480 nm for DAPI. For each formulation, the OptiCell unit with sham sonication was used as a control.
Statistical treatment
In the region of interest (ROI) in the stacked confocal images, cell fluorescence (N = 15) was measured, mean values of cell fluorescence were calculated and statistical significance of the differences between the groups was evaluated using one way ANOVA. Post Hoc comparisons were perfotmed by Tukey HSD test. The data for each group are presented as mean values and confidence intervals.
Results
Size distributions of micelles and droplets
The average size of PEG-PCL micelles (19.6 nm) increased only slightly (to 22.8 nm) upon DOX loading. Size distributions of nanodroplets were bimodal; no effect of DOX loading was observed. For 1% PFCE/1% PEG-PCL droplets, a major peak was observed at 320 nm; a small fraction of particles had a size of 90 nm. Larger and more polydisperse droplets were observed in 1% PFP/1% PEG-PCL nanoemulsions, with the peaks at 160 nm and 720 nm. In nanoemulsion formulations, a population of particles with smaller sizes may represent either PEG-PCL micelles with perfluorocarbon dissolved in the micelle core or small droplets formed when perfluorocarbon separated from micelle cores into a liquid phase.
Fluorescence spectra of DOX hydrochloride
Concentrational dependence of DOX fluorescence
Figure 2A shows dependence of DOX optical absorbance on its concentration in the PBS solution; Figure 2B shows concentrational dependence of fluorescence intensity for the same solutions. These data show that while optical absorbance manifests linear dependence on DOX concentration, fluorescence intensity is essentially non-linear and gradually levels off at DOX concentrations above 25 μg/ml. This implies that if the concentration of a fluorescent population of intracellular DOX molecules exceeds some particular limit, cell fluorescence measured by flow cytometry may become insensitive to the actual intracellular DOX concentration.
Figure 2.

Dependence of the optical absorbance (A) and fluorescence intensity (B) on DOX concentration in PBS.
Note that in contrast to the fluorescence intensity, optical absorbance of DOX is not sensitive to microenvironment and therefore, light scattering permitting, may be used for measuring DOX concentration.
DOX interactions with individual cellular components
Dependence of DOX fluorescence on the hydrophobicity of local environment
We reported earlier for DOX encapsulated in Pluronic micelles that DOX fluorescence in micelle cores was significantly higher than in an aqueous environment, presumably due to DOX fluorescence quenching in collisions with water molecules 60, 61. This phenomenon was later used for measuring degree of DOX release from micelles under the action of ultrasound 36, 62. Enhanced DOX fluorescence intensity upon encapsulation in the hydrophobic core of micelles was also observed in the current study for DOX encapsulated in poly(ethylene oxide)-co-polycaprolacton (PEG-PCL) micelles (Figure 3A) or PEG-phospholipid micelles, PEG-PE (Figure 3B). Fluorescence spectra of Figure 3 were taken for the same DOX concentration in PBS and micelles which was confirmed by the equivalence of the optical spectra of the samples. The data of Figure 3B indicate that DOX partitions between the aqueous environment and PEG-phospholipid micelles; in the presence of PEG-PE, the spectrum results from the superposition of the individual spectra in an aqueous and phospholipid environment.
Figure 3.
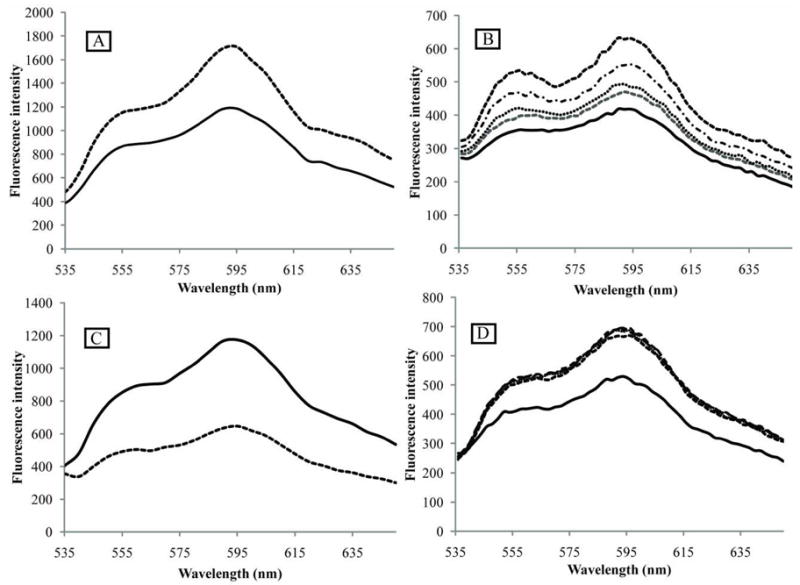
Fluorescence spectra of DOX upon interaction with PEG-PCL block copolymer (A), phospholipid micelles (B), DNA (C), and histone (D). (A) – effect of DOX encapsulation in PEG-PCL micelles. DOX concentration 25 μg/ml (43 μM). Solid line - DOX dissolved in PBS; dashed line – DOX encapsulated in 0.4% PEG-PCL micelles. (B) - effect of PEG-PE micelles. DOX concentration 8.3 μg/ml (14 μM). Solid line – DOX dissolved in PBS; dashed lines – DOX in PEG-PE micelles. PEG-PE concentrations (from bottom to top): 27.8 μg/ml (9.9 μM); 55.6 μg/ml (19.8 μM); 111.2 μg/ml (39.6 μM), and 222.4 μg/ml (79.2 μM). (C) – effect of DOX intercalation into the DNA; DOX concentration 8.3 μg/ml (14 μM). DNA concentration 18.9 μg/ml (30 μM base pairs); Solid line – DOX dissolved in PBS; dashed line – DOX intercalated into the DNA. (D) – effect of DOX interaction with histone. DOX concentration 8.3 μg/ml (14 μM). Solid line – DOX dissolved in PBS; dashed lines - DOX associated with histone; histone concentrations: 1.6 μM; 3.2 μM; 6.4 μM, and 12.8 μM.
Figure 3B shows that DOX incorporation into the lipid phase results in increase of its fluorescence intensity, which may result from protection of DOX against collisions with water molecules that causes fluorescence quenching.
Dependence of DOX fluorescence on the interaction with the DNA and histone
DOX fluorescence is known to be dramatically quenched upon DOX intercalation into the DNA, as illustrated in Figure 3C. The DOX/DNA spectrum presented in Figure 3C results from a superposition of the spectra generated by DOX intercalated into the DNA and “free” DOX in the PBS solution. With an assumption that the measured fluorescence of the paired DOX/DNA system presented in Figure 3C was generated exclusively by DOX disslolved in PBS solution, the data obtained in the current study suggest that every fourth DNA base pair was occupied by DOX molecules:
| (1) |
Earlier we studied the DOX/DNA interaction in the presence or absence of Pluronic micelles; the data suggested that DOX occupied every fifth base pair in vitro in experiments with fetal calf thymus DNA and every sixth base in the cell culture experiments 41. In the literature, the data for DOX/DNA systems vary between four and six base pairs per DOX molecule 38, 63.
Figure 3D shows the effect of histone on DOX fluorescence in the PBS solution. Histone concentrations were tested in the range of 0.7 μg/ml (0.4 μM) to 222.4 μg/ml (12.8 μM); practically no differences between the spectra were observed. Introduction of the histone increased DOX fluorescence. For the DOX concentration of 14 μM, the leveling off of fluorescence was observed at the lowest histone concentration tested (0.4 μM) suggesting that already at the lowest histone concentration, all DOX molecules were associated with the histone; a slight decrease of fluorescence at the higher histone concentration may be caused by protein aggregation. The data presented above indicate that (a) DOX strongly binds to the histone; and (b) DOX binding to the histone increases DOX fluorescence intensity.
DOX fluorescence in the triple DOX/DNA/histone and DOX/DNA/PEG-PE systems
We next sought to determine the effects of the histone and the phospholipid on the DOX fluorescence in the complex with the DNA (Figure 4A, B). Therefore we introduced the DNA into DOX/histone and DOX/PEG-PE paired systems shown in Figure 3. The triple system DOX/DNA/Histone dissolved in PBS imitates to some extent the situation in the nuclei of DOX-treated cells where the DNA is wound around the histone and dispersed in the nucleoplasm.
Figure 4.

(A) - DOX fluorescence in a triple systems DOX/DNA/histone; (B) - DOX fluorescence in a triple systems DOX/DNA/PEG-PE. DOX concentration 14 μM; DNA concentration 18.9 μg/ml (30 μM base pairs). Solid lines in (A) and (B) – fluorescence of the DOX/DNA paired system. (A) - histone concentrations (from bottom to top, dashed and dotted lines): 1.6 μM (dotted line); 12.8 μM; 6.4 μM; and 3.2 μM. (B) – PEG-PE concentrations (from bottom to top, dashed and dotted lines): 9.9 μM; 19.8 μM; 39.6 μM, and 79.2 μM. (C) - dependence of DOX fluorescence intensity at 592 nm on histone concentration; (D) - dependence of DOX fluorescence intensity at 592 nm on PEG-PE concentration. Paired systems – diamonds; triple systems - circles.
Figures 4A and C show that DOX fluorescence in the DOX/DNA complex was substantially increased after the introduction of the histone; moreover, in the triple system, the dependence of the fluorescence intensity on histone concentration was observed in a broader range of histone concentrations than in paired DOX/histone systems indicating that DOX partitioned between the DNA and the histone. Using the data obtained from the paired DOX/DNA and DOX/histone spectra, we determined that the measured value of the fluorescence intensity in the triple DOX/DNA/histone system (30 μM base pairs, 14 μM DOX, and 1.6 μM histone at the lowest concentration) could be well approximated with the assumption that every fourth base pair in the DNA molecule was intercalated with the DOX, while the residual DOX molecules were totally associated with the histone:
| (2) |
where x is a DNA-associated fraction of total DOX concentration. Based on the data for paired DOXPBS/DOXhistone systems, DOX was exclusively associated with histone even at the lowest histone concentration measured. Therefore in the triple system DOX could be considered to partition between the DNA and histone. Neglecting fluorescence input from the DNA-intercalated DOX, we come to the equation
| (3) |
Based on this estimation, in the triple system comprising 14 μM DOX, 1.6 μM histone, and 30 μM DNA base pairs, 53% of the DOX is associated with the histone. It is DOX binding to histone in cell nuclei that allows visualization of DOX accumulation in cell nuclei by fluorescence microscopy.
The introduction of phospholipid micelles into the DOX/DNA system increased DOX fluorescence in a concentration dependent manner (Figures 4B and D). Interestingly, DOX spectra in the triple DOX/DNA/PEG-PE system (Figure 4B) manifested different shapes in comparison to those in a paired DOX/PEG-PE system (Figure 3B). In the triple system, the ratio between the intensities of the first and second fluorescence peaks I560/I590 was substantially increased so that the peak intensities were reversed. The shape of the spectrum in the triple system corresponds to the DOX insertion deep into the hydrophobic environment of the lipid core 38. This effect was hidden in a paired DOX/PEG-PE system because DOX partitioned between the aqueous phase and micelle cores, and resulting spectra presented a superposition of spectra generated by DOX in the PBS and PEG-PE micelles. In the triple system, DOX from the hydrophilic environment of PBS was effectively intercalated into the DNA and quenched, which allowed revealing spectra of DOX inserted into the lipid phase. Similar changes of the spectral shape after introduction of the DNA were observed for the DOX encapsulated in the PEG-PCL micelles (data not shown).
Summarizing the data presented above, the intracellular fluorescence of DOX is expected to result from a superposition of inputs from DOX molecules localized in various intracellular compartments such as the DNA, histone (and probably other proteins), cell membranes, cytoplasm, and nucleoplasm. The relative fluorescence inputs from these localizations will depend on a particular intracellular distribution of DOX molecules.
Armed with these data, we studied the intracellular uptake and trafficking of DOX in the ovarian carcinoma A2780 cells; DOX was either molecularly dissolved or encapsulated in polymeric micelles or nanoemulsions. These experiments were performed with and without therapeutic ultrasound used as an external trigger
DOX intracellular uptake and trafficking: effect of the type of DOX delivery system and ultrasound
The degree of DOX loading into PEG-PCL micelles and nanodroplets
DOX concentration in micelles was measured by UV-Vis spectroscopy using standard curves for a molecular solution of the DOX in PBS. For the initial DOX concentration of 65 μg/ml and initial copolymer concentration of 1%, the degree of DOX incorporation into micelles was 31%. DOX incorporation into nanodroplets was measured by depletion from micellar solution after nanodroplets removal by centrifugation. For either 1% PFCE or 1% PFP droplets stabilized with 1.4% PEG-PCL solution, 15% DOX was transferred from micelles onto droplets while 85% remained encapsulated in micelles. Therefore DOX-loaded nanodroplet formulations comprised DOX encapsulated in both micelles and nanodroplets.
DOX localization in nanodroplets
For DOX-loaded nanodroplets, DOX localization in nanodroplets was monitored with confocal microscopy. Figure 5 shows that DOX is localized in the droplet shells.
Figure 5.
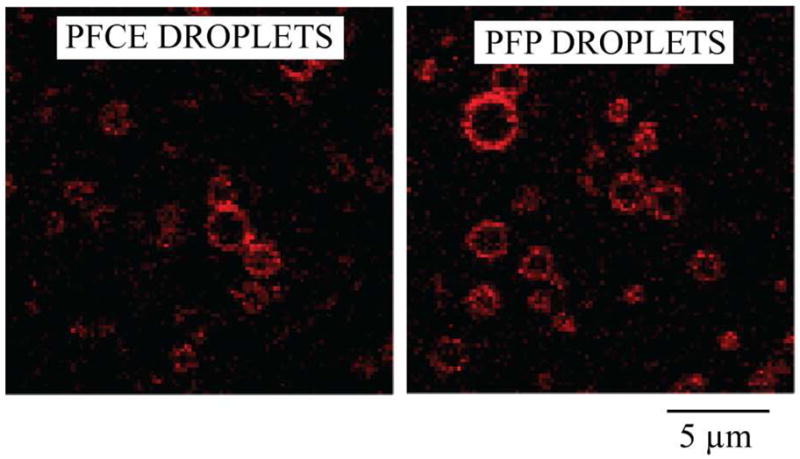
Confocal images of DOX loaded PFCE and PFP droplets.
Intracellular DOX trafficking
Effect of DOX deprotonation
As indicated in the Materials and Methods section, DOX was deprotonated before encapsulation in polymeric micelles in order to enhance its hydrophobicity. To simplify the interpretation of fluorescence images, cell nuclei were visualized by cell incubation with Hoechst 33258. Hoechst is a nuclear stain that easily penetrates into the nuclei of viable cells.
The DOX hydrochloride effectively accumulated in the cell nuclei of A2780 cells as exemplified in Figure 6.
Figure 6.
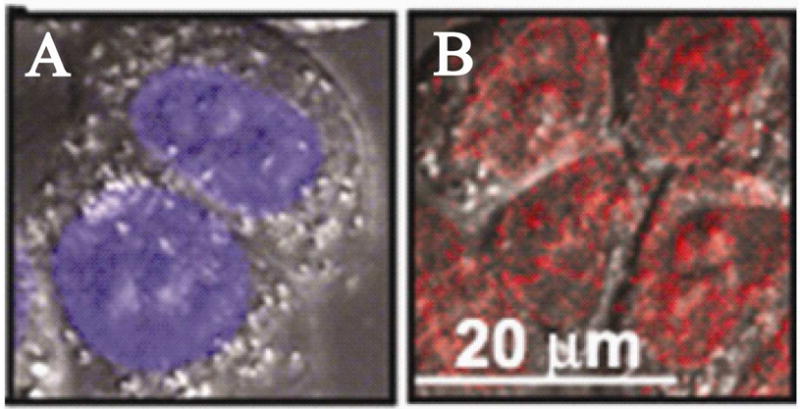
Stacked fluorescence images of A2780 cells incubated with (A) - Hoechst 33258 and (B) – DOX hydrochloride; DOX concentration in the incubation medium 20 μg/ml.
To better visualize the intracellular DOX distribution, we overlaid stacked images recorded in the Hoechst33235 and DOX channels; the color of the Hoechst images was artificially changed to green in order to generate a yellow color when the green color from the Hoechst 33258 and the red color from the DOX were mixed. In the images presented below, cells were first incubated with DOX, then Hoechst was introduced for visualization of cell nuclei. As shown in Figure 7, DOX deprotonation significantly impaired DOX ability to penetrate into cell nuclei. The nuclei of the cells presented in Figure 7 remained “green” after cell incubation or even sonication with the molecularly dissolved deprotonated DOX. This indicated that there was no DOX accumulation in the cell nuclei. On the other hand, DOX effectively accumulated in the cytoplasm.
Figure 7.
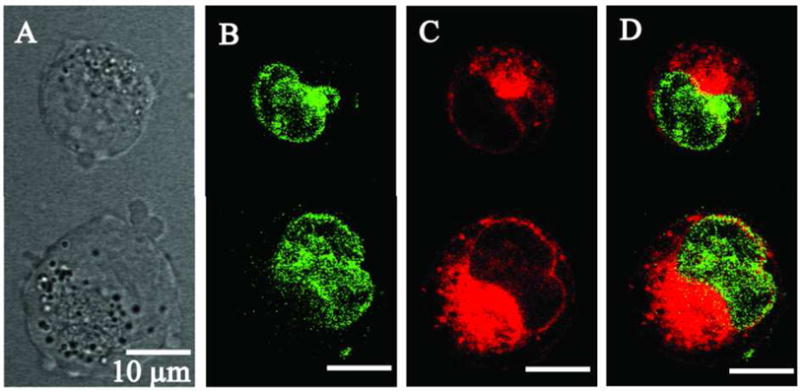
Laser confocal images of one slice of A2780 cells incubated/sonicated at 37 °C with a deprotonated DOX that was molecularly dissolved in PBS. Ultrasound parameters: 3-MHz CW, nominal power density 2W/cm2, actual peak-to-peak pressure 1.7 MPa, duration 60 s.
Effect of the DOX delivery system
The effect of the delivery system is illustrated in Figure 8 for A2780 cells incubated with DOX encapsulated in either PEG-PCL micelles (Figure 8A), PFCE/PEG-PCL nanodroplets (Figure 8B), or PFP/PEG-PCL nanodroplets (Figure 8C). These compositions were added to the culture medium at 1:3 volume ratios to get a final DOX concentration of 20 μg/ml (34 μM) in the incubation medium.
Figure 8.
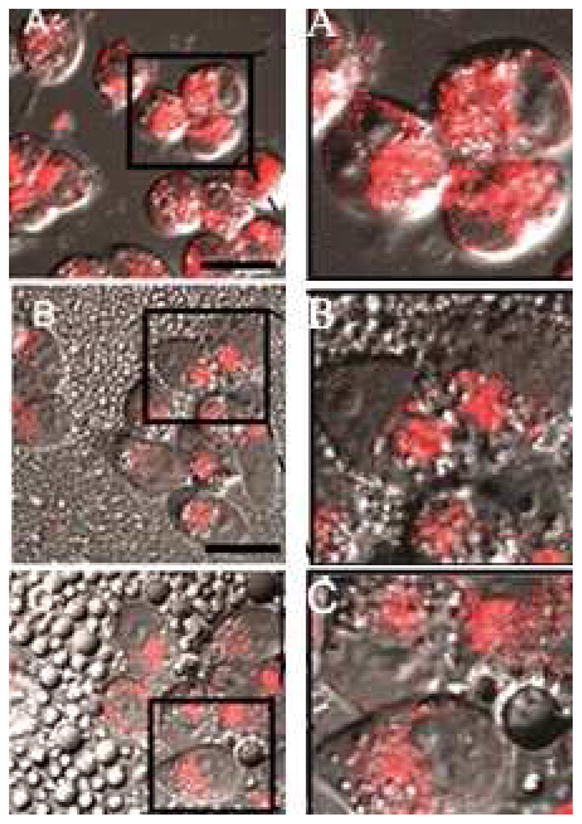
Fluorescence images of substrate-attached A2780 cells incubated with DOX encapsulated in (A) - PEG-PCL micelles; (B) - PFCE nanodroplets; (C) – PFP nanodroplets. DOX concentration in the incubation medium 20 μg/ml. Left column – original images; right column – magnified images of the selected areas in the corresponding panels of the left column; in the images of the right column, contrast was enhanced to better reveal DOX intracellular localization. Scale bar 20 μm.
DOX did not penetrate into the cell nuclei and was localized in the extranuclear compartments. The fluorescence of the cells dropped progressively from micelles to PFCE nanodroplets to PFP nanodroplets. Because the intracellular DOX distribution appeared to be similar for all three delivery systems, cell fluorescence intensity presumably reflected the intracellular DOX uptake that was two-fold lower for the PFCE nanodroplets and four-fold lower for the PFP nanodroplets compared with PEG-PCL micelles.
Statistical analysis
In each region of interest, fluorescence was measured for fifteen cells of each DOX formulation (micelles; PFCE droplets; and PFP droplets). Background fluorescence was subtracted. Independent of the delivery system, the fluorescence was found exclusively in the cell cytoplasm; no fluorescence of nuclei was observed (Figure 8). For each group, mean fluorescence values and 95% confidence intervals are reported in Table 1. Significance of differences between the groups was evaluated using ANOVA and post hoc Tukey HSD tests. Significant differences (F(2, 42) = 15.7; p ≪ 0.01) were observed between the groups; post hoc test showed that there were statistically significant differences between micelles and PFCE or PFP droplets but no significant differences between the droplets were observed.
Table 1.
Mean fluorescence values and confidence intervals for the cells incubated with 20 μg/ml (34.5 μM) DOX encapsulated in either 1.4% PEG-PCL micelles, 1% PFCE or 1% PFP nanodroplets.
| Sample | Mean fluorescence value inside the cells ( n = 15) | 95 % Confidence intervals |
|---|---|---|
| PEG-PCL micelles | 114.3 | (95.7, 132.9) |
| PEG-PCL stabilized PFCE droplets | 78.4 | (63, 93.7) |
| PEG-PCL stabilized PFP droplets | 53.8 | (43.7, 63.8) |
Effect of ultrasound
Cell sonication substantially enhanced DOX penetration into cell nuclei. This effect was especially pronounced in the presence of nanodroplets as illustrated in Figure 9 for the cells sonicated in the presence of DOX-loaded PEG-PCL micelles (A and A’) or nanodroplets (B and B’). Corresponding mean values for various groups with 95% confidence intervals are presented in Figure 10. The images of non-sonicated cells are presented in panels (A) and (B) while those of sonicated cells are presented in panels A’ and B’. The overlay images from the DAPI and DOX channels as well as images of individual slices show that for formulations without sonication, DOX was predominantly localized in the cytoplasm and the nuclear membranes that were clearly seen but not inside cell nuclei. After cell sonication with micellar encapsulated DOX, the intracellular DOX fluorescence increased both in the cypoplasm and nuclear membranes but most of the cells still did not allow efficient DOX penetration into cell nuclei (one rare cell with the nuclear DOX penetration is shown in Figure 9A’). In contrast, for cell sonicated in the presence of nanodroplets, most of the cells manifested both, increased overall fluorescence intensity and DOX penetration into the nuclei (Figure 9B’) suggesting that ultrasound application in the presence of nanodroplets induced perturbation of both, plasma and nuclear membranes. This resulted in the increased DOX uptake and nuclear trafficking.
Figure 9.
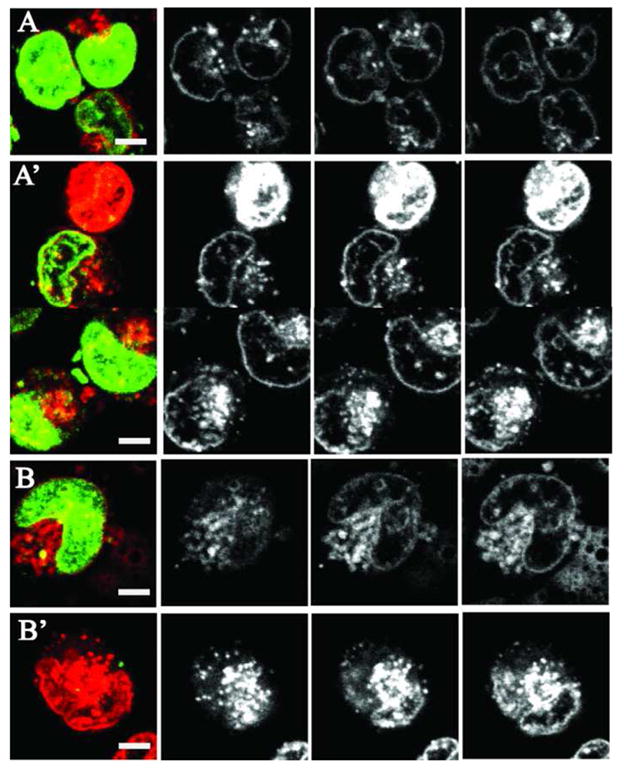
Overlay (left column) and three z-direction slices of the intracellular DOX fluorescence in A2780 cells that were either non-sonicated (A and B) or sonicated (A’ and B’) with DOX encapsulated in PEG-PCL micelles (A and A’) or PFCE/PEG-PCL nanodroplets (B and B’). Sonication conditions as indicated in Figure 7.
Figure 10.

Mean fluorescence values and 95% confidence intervals for the cytoplasm and nuclei of the cells incubated (white bars) or sonicated (black bars) with DOX encapsulated in micelles or PFCE nanodroplets (N = 15 for all groups except PFCE nanodroplets/ultrasound, for which N = 10).
Statistical analysis
ANOVA test was used to test statistical significance of the effect of ultrasound on the DOX intracellular uptake from micelles and nanodroplets. DOX penetration into the cell cytoplasm was treated separately from that into nuclei. Separation of the DOX located in the nuclear membrane and nuclear interior was difficult for the cells in which DOX penetrated into the nuclei. Therefore in Figure 10, nuclear DOX fluorescence includes both, the membrane and the interior of the nucleus. For all sonicated groups, effect of ultrasound was statistically significant (p ≪ 0.01). For the nuclear DOX penetration, the effect of ultrasound appeared stronger for the cells sonicated in the presence of nanodroplets; under the action of ultrasound, mean nuclear fluorescence increased 2.3-fold for micelles vs. 3.3-fold for nanodroplets.
Discussion
DOX fluorescence spectra
Summarizing the data on DOX interaction with cellular components, the intracellular fluorescence of DOX appears to be controlled by a series of equilibria, which include but are not restricted to the equilibrium between DOX localized in cell membranes and the cytoplasm (or other non-nuclear and non-membrane organelles), the equilibrium between DOX localized outside and inside the cell nucleus, and the equilibrium between the DNA-intercalated and histone bound DOX within the cell nucleus 41. The data presented above imply that after cell incubation with the DOX, the intracellular DOX fluorescence intensity results from a superposition of inputs from DOX molecules localized in various intracellular compartments such as the DNA, histone (and probably other proteins), cell membranes, cytoplasm, and nuceoplasm. The fluorescence inputs from these localizations depends on particular intracellular distribution of DOX that may depend on the type of the delivery system, cellular sensitivity or resistance to DOX treatment, 32, 33, 36, 41, 60, 64–68 and other factors.
Consider a hypothetical case of two cells with the same intracellular DOX concentration. In the first cell, DOX was predominantly localized in the cell nucleus where its fluorescence was essentially quenched in the interaction with the DNA; some nuclear fluorescence was preserved due to the DOX partitioning between the DNA and the histone (Figures 3D and 4A). In the second cell, DOX did not penetrate into the cell nucleus but was localized in the cytoplasm and/or cell membranes where its fluorescence was either not quenched or enhanced. The cell fluorescence measured by the flow cytometry would be higher for the second cell, while the chemotherapeutic action would be stronger for the cell with the nuclear DOX localization because the main site of DOX action is in cell nucleus. This example illustrates the importance of complementing flow cytometry data with the fluorescence imaging.
In real situations, the inhibition of DOX nuclear trafficking usually goes in parallel with the decreased intracellular DOX uptake, which is associated with DOX encapsulation in nanoparticles or conjugation to macromolecules. DOX encapsulation or conjugation is commonly used for tumor-targeting 64, 69–82 However, a decreased chemotherapeutic action of a conjugated or encapsulated DOX is usually observed. This negative effect may result from both, decreased internalization and decreased nuclear penetration. A number of actively or passively targeted DOX conjugates and micellar formulations entered clinical trials in the late 1990s; however they are not yet accepted in clinical practice 83, 84. A lot of effort has therefore been directed to increase the intracellular DOX uptake through active targeting or using cell-penetrating peptides (for reviews, see refs.85–87, and to promote nuclear trafficking by ensuring pH-dependent or enzymatic DOX release from nanoparticles or polymeric conjugates 88–93. In our research, we use an external trigger, ultrasound in order to attain the same goals 30, 32, 33, 35, 40, 41, 56, 67.
Summarizing, to analyze therapeutic efficacy of various DOX carriers, flow cytometry measurements should be complemented with fluorescence imaging that reveals the intracellular DOX localization. The best state of the art laser scanning fluorescence microscopes currently allow not only imaging of the intracellular DOX fluorescence in various cellular compartments but also recording fluorescence spectra of the DOX localized in these compartments 39. This instrument was used by Hovorka et al. for studying the intracellular distribution of the DOX macromolecular conjugate 39. The authors suggested a new approach for overcoming problems associated with the interpretation of DOX flow cytometry data. They showed that Hoechst 33258 and DOX competed for the same DNA sites. Therefore there was a linear decrease in the Hoechst 33258 fluorescence with increasing nuclear concentration of DOX. This approach may allow measuring Hoechst fluorescence intensity for quantification of the degree of DOX intercalation into the DNA.
DOX intracellular uptake and trafficking
We next used DOX as a reporter on the internalization and trafficking in the A2780 ovarian carcinoma cells when DOX was delivered in polymeric micelles or nanodroplets, with and without ultrasound stimulation. These systems have been extensively studied in vitro and in vivo 30, 32, 33, 35, 40, 41, 56, 58, 67 . However some aspects of the mechanisms of the drug delivery and ultrasound action remained obscure. The results discussed below shed new light on the important aspects of the micelle, droplet, and ultrasound action.
As shown in Figure 7, DOX deprotonation resulted in the inhibition of DOX trafficking into the cell nucleus. This is an important observation because DOX deprotonation is commonly used for its encapsulation in polymeric micelles 90–94. A decrease in the nuclear accumulation of the deprotonated DOX in comparison with the DOX hydrochloride was presumably related to a decreased DNA affinity to the neutral DOX compared with a positively charged DOX hydrochloride. In addition, the deprotonated DOX molecule is more hydrophobic than DOX hydrochloride, which was expected to promote DOX accumulation in cell membranes. However, we observed DOX accumulation in the nuclear membrane but not in the plasma membrane (Figure 7).
As shown in Figure 8, the uptake of DOX was substantially decreased in the presence of nanodroplets. The experiments performed with fluorescein-labeled PFCE nanodroplets showed no nanodroplet internalization by A2780 cells (data not shown). Therefore the intracellular DOX uptake visualized in Figure 8 was associated with micelles rather than nanodroplets. The differences observed between micellar and nanodroplet formulations require discussion because the nanodroplet formulations comprised 85% PEG-PCL micelles. However, micelle structure and stability is different in the presence or absence of perfluorocarbon. Introduction of perfluorocarbon in micellar solution results in a dissolution of some perfluorocarbon molecules in micelle cores 35. Dissolution of highly hydrophobic compounds makes micelle cores stronger and more stable, which may impair their ability to penetrate through plasma membranes and get internalized 95, 96.
Cell sonication with 3-MHz ultrasound increased both DOX intracellular uptake and nuclear trafficking (Figures 9 and 10). The effect of ultrasound on DOX nuclear trafficking was stronger in the presence of nanodroplets in comparison to micelles. Based on this finding, we re-evaluate the interpretation of the results published in refs.35, 97. In the in vivo experiments with micelle and nanodroplet encapsulated DOX, the dramatic enhancement of the cell fluorescence was observed when tumors were sonicated with 3-MHz ultrasound. As shown by flow cytometry, sonication of the tumors injected systemically with DOX-loaded PFP nanodroplets enhanced cell fluorescence three-fold relative to sonicated tumors injected with DOX-loaded micelles. In addition, tumor growth was effectively inhibited by the combined DOX-loaded nanodroplet/ultrasound treatment. No statistically significant effect on the tumor growth was observed for drug loaded nanodroplets without ultrasound. The strong therapeutic effect of the nanodroplet/ultrasound therapy was interpreted as resulting from the enhanced intracellular DOX uptake, which was confirmed by flow cytometry. No fluorescence imaging was performed in this study. The results shown in Figures 9 and 10 unambiguously confirm that the enhanced tumor cell fluorescence observed in ref. 35 was associated with the enhanced intracellular DOX uptake. Increased fluorescence was observed despite the quenching effect of DOX nuclear trafficking. The results of Figures 9 and 10 also suggest that the differences between the ultrasound effects on the micellar and nanodroplet formulations may be related not only to the enhanced intracellular drug uptake but also to the enhanced DOX nuclear trafficking. Under the action of ultrasound, cavitating microbubbles are formed from nanodroplets in the process of acoustic droplet vaporization 35, 55–57, 98–103. Cavitation of microbubble is known to enhance transport of nanoparticles through plasma membranes. The data presented in Figure 9 show that the transport through nuclear membranes is also enhanced under the ultrasound action. This effect may be more therapeutically important than the enhanced intracellular uptake postulated in refs.35, 97. In addition, the effect of ultrasound on the therapeutic efficacy of nanodroplets may be related to the enhanced nanodroplet diffusion from the extravasation sites throughout the tumor tissue 30. It was shown in the publications by Allen’s group that for PEG-PCL micelles of 60 nm size, the transport from the extravasation sites was substantially restricted 104, 105. The transport will be even more restricted for larger nanoparticles such as nanodroplets (300 nm size). Cavitation of microbubbles formed from the nanodroplets is expected to enhance diffusion of both nanodroplets and extravasated micelles, which will additionally enhance the overall therapeutic effect of DOX-loaded nanoparticles. The evaluation of the relative importance of various factors involved in the ultrasound mediated drug delivery remains to be explored.
Acknowledgments
The work was supported by Grant Number R01EB001033 to NR from the National Institute of Biomedical Imaging and Bioengineering. The content is solely the responsibility of the authors and does not necessarily represent the official views of the National Institute of Biomedical Imaging and Bioengineering or the National Institutes of Health.
List of Abbreviations
- CW
continuous wave
- DOX
doxorubicin
- PEG-PCL
poly(ethylene oxide)-co-polycaprolactone
- PEG-PE
1,2-distearoyl-sn-glycero-3-phosphoethanolamine-N-[methoxy(polyethylene glycol)-2000] (ammonium salt)
- PFCE
Perfluoro-15-crown-5-ether
- PFP
Perfluoropentane
- TEA
Triethylamine
References
- 1.Frederick CA, Williams LD, Ughetto G, van der Marel GA, van Boom JH, Rich A, Wang AH. Structural comparison of anticancer drug-DNA complexes: adriamycin and daunomycin. Biochemistry. 1990;29(10):2538–49. [PubMed] [Google Scholar]
- 2.Cummings J, Smyth JF. DNA topoisomerase I and II as targets for rational design of new anticancer drugs. Ann Oncol. 1993;4(7):533–43. doi: 10.1093/oxfordjournals.annonc.a058584. [DOI] [PubMed] [Google Scholar]
- 3.Fornari FA, Randolph JK, Yalowich JC, Ritke MK, Gewirtz DA. Interference by doxorubicin with DNA unwinding in MCF-7 breast tumor cells. Mol Pharmacol. 1994;45(4):649–56. [PubMed] [Google Scholar]
- 4.Momparler RL, Karon M, Siegel SE, Avila F. Effect of adriamycin on DNA, RNA, and protein synthesis in cell-free systems and intact cells. Cancer Res. 1976;36(8):2891–5. [PubMed] [Google Scholar]
- 5.Aubel-Sadron G, Londos-Gagliardi D. Daunorubicin and doxorubicin, anthracycline antibiotics, a physicochemical and biological review. Biochimie. 1984;66(5):333–52. doi: 10.1016/0300-9084(84)90018-x. [DOI] [PubMed] [Google Scholar]
- 6.Marnett LJ. Oxy radicals, lipid peroxidation and DNA damage. Toxicology. 2002;181–182:219–22. doi: 10.1016/s0300-483x(02)00448-1. [DOI] [PubMed] [Google Scholar]
- 7.Minotti G, Menna P, Salvatorelli E, Cairo G, Gianni L. Anthracyclines: molecular advances and pharmacologic developments in antitumor activity and cardiotoxicity. Pharmacol Rev. 2004;56(2):185–229. doi: 10.1124/pr.56.2.6. [DOI] [PubMed] [Google Scholar]
- 8.Minotti G, Ronchi R, Salvatorelli E, Menna P, Cairo G. Doxorubicin irreversibly inactivates iron regulatory proteins 1 and 2 in cardiomyocytes: evidence for distinct metabolic pathways and implications for iron-mediated cardiotoxicity of antitumor therapy. Cancer Res. 2001;61(23):8422–8. [PubMed] [Google Scholar]
- 9.Minotti G, Licata S, Saponiero A, Menna P, Calafiore AM, Di Giammarco G, Liberi G, Animati F, Cipollone A, Manzini S, Maggi CA. Anthracycline metabolism and toxicity in human myocardium: comparisons between doxorubicin, epirubicin, and a novel disaccharide analogue with a reduced level of formation and [4Fe–4S] reactivity of its secondary alcohol metabolite. Chem Res Toxicol. 2000;13(12):1336–41. doi: 10.1021/tx000143z. [DOI] [PubMed] [Google Scholar]
- 10.Licata S, Saponiero A, Mordente A, Minotti G. Doxorubicin metabolism and toxicity in human myocardium: role of cytoplasmic deglycosidation and carbonyl reduction. Chem Res Toxicol. 2000;13(5):414–20. doi: 10.1021/tx000013q. [DOI] [PubMed] [Google Scholar]
- 11.Chlebowski RT. Adriamycin (doxorubicin) cardiotoxicity: a review. West J Med. 1979;131(5):364–8. [PMC free article] [PubMed] [Google Scholar]
- 12.Maejima Y, Adachi S, Ito H, Hirao K, Isobe M. Induction of premature senescence in cardiomyocytes by doxorubicin as a novel mechanism of myocardial damage. Aging Cell. 2008;7(2):125–36. doi: 10.1111/j.1474-9726.2007.00358.x. [DOI] [PubMed] [Google Scholar]
- 13.Wallace KB. Adriamycin-induced interference with cardiac mitochondrial calcium homeostasis. Cardiovasc Toxicol. 2007;7(2):101–7. doi: 10.1007/s12012-007-0008-2. [DOI] [PubMed] [Google Scholar]
- 14.Berthiaume JM, Wallace KB. Adriamycin–induced oxidative mitochondrial cardiotoxicity. Cell Biol Toxicol. 2007;23(1):15–25. doi: 10.1007/s10565-006-0140-y. [DOI] [PubMed] [Google Scholar]
- 15.Cattel L, Ceruti M, Dosio F. From conventional to stealth liposomes: a new Frontier in cancer chemotherapy. J Chemother. 2004;16(Suppl 4):94–7. doi: 10.1179/joc.2004.16.Supplement-1.94. [DOI] [PubMed] [Google Scholar]
- 16.Gabizon A. Emerging role of liposomal drug carrier systems in cancer chemotherapy. J Liposome Res. 2003;13(1):17–20. doi: 10.1081/lpr-120017484. [DOI] [PubMed] [Google Scholar]
- 17.Gabizon A, Shmeeda H, Barenholz Y. Pharmacokinetics of pegylated liposomal Doxorubicin: review of animal and human studies. Clin Pharmacokinet. 2003;42(5):419–36. doi: 10.2165/00003088-200342050-00002. [DOI] [PubMed] [Google Scholar]
- 18.Orditura M, Quaglia F, Morgillo F, Martinelli E, Lieto E, De Rosa G, Comunale D, Diadema MR, Ciardiello F, Catalano G, De Vita F. Pegylated liposomal doxorubicin: pharmacologic and clinical evidence of potent antitumor activity with reduced anthracycline-induced cardiotoxicity (review) Oncol Rep. 2004;12(3):549–56. [PubMed] [Google Scholar]
- 19.Allen TM, Martin FJ. Advantages of liposomal delivery systems for anthracyclines. Semin Oncol. 2004;31(6 Suppl 13):5–15. doi: 10.1053/j.seminoncol.2004.08.001. [DOI] [PubMed] [Google Scholar]
- 20.Di Paolo A. Liposomal anticancer therapy: pharmacokinetic and clinical aspects. J Chemother. 2004;16(Suppl 4):90–3. doi: 10.1179/joc.2004.16.Supplement-1.90. [DOI] [PubMed] [Google Scholar]
- 21.Plosker GL. Pegylated liposomal Doxorubicin: a review of its use in the treatment of relapsed or refractory multiple myeloma. Drugs. 2008;68(17):2535–51. doi: 10.2165/0003495-200868170-00008. [DOI] [PubMed] [Google Scholar]
- 22.Allen TM, Cheng WW, Hare JI, Laginha KM. Pharmacokinetics and pharmacodynamics of lipidic nano-particles in cancer. Anticancer Agents Med Chem. 2006;6(6):513–23. doi: 10.2174/187152006778699121. [DOI] [PubMed] [Google Scholar]
- 23.Lorusso D, Di Stefano A, Carone V, Fagotti A, Pisconti S, Scambia G. Pegylated liposomal doxorubicin-related palmar-plantar erythrodysesthesia ('hand-foot' syndrome) Ann Oncol. 2007;18(7):1159–64. doi: 10.1093/annonc/mdl477. [DOI] [PubMed] [Google Scholar]
- 24.Adamo V, Lorusso V, Rossello R, Adamo B, Ferraro G, Lorusso D, Condemi G, Priolo D, Di Lullo L, Paglia A, Pisconti S, Scambia G, Ferrandina G. Pegylated liposomal doxorubicin and gemcitabine in the front-line treatment of recurrent/metastatic breast cancer: a multicentre phase II study. Br J Cancer. 2008;98(12):1916–21. doi: 10.1038/sj.bjc.6604409. [DOI] [PMC free article] [PubMed] [Google Scholar]
- 25.von Moos R, Thuerlimann BJ, Aapro M, Rayson D, Harrold K, Sehouli J, Scotte F, Lorusso D, Dummer R, Lacouture ME, Lademann J, Hauschild A. Pegylated liposomal doxorubicin-associated hand–foot syndrome: recommendations of an international panel of experts. Eur J Cancer. 2008;44(6):781–90. doi: 10.1016/j.ejca.2008.01.028. [DOI] [PubMed] [Google Scholar]
- 26.Gillies ER, Frechet JM. Dendrimers and dendritic polymers in drug delivery. Drug Discov Today. 2005;10(1):35–43. doi: 10.1016/S1359-6446(04)03276-3. [DOI] [PubMed] [Google Scholar]
- 27.Liu J, Lee H, Allen C. Formulation of drugs in block copolymer micelles: drug loading and release. Curr Pharm Des. 2006;12(36):4685–701. doi: 10.2174/138161206779026263. [DOI] [PubMed] [Google Scholar]
- 28.Bromberg L. Polymeric micelles in oral chemotherapy. J Control Release. 2008;128(2):99–112. doi: 10.1016/j.jconrel.2008.01.018. [DOI] [PubMed] [Google Scholar]
- 29.Patil RR, Guhagarkar SA, Devarajan PV. Engineered nanocarriers of doxorubicin: a current update. Crit Rev Ther Drug Carrier Syst. 2008;25(1):1–61. doi: 10.1615/critrevtherdrugcarriersyst.v25.i1.10. [DOI] [PubMed] [Google Scholar]
- 30.Gao ZG, Fain HD, Rapoport N. Controlled and targeted tumor chemotherapy by micellar-encapsulated drug and ultrasound. J Control Release. 2005;102(1):203–22. doi: 10.1016/j.jconrel.2004.09.021. [DOI] [PubMed] [Google Scholar]
- 31.Howard B, Gao Z, Lee SW, Seo MH, Rapoport N. Ultrasound-enhanced chemotherapy of drug-resistant breast cancer tumors by micellar-encapsulated paclitaxel. Am J Drug Deliv. 2006;4(2):97–104. [Google Scholar]
- 32.Rapoport N. Combined cancer therapy by micellar-encapsulated drug and ultrasound. In: Amiji M, editor. Nanotechnology for cancer therapy. CRC Press; Boca Raton (FL): 2006. pp. 417–437. [Google Scholar]
- 33.Rapoport N. Physical stimuli-responsive polymeric micelles for anti-cancer drug delivery. Prog Polym Sci. 2007;32:962–990. [Google Scholar]
- 34.Rapoport N, Gao Z, Kamaev P, Christensen D. Ultrasound-enhanced localized chemotherapy of drug-sensitive and multidrug resistant tumors. Am Inst Phys Conf Proc. 2006;829:481–485. [Google Scholar]
- 35.Rapoport N, Gao Z, Kennedy A. Multifunctional nanoparticles for combining ultrasonic tumor imaging and targeted chemotherapy. J Natl Cancer Inst. 2007;99(14):1095–106. doi: 10.1093/jnci/djm043. [DOI] [PubMed] [Google Scholar]
- 36.Rapoport N, Marin A, Christensen DA. Ultrasound-activated micellar drug delivery. Drug Delivery Syst Sci. 2002;2(2):37–46. [Google Scholar]
- 37.Tan ML, Choong PF, Dass CR. Review: doxorubicin delivery systems based on chitosan for cancer therapy. J Pharm Pharmacol. 2009;61(2):131–42. doi: 10.1211/jpp/61.02.0001. [DOI] [PubMed] [Google Scholar]
- 38.Karukstis KK, Thompson EH, Whiles JA, Rosenfeld RJ. Deciphering the fluorescence signature of daunomycin and doxorubicin. Biophys Chem. 1998;73(3):249–63. doi: 10.1016/s0301-4622(98)00150-1. [DOI] [PubMed] [Google Scholar]
- 39.Hovorka O, Šubr V, Vetvicka D, Kovár L, Strohalm J, Strohalm M, Benda A, Hof M, Ulbrich K, Ríhová B. Spectral analysis of doxorubicin accumulation and the indirect quantification of its DNA intercalation. European Journal of Pharmaceutics and Biopharmaceutics. 2010 doi: 10.1016/j.ejpb.2010.07.008. [DOI] [PubMed] [Google Scholar]
- 40.Gao Z, Fain HD, Rapoport N. Ultrasound-enhanced tumor targeting of polymeric micellar drug carriers. Mol Pharm. 2004;1(4):317–30. doi: 10.1021/mp049958h. [DOI] [PMC free article] [PubMed] [Google Scholar]
- 41.Marin A, Muniruzzaman M, Rapoport N. Mechanism of the ultrasonic activation of micellar drug delivery. J Control Release. 2001;75(1–2):69–81. doi: 10.1016/s0168-3659(01)00363-7. [DOI] [PubMed] [Google Scholar]
- 42.Marin A, Muniruzzaman M, Rapoport N. Acoustic activation of drug delivery from polymeric micelles: effect of pulsed ultrasound. J Control Release. 2001;71(3):239–49. doi: 10.1016/s0168-3659(01)00216-4. [DOI] [PubMed] [Google Scholar]
- 43.Marin A, Sun H, Husseini GA, Pitt WG, Christensen DA, Rapoport NY. Drug delivery in pluronic micelles: effect of high-frequency ultrasound on drug release from micelles and intracellular uptake. J Control Release. 2002;84(1–2):39–47. doi: 10.1016/s0168-3659(02)00262-6. [DOI] [PubMed] [Google Scholar]
- 44.Hynynen K. Ultrasound for drug and gene delivery to the brain. Adv Drug Deliv Rev. 2008;60(10):1209–17. doi: 10.1016/j.addr.2008.03.010. [DOI] [PMC free article] [PubMed] [Google Scholar]
- 45.Hynynen K. Macromolecular delivery across the blood-brain barrier. Methods Mol Biol. 2009;480:175–85. doi: 10.1007/978-1-59745-429-2_13. [DOI] [PubMed] [Google Scholar]
- 46.Hynynen K, McDannold N, Vykhodtseva N, Raymond S, Weissleder R, Jolesz FA, Sheikov N. Focal disruption of the blood-brain barrier due to 260-kHz ultrasound bursts: a method for molecular imaging and targeted drug delivery. J Neurosurg. 2006;105(3):445–54. doi: 10.3171/jns.2006.105.3.445. [DOI] [PubMed] [Google Scholar]
- 47.Ferrara K, Pollard R, Borden M. Ultrasound microbubble contrast agents: fundamentals and application to gene and drug delivery. Annu Rev Biomed Eng. 2007;9:415–47. doi: 10.1146/annurev.bioeng.8.061505.095852. [DOI] [PubMed] [Google Scholar]
- 48.Ferrara KW. Driving delivery vehicles with ultrasound. Adv Drug Deliv Rev. 2008;60(10):1097–102. doi: 10.1016/j.addr.2008.03.002. [DOI] [PMC free article] [PubMed] [Google Scholar]
- 49.Holland CK, Apfel RE. Thresholds for transient cavitation produced by pulsed ultrasound in a controlled nuclei environment. J Acoust Soc Am. 1990;88(5):2059–69. doi: 10.1121/1.400102. [DOI] [PubMed] [Google Scholar]
- 50.Datta S, Coussios CC, McAdory LE, Tan J, Porter T, De Courten-Myers G, Holland CK. Correlation of cavitation with ultrasound enhancement of thrombolysis. Ultrasound Med Biol. 2006;32(8):1257–67. doi: 10.1016/j.ultrasmedbio.2006.04.008. [DOI] [PMC free article] [PubMed] [Google Scholar]
- 51.Dayton PA, Zhao S, Bloch SH, Schumann P, Penrose K, Matsunaga TO, Zutshi R, Doinikov A, Ferrara KW. Application of ultrasound to selectively localize nanodroplets for targeted imaging and therapy. Mol Imaging. 2006;5(3):160–74. [PMC free article] [PubMed] [Google Scholar]
- 52.Shen YY, Gao ZG, Rapoport N. [Recent advances in the applications of ultrasonic microbubbles as gene or drug vectors] Yao Xue Xue Bao. 2009;44(9):961–6. [PubMed] [Google Scholar]
- 53.Unger EC, Hersh E, Vannan M, McCreery T. Gene delivery using ultrasound contrast agents. Echocardiography. 2001;18(4):355–61. doi: 10.1046/j.1540-8175.2001.00355.x. [DOI] [PubMed] [Google Scholar]
- 54.Unger EC, Porter T, Culp W, Labell R, Matsunaga T, Zutshi R. Therapeutic applications of lipid-coated microbubbles. Adv Drug Deliv Rev. 2004;56(9):1291–314. doi: 10.1016/j.addr.2003.12.006. [DOI] [PubMed] [Google Scholar]
- 55.Rapoport NY, Efros AL, Christensen DA, Kennedy AM, Nam KH. Microbubble generation in phase-shift nanoemulsions used as anticancer drug carriers. Bub Sci Eng Tech. 2009;1(1–2):31–39. doi: 10.1179/175889709X446516. [DOI] [PMC free article] [PubMed] [Google Scholar]
- 56.Rapoport NY, Kennedy AM, Shea JE, Scaife CL, Nam KH. Controlled and targeted tumor chemotherapy by ultrasound-activated nanoemulsions/microbubbles. J Control Release. 2009;138(3):268–76. doi: 10.1016/j.jconrel.2009.05.026. [DOI] [PMC free article] [PubMed] [Google Scholar]
- 57.Rapoport N, Christensen DA, Kennedy AM, Nam KH. Cavitation properties of block copolymer stabilized phase–shift nanoemulsions used as drug carriers. Ultrasound Med Biol. 2010;36(3):419–29. doi: 10.1016/j.ultrasmedbio.2009.11.009. [DOI] [PMC free article] [PubMed] [Google Scholar]
- 58.Rapoport N, Kennedy AM, Shea JE, Scaife CL, Nam KH. Ultrasonic nanotherapy of pancreatic cancer: lessons from ultrasound imaging. Mol Pharm. 2010;7(1):22–31. doi: 10.1021/mp900128x. [DOI] [PMC free article] [PubMed] [Google Scholar]
- 59.Abramoff MD, Magelhaes PJ, Ram SJ. {Image processing with ImageJ} Biophotonics Int. 2004;11(7):36–42. [Google Scholar]
- 60.Rapoport N, Pitina L. Intracellular distribution and intracellular dynamics of a spin-labeled analogue of doxorubicin fluorescence and EPR spectroscopy. J Pharm Sci. 1998;87(3):321–5. doi: 10.1021/js970271g. [DOI] [PubMed] [Google Scholar]
- 61.Rapoport NY, Herron JN, Pitt WG, Pitina L. Micellar delivery of doxorubicin and its paramagnetic analog, ruboxyl, to HL-60 cells: effect of micelle structure and ultrasound on the intracellular drug uptake. J Control Release. 1999;58(2):153–62. doi: 10.1016/s0168-3659(98)00149-7. [DOI] [PubMed] [Google Scholar]
- 62.Husseini GA, Myrup GD, Pitt WG, Christensen DA, Rapoport NY. Factors affecting acoustically triggered release of drugs from polymeric micelles. J Control Release. 2000;69(1):43–52. doi: 10.1016/s0168-3659(00)00278-9. [DOI] [PubMed] [Google Scholar]
- 63.Zunino F, Di Marco A, Zaccara A, Gambetta RA. The interaction of daunorubicin and doxorubicin with DNA and chromatin. Biochim Biophys Acta. 1980;607(2):206–14. doi: 10.1016/0005-2787(80)90073-8. [DOI] [PubMed] [Google Scholar]
- 64.Kabanov AV, Batrakova EV, Miller DW. Pluronic block copolymers as modulators of drug efflux transporter activity in the blood-brain barrier. Adv Drug Deliv Rev. 2003;55(1):151–64. doi: 10.1016/s0169-409x(02)00176-x. [DOI] [PubMed] [Google Scholar]
- 65.Batrakova EV, Miller DW, Li S, Alakhov VY, Kabanov AV, Elmquist WF. Pluronic P85 enhances the delivery of digoxin to the brain: in vitro and in vivo studies. J Pharmacol Exp Ther. 2001;296(2):551–7. [PubMed] [Google Scholar]
- 66.Batrakova EV, Li S, Miller DW, Kabanov AV. Pluronic P85 increases permeability of a broad spectrum of drugs in polarized BBMEC and Caco-2 cell monolayers. Pharm Res. 1999;16(9):1366–72. doi: 10.1023/a:1018990706838. [DOI] [PubMed] [Google Scholar]
- 67.Rapoport N. Factors affecting ultrasound interactions with polymeric micelles and viable cells. In: Swenson S, editor. Carrier-based drug delivery. ACS Symposium Series; Washington (DC): 2004. pp. 161–173. [Google Scholar]
- 68.Rapoport N, Marin A, Luo Y, Prestwich GD, Muniruzzaman MD. Intracellular uptake and trafficking of Pluronic micelles in drug-sensitive and MDR cells: effect on the intracellular drug localization. J Pharm Sci. 2002;91(1):157–70. doi: 10.1002/jps.10006. [DOI] [PubMed] [Google Scholar]
- 69.Kwon GS, Yokoyama M, Okano T, Sakurai Y, Kataoka K. Biodistribution of micelle-forming polymer-drug conjugates. Pharm Res. 1993;10(7):970–4. doi: 10.1023/a:1018998203127. [DOI] [PubMed] [Google Scholar]
- 70.Kwon GS, Okano T. Soluble self-assembled block copolymers for drug delivery. Pharm Res. 1999;16(5):597–600. doi: 10.1023/a:1011991617857. [DOI] [PubMed] [Google Scholar]
- 71.Kataoka K, Matsumoto T, Yokoyama M, Okano T, Sakurai Y, Fukushima S, Okamoto K, Kwon GS. Doxorubicin-loaded poly(ethylene glycol)-poly(beta-benzyl-L-aspartate) copolymer micelles: their pharmaceutical characteristics and biological significance. J Control Release. 2000;64(1–3):143–53. doi: 10.1016/s0168-3659(99)00133-9. [DOI] [PubMed] [Google Scholar]
- 72.Nakanishi T, Fukushima S, Okamoto K, Suzuki M, Matsumura Y, Yokoyama M, Okano T, Sakurai Y, Kataoka K. Development of the polymer micelle carrier system for doxorubicin. J Control Release. 2001;74(1–3):295–302. doi: 10.1016/s0168-3659(01)00341-8. [DOI] [PubMed] [Google Scholar]
- 73.Yokoyama M, Fukushima S, Uehara R, Okamoto K, Kataoka K, Sakurai Y, Okano T. Characterization of physical entrapment and chemical conjugation of adriamycin in polymeric micelles and their design for in vivo delivery to a solid tumor. J Control Release. 1998;50(1–3):79–92. doi: 10.1016/s0168-3659(97)00115-6. [DOI] [PubMed] [Google Scholar]
- 74.Alakhova DY, Rapoport NY, Batrakova EV, Timoshin AA, Li S, Nicholls D, Alakhov VY, Kabanov AV. Differential metabolic responses to pluronic in MDR and non-MDR cells: a novel pathway for chemosensitization of drug resistant cancers. J Control Release. 2010;142(1):89–100. doi: 10.1016/j.jconrel.2009.09.026. [DOI] [PMC free article] [PubMed] [Google Scholar]
- 75.Batrakova E, Lee S, Li S, Venne A, Alakhov V, Kabanov A. Fundamental relationships between the composition of pluronic block copolymers and their hypersensitization effect in MDR cancer cells. Pharm Res. 1999;16(9):1373–9. doi: 10.1023/a:1018942823676. [DOI] [PubMed] [Google Scholar]
- 76.Batrakova EV, Dorodnych TY, Klinskii EY, Kliushnenkova EN, Shemchukova OB, Goncharova ON, Arjakov SA, Alakhov VY, Kabanov AV. Anthracycline antibiotics non-covalently incorporated into the block copolymer micelles: in vivo evaluation of anti-cancer activity. Br J Cancer. 1996;74(10):1545–52. doi: 10.1038/bjc.1996.587. [DOI] [PMC free article] [PubMed] [Google Scholar]
- 77.Batrakova EV, Kabanov AV. Pluronic block copolymers: evolution of drug delivery concept from inert nanocarriers to biological response modifiers. J Control Release. 2008;130(2):98–106. doi: 10.1016/j.jconrel.2008.04.013. [DOI] [PMC free article] [PubMed] [Google Scholar]
- 78.Batrakova EV, Li S, Li Y, Alakhov VY, Elmquist WF, Kabanov AV. Distribution kinetics of a micelle-forming block copolymer Pluronic P85. J Control Release. 2004;100(3):389–97. doi: 10.1016/j.jconrel.2004.09.002. [DOI] [PubMed] [Google Scholar]
- 79.Kabanov AV, Alakhov VY. Pluronic block copolymers in drug delivery: from micellar nanocontainers to biological response modifiers. Crit Rev Ther Drug Carrier Syst. 2002;19(1):1–72. doi: 10.1615/critrevtherdrugcarriersyst.v19.i1.10. [DOI] [PubMed] [Google Scholar]
- 80.Kabanov AV, Batrakova EV. New technologies for drug delivery across the blood brain barrier. Curr Pharm Des. 2004;10(12):1355–63. doi: 10.2174/1381612043384826. [DOI] [PMC free article] [PubMed] [Google Scholar]
- 81.Kabanov AV, Batrakova EV, Alakhov VY. Pluronic block copolymers for overcoming drug resistance in cancer. Adv Drug Deliv Rev. 2002;54(5):759–79. doi: 10.1016/s0169-409x(02)00047-9. [DOI] [PubMed] [Google Scholar]
- 82.Vinogradov SV, Batrakova EV, Li S, Kabanov AV. Mixed polymer micelles of amphiphilic and cationic copolymers for delivery of antisense oligonucleotides. J Drug Target. 2004;12(8):517–26. doi: 10.1080/10611860400011927. [DOI] [PubMed] [Google Scholar]
- 83.Alakhov V, Klinski E, Li S, Pietrzynski G, Venne A, Batrakova E, Bronitch T, Kabanov A. Block copolymer-based formulation of doxorubicin. From cell screen to clinical trials. Colloids and Surfaces B: Biointerfaces. 1999;16:113–134. [Google Scholar]
- 84.Matsumura Y, Kataoka K. Preclinical and clinical studies of anticancer agent-incorporating polymer micelles. Cancer Sci. 2009;100(4):572–9. doi: 10.1111/j.1349-7006.2009.01103.x. [DOI] [PMC free article] [PubMed] [Google Scholar]
- 85.Gupta B, Levchenko TS, Torchilin VP. Intracellular delivery of large molecules and small particles by cell-penetrating proteins and peptides. Adv Drug Deliv Rev. 2005;57(4):637–51. doi: 10.1016/j.addr.2004.10.007. [DOI] [PubMed] [Google Scholar]
- 86.Deshayes S, Morris MC, Divita G, Heitz F. Cell-penetrating peptides: tools for intracellular delivery of therapeutics. Cell Mol Life Sci. 2005;62(16):1839–49. doi: 10.1007/s00018-005-5109-0. [DOI] [PMC free article] [PubMed] [Google Scholar]
- 87.Byrne JD, Betancourt T, Brannon-Peppas L. Active targeting schemes for nanoparticle systems in cancer therapeutics. Adv Drug Deliv Rev. 2008;60(15):1615–26. doi: 10.1016/j.addr.2008.08.005. [DOI] [PubMed] [Google Scholar]
- 88.Kopecek J, Kopeckova P. HPMA copolymers: origins, early developments, present, and future. Adv Drug Deliv Rev. 2010;62(2):122–49. doi: 10.1016/j.addr.2009.10.004. [DOI] [PMC free article] [PubMed] [Google Scholar]
- 89.Gillies ER, Frechet JM. pH-Responsive copolymer assemblies for controlled release of doxorubicin. Bioconjug Chem. 2005;16(2):361–8. doi: 10.1021/bc049851c. [DOI] [PubMed] [Google Scholar]
- 90.Gao ZG, Lee DH, Kim DI, Bae YH. Doxorubicin loaded pH-sensitive micelle targeting acidic extracellular pH of human ovarian A2780 tumor in mice. J Drug Target. 2005;13(7):391–7. doi: 10.1080/10611860500376741. [DOI] [PMC free article] [PubMed] [Google Scholar]
- 91.Lee ES, Na K, Bae YH. Doxorubicin loaded pH-sensitive polymeric micelles for reversal of resistant MCF-7 tumor. J Control Release. 2005;103(2):405–18. doi: 10.1016/j.jconrel.2004.12.018. [DOI] [PubMed] [Google Scholar]
- 92.Bae Y, Fukushima S, Harada A, Kataoka K. Design of environment-sensitive supramolecular assemblies for intracellular drug delivery: polymeric micelles that are responsive to intracellular pH change. Angew Chem Int Ed Engl. 2003;42(38):4640–3. doi: 10.1002/anie.200250653. [DOI] [PubMed] [Google Scholar]
- 93.Lee ES, Na K, Bae YH. Polymeric micelle for tumor pH and folate-mediated targeting. J Control Release. 2003;91(1–2):103–13. doi: 10.1016/s0168-3659(03)00239-6. [DOI] [PubMed] [Google Scholar]
- 94.Shuai X, Ai H, Nasongkla N, Kim S, Gao J. Micellar carriers based on block copolymers of poly(epsilon-caprolactone) and poly(ethylene glycol) for doxorubicin delivery. J Control Release. 2004;98(3):415–26. doi: 10.1016/j.jconrel.2004.06.003. [DOI] [PubMed] [Google Scholar]
- 95.Rapoport N. Stabilization and activation of Pluronic micelles for tumor-targeted drug delivery. Colloids and Surfaces B: Biointerfaces. 1999;16:93–111. [Google Scholar]
- 96.Muniruzzaman M, Marin A, Luo Y, Prestwich GD, Pitt WG, Husseini G, Rapoport NY. Intracellular uptake of Pluronic copolymer: effects of the aggregation state. Colloids and Surfaces B: Biointerfaces. 2002;25(3):233–241. [Google Scholar]
- 97.Gao Z, Kennedy AM, Christensen DA, Rapoport NY. Drug-loaded nano/microbubbles for combining ultrasonography and targeted chemotherapy. Ultrasonics. 2008;48(4):260–70. doi: 10.1016/j.ultras.2007.11.002. [DOI] [PMC free article] [PubMed] [Google Scholar]
- 98.Fabiilli ML, Haworth KJ, Fakhri NH, Kripfgans OD, Carson PL, Fowlkes JB. The role of inertial cavitation in acoustic droplet vaporization. IEEE Trans Ultrason Ferroelectr Freq Control. 2009;56(5):1006–17. doi: 10.1109/TUFFC.2009.1132. [DOI] [PMC free article] [PubMed] [Google Scholar]
- 99.Lo AH, Kripfgans OD, Carson PL, Rothman ED, Fowlkes JB. Acoustic droplet vaporization threshold: effects of pulse duration and contrast agent. IEEE Trans Ultrason Ferroelectr Freq Control. 2007;54(5):933–46. doi: 10.1109/tuffc.2007.339. [DOI] [PubMed] [Google Scholar]
- 100.Kripfgans OD, Orifici CM, Carson PL, Ives KA, Eldevik OP, Fowlkes JB. Acoustic droplet vaporization for temporal and spatial control of tissue occlusion: a kidney study. IEEE Trans Ultrason Ferroelectr Freq Control. 2005;52(7):1101–10. doi: 10.1109/tuffc.2005.1503996. [DOI] [PubMed] [Google Scholar]
- 101.Kripfgans OD, Fabiilli ML, Carson PL, Fowlkes JB. On the acoustic vaporization of micrometer-sized droplets. J Acoust Soc Am. 2004;116(1):272–81. doi: 10.1121/1.1755236. [DOI] [PubMed] [Google Scholar]
- 102.Kripfgans OD, Fowlkes JB, Woydt M, Eldevik OP, Carson PL. In vivo droplet vaporization for occlusion therapy and phase aberration correction. IEEE Trans Ultrason Ferroelectr Freq Control. 2002;49(6):726–38. doi: 10.1109/tuffc.2002.1009331. [DOI] [PubMed] [Google Scholar]
- 103.Kripfgans OD, Fowlkes JB, Miller DL, Eldevik OP, Carson PL. Acoustic droplet vaporization for therapeutic and diagnostic applications. Ultrasound Med Biol. 2000;26(7):1177–89. doi: 10.1016/s0301-5629(00)00262-3. [DOI] [PubMed] [Google Scholar]
- 104.Lee H, Fonge H, Hoang B, Reilly RM, Allen C. The effects of particle size and molecular targeting on the intratumoral and subcellular distribution of polymeric nanoparticles. Mol Pharm. 2010;7(4):1195–208. doi: 10.1021/mp100038h. [DOI] [PubMed] [Google Scholar]
- 105.Lee H, Hoang B, Fonge H, Reilly RM, Allen C. In Vivo Distribution of Polymeric Nanoparticles at the Whole-Body, Tumor, and Cellular Levels. Pharm Res. 2010 doi: 10.1007/s11095-010-0068-z. [DOI] [PubMed] [Google Scholar]