Abstract
This study examines patterns of neural activity in response to single biphasic electrical pulses, presented alone or following a forward masking pulse train, delivered by a cochlear implant. Recordings were made along the tonotopic axis of the central nucleus of the inferior colliculus (ICC) in ketamine/xylazine anesthetized guinea pigs. The partial tripolar electrode configuration was used, which provided a systematic way to vary the tonotopic extent of ICC activation between monopolar (broad) and tripolar (narrow) extremes while maintaining the same peak of activation. The forward masking paradigm consisted of a 200-ms masker pulse train (1017 pulses per second) followed 10 ms later by a single-pulse probe stimulus; the current fraction of the probe was set to 0 (monopolar), 1 (tripolar), or 0.5 (hybrid), and the fraction of the masker was fixed at 0.5. Forward masking tuning profiles were derived from the amount of masking current required to just suppress the activity produced by a fixed-level probe. These profiles were sharper for more focused probe configurations, approximating the pattern of neural activity elicited by single (non-masked) pulses. The result helps to bridge the gap between previous findings in animals and recent psychophysical data.
Keywords: cochlear implants, guinea pig, electrophysiology, partial-tripolar electrode configuration, forward masking, inferior colliculus
Introduction
The success of cochlear implant listeners in recognizing speech and other environmental sounds relies on the efficacy of transmission of both temporal and spectral information through the 12 to 22 scala-tympani electrodes typically implanted in clinical devices. The quality of spectral information, as encoded by the spatial pattern of currents delivered across the array of electrodes, is especially critical to the discrimination of vowels (e.g., Nie et al., 2006) and the perception of speech in background noise (e.g., Fu and Nogaki, 2005) by implant listeners. In principle, spectral acuity can be improved by minimizing the spread of current generated by each electrode channel. For instance, the monopolar, bipolar, and tripolar electrode configurations produce successively more focused electrical fields (e.g., Kral et al., 1999). A limitation of the use of focused configurations, however, is that highly focused configurations demand a high current level to cover a full dynamic range of stimulation (e.g., Mens and Berenstein, 2005). Partial tripolar (pTP) is a novel electrode configuration that has recently been implemented experimentally in clinical sound processing strategies (Mens and Berenstein, 2005; Berenstein et al., 2008). pTP is a hybrid between the monopolar and tripolar configurations that allows for systematic variation of electrical field size while maintaining a constant peak location of activation centered at the active electrode. Implementation of this configuration might allow for better spectral acuity while maintaining an acceptable operating range of current levels. The goal of the present study is to evaluate how variation of the electrical field size using the pTP configuration affects the tonotopic spread of neural activity in the central auditory system.
Physiological data in animals and computer models demonstrate dramatic effects of electrode configuration on the presumed longitudinal extent of cochlear excitation in response to single biphasic pulses (Kral et al., 1998; Bierer & Middlebrooks, 2002; Snyder et al., 2004, 2008; Bonham & Litvak, 2008; Goldwyn et al., In press). The spread of cochlear excitation is reflected in the spread of activation along the tonotopic axis of central auditory structures. Studies of the central nucleus of the inferior colliculus (ICC) (Rebscher et al., 2001; Snyder et al., 2004; 2008; Bonham and Litvak, 2008) and the primary auditory cortex (Raggio and Schreiner, 1999; Bierer and Middlebrooks, 2002; Middlebrooks and Bierer, 2002) have consistently demonstrated that the spread of activation is more restricted when a more focused electrode configuration is applied.
Unlike the physiological findings, the available psychophysical data have not shown consistent effects of electrode configuration on spectral acuity. In acoustic and electric hearing, forward masking experiments have been used to evaluate the spectral/spatial selectivity of individual listeners and identify potential irregularities in cochlear activation (acoustic: e.g. Moore et al., 2000; electric: e.g. Bierer and Faulkner, 2010). Cochlear implant studies employing relatively high-level stimuli have not observed significant differences in the spatial selectivity among tested configurations (Chatterjee et al., 2006; Kwon & van den Honert, 2006; Cohen et al., 2001; Boex et al., 2003). Two studies that used relatively low current-level stimuli, however, observed modest but significantly broader spatial selectivity for the monopolar configuration than either bipolar (Nelson et al., 2008) or partial tripolar (Bierer & Faulkner, 2010) configurations. The overall greater excitation of auditory neurons in the former studies may have obscured subtle differences in the spread of excitation across configurations, though other differences in methodology cannot be ruled out. Another potential factor contributing to differences across psychophysical masking studies relates to the increase of spread of activation with current level. If equal loudness of two stimuli is solely determined by the extent of activation along the cochlea, then it’s possible that a narrow configuration can result in the same activation spread as a broad configuration because of the higher current required to achieve equal loudness. However, the study by Nelson et al (2008) is not consistent with this theory. They found that higher stimulus levels typically did not result in broader tuning curves for the same configuration. A recent computational model by Goldwyn and colleagues suggests a plausible mechanism for this finding: by assuming that loudness grows with the number of activated neurons (rather than the extent of activated cochlea), focused configurations remained relatively narrow over their entire dynamic range (Goldwyn et al., In press).
In addition to differing methodologies, several patient-specific factors are difficult to control; including the location of the cochlear implant electrodes (e.g., Skinner et al., 2007; Finely et al., 2008; Kos et al., 2007), patient pathology and etiology of hearing loss (Hinajosa and Marion, 1983; Nadol et al., 2001) and bone and tissue growth around the cochlear implant (Hanekom 2005; Li et al., 2007), all of which might influence the effective distance between the electrical contacts and the responsive spiral ganglion neurons. Animal studies offer greater control over several of these sources of variability. For instance, with the deafening procedures used in animal studies, the loss of hair cells presumably is relatively consistent across subjects. Also, with the acute implantation techniques used in many physiological studies, there is no time for bone and tissue growth or for spiral ganglion cell loss to occur.
The discrepancy in the results between animal physiological and human psychophysical studies also might reflect a difference in the stimuli that were employed; specifically, single pulses in the physiological studies versus masker and probe pulse trains in the psychophysical forward masking studies. Indeed, preliminary physiological evidence suggests a more modest effect of electrode configuration in the tonic response to an extended pulse train compared to its spatially broader onset response (Schoenneker et al., 2009). This recent finding suggests that the set of stimuli tested can strongly influence the measured effects of electrode configuration. Another difference between the two sets of studies is the response measure: spike activity of small neural populations in the animal studies and perceptual detection in the human studies.
We tested in an animal model the hypotheses that the tonotopic spread of activation varies systematically with partial tripolar fraction and that the spread of activation is paralleled by the tonotopic spread of forward masking. Recordings at 16 sites along the tonotopic axis of the ICC in anesthetized guinea pigs provided a measure of thresholds and spread of activation. Spread of activation was also evaluated using a physiological forward-masking paradigm. The comparison of neural activation patterns to both forward masked and non-masked electrical pulses in the same animals provide a bridge from the descriptive studies of activity patterns measured in animal subjects to the forward masking patterns measured in human subjects.
Methods
Stimulus presentation and data acquisition
All experiments were conducted with the approval of the University of Washington Institutional Animal Care and Use Committee. Results presented here were obtained from 6 ketamine/xylazine anesthetized guinea pigs. The procedures for anesthesia, surgery, and unit recording were similar to those described previously (Snyder et al., 2004). Briefly, the right ear in each animal was deafened by disarticulation of the middle-ear ossicles. The right inferior colliculus was exposed by aspiration of overlying cortical tissue. A multi-site silicon-substrate recording probe (NeuroNexus Technologies, Ann Arbor, MI) was oriented in the coronal plane and 45° from the sagittal plane and inserted through the central nucleus of the inferior colliculus (ICC), aligned with the tonotopic axis. The probe had 16 recording sites spaced at 100-μm intervals along a single shank. Acoustic tones were presented from a calibrated loudspeaker positioned 10 cm from the animal’s left ear. The frequency tuning of ICC responses to tones was used to adjust the placement of the recording probe to sample ICC sites with characteristic frequencies (CFs) spanning 4 to 40 kHz (in 4 cases) or 2 to 32 kHz (in 2 cases). The number of recording sites showing reliable stimulus-driven activity varied from 12 to 15 among the 6 animals (total of 83 sites).
After the recording probe was fixed in place, the CF at each site was tested a final time. Then, the left cochlea was deafened by withdrawing perilymph from the basal half of the basal turn and replacing it with a 10% solution of neomycin sulfate, waiting a few minutes, and then repeating that procedure. In pilot studies, that procedure eliminated all auditory responses across the >80-dB range of sound levels available from our audio system. An 8-electrode banded cochlear implant was inserted through a cochleostomy placed near the round window and fixed in place. Data collection proceeded using electrical cochlear stimulation.
The cochlear implant was an 8-electrode animal version of the clinical Nucleus-22 banded electrode array (Cochlear Americas, Englewood, CO, USA); typically, only 5 or 6 bands could be inserted in the scala tympani of the guinea-pig cochlea. Intrascalar electrodes were numbered increasing from base to apex, with electrode 8 being the most apical. The bands were 450 microns in diameter, 300 microns wide, and with a center-to-center spacing of 750 microns. Electrical stimuli were generated by a custom 8-channel constant-current source controlled by a multichannel D/A converter (RX8, Tucker-Davis Technologies; Alachua, FL, USA); currents of each active and return electrode were controlled independently. Stimuli were single biphasic pulses and pulse trains presented in a forward masking paradigm. All pulses were biphasic, charge-balanced, and initially cathodic, with a phase duration of 205 μsec/phase and no interphase gap. Electrode configurations included monopolar (MP), tripolar(TP), and partial tripolar (pTP). In the monopolar configuration, the active electrode was one of the scala tympani banded electrodes and the return electrode was a distant ground consisting of a wire in a neck muscle. In the tripolar configuration, the active electrode was an intrascalar band, and the return current was divided equally between the two adjacent bands; the channel number was that of the active electrode. The pTP configuration was a hybrid between MP and TP such that a fraction of the return current (represented by δ) was divided evenly between the two flanking electrodes, and the balance of the return current passed through the distant ground. For instance, δ = 0.5 indicates that one fourth of the return passed through each of the flanking intrascalar electrodes and one half passed through the distant ground. Using this terminology, a fraction of δ= 0 is equivalent to MP and δ = 1 to TP. For the present study, single pulse stimuli were presented with δ = 0, 0.5, 0.6, 0.7, 0.8, 0.9, and 1. The masker for the forward-masking pulse train was fixed at a partial tripolar fraction of δ = 0.5, and the probe pulse configuration was δ = 0, 0.5, or 1. The forward masking stimulus consisted of a 200-ms masker pulse train followed by a single-pulse probe. The masker pulse rate was 1017 pulses per second. The time between the masker offset and the probe pulse was 10 ms.
Extracellular spike activity in the ICC was recorded simultaneously from the 16 recording sites, monitored on line, and stored on computer disk. All data analysis was based on spikes detected by off-line analysis of the stored data (Middlebrooks, 2004). The term “unit activity” is used to indicate both single units and unresolved activity from two or more units. The order of testing of various conditions was varied among animals to avoid bias that might have resulted from drift in the characteristics of unit isolation at the various recording sites.
An artifact from the electrical stimulus could be detected at the ICC recording sites. Artifact during the masker pulse trains was eliminated on-line using a comb filter that introduced spectral nulls at integer multiples of 1017 Hz. Artifact due to single probe pulses was separated from evoked ICC activity by the >4-ms travel time through the auditory pathway and was simply excluded from the analysis time window.
Data analysis
Thresholds for detection of ICC activation in various masked and non-masked conditions were determined using a signal detection procedure based on ICC spike counts (Green and Swets, 1966; Macmillan and Creelman, 2005; Middlebrooks and Snyder, 2007). Briefly, for each stimulus configuration, a receiver-operating characteristic (ROC) curve was formed from the trial-by-trial distributions of spikes recorded in “signal” and “background” conditions. In non-masked conditions, the signal condition consisted of the single probe pulse, and the background condition consisted of just spontaneous activity. In masked conditions, the signal condition consisted of the probe plus the masker, and the stimulus for the background condition consistent of the masker alone. The area under the ROC curve yielded the proportion of trials in which presence of the signal was detected correctly. That proportion correct was converted to a standard deviate (z-score) and multiplied by √2 to give the discrimination index (d′). Detection threshold was taken as the interpolated stimulus level at which d′ = 1. In some instances, the offset of the masker was followed by a burst of spikes (an offset response) that fell at approximately the same time as the response to the probe signal. Detection of the probe in the possible presence of such an offset response was made possible by using the response to the masker-alone condition (including any offset response) as the background for evaluation of the spike rate in the probe-plus-masker condition.
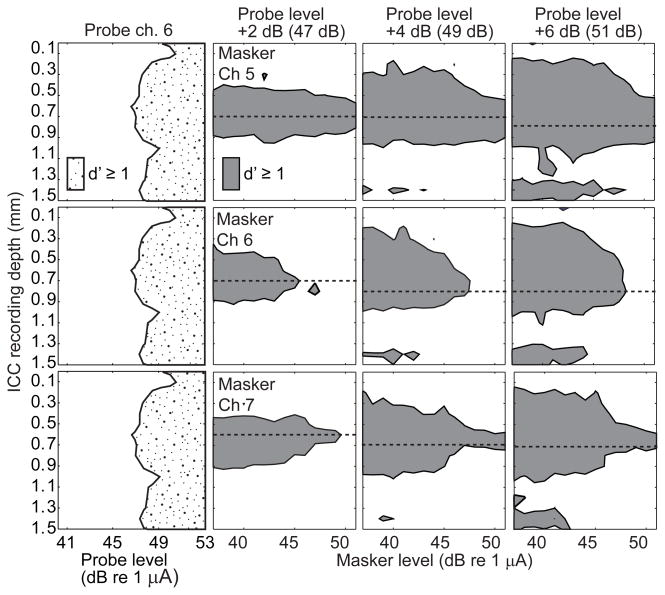
The spread of activation along the tonotopic axis of the ICC was represented by “spatial tuning curves” (STCs), which plot contours of d′ = 1 as a function of the depth along the recording probe (vertical axis) and stimulus current level (horizontal axis); current levels were tested in 1-dB steps. In such STCs, current levels to the left of the contour are below threshold and levels to the right are above threshold. Masking STCs (as in Figs. 6 and 7) plotted the masker levels needed to mask a fixed-level probe. In such plots, the vertical axis, again, plots depth along the recording array, and the horizontal axis plots masker level. The shaded areas indicate masker levels at which the probe was above threshold, and areas to the right of the contour line indicate masker levels at which the probe was masked below a criterion of d′ = 1.
Figure 6.
Forward masking spatial tuning curves with a tripolar probe. The left column of panels shows the neural response to the probe stimulus alone, with recording depth (ordinate) as a function of increasing probe level (abscissa). The remaining panels each show the neural response to the probe as a function of masker levels. The shaded area represents the range of ICC depths at which there was a detectable response to the probe across a range of masker levels at a criterion of d′=1. Areas to the right of the shaded area at each depth correspond to masker levels at which the probe was masked to below detectability. For all conditions the masker tripolar fraction was fixed at 0.5 and the probe had a tripolar fraction of one and was presented on channel 6. Within a column of panels the probe level is fixed as indicated at the top of each column. Within a row of panels the masker channel is fixed as indicated in the left panels. The horizontal dashed line in each panel indicates the recording site that was most sensitive to the masker and was used to calculate the forward masked profiles. Data are from GP5.
Figure 7.
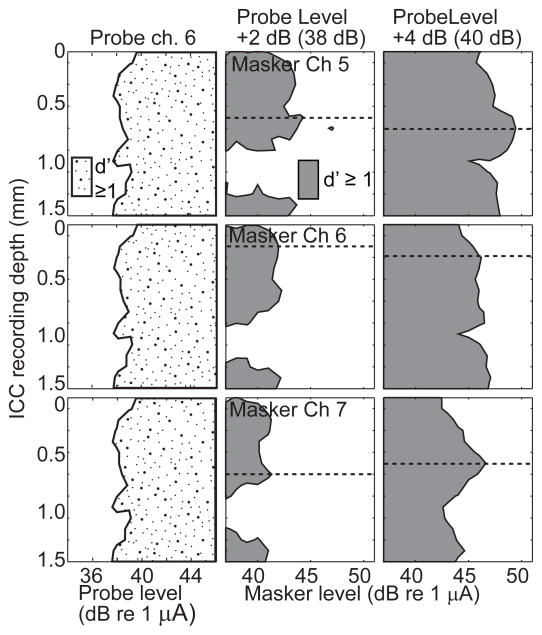
Forward masking spatial tuning curves with a monopolar probe. Conventions as in Fig. 6.
Results
Single-pulse stimulation
The spread of activation along the tonotopic axis of the ICC varied systematically with variation in partial tripolar fraction. Higher partial tripolar fractions are predicted to produce more restricted cochlear excitation and, as expected, the spread of activation in the ICC tended to narrow with increasing tripolar fraction. Examples from one animal are shown in Figure 1. In each panel, thresholds are plotted as a STC (described in METHODS), which shows a contour of threshold as a function of depth along the recording probe. Each panel shows a STC for a single tripolar fraction, with fractions increasing in panels from left to right. Increases in tripolar fraction resulted in decreasing spread of activation along the tonotopic axis and increasing threshold.
Figure 1.
Single-pulse spatial tuning curves. Each panel shows the distribution of neural activity along 16 recording sites in the inferior colliculus (ordinate) elicited by a single, biphasic pulse as a function of stimulus current level (abscissa) in decibels relative to 1 μA. The contour represents a cumulative discrimination index (d′) of at least one. The stippled area represents the range of ICC depths at which the neural response produced activity distinguishable from background with a criteria of d′=1; the right-most extent of each stippled area ends abruptly at the highest current level that was tested. Each panel shows the response to a single pulse with partial tripolar fraction that varied from 0 (left) to 1 (right) as indicated in the lower left corner of each panel. Responses are from cochlear implant channel 6 in GP3.
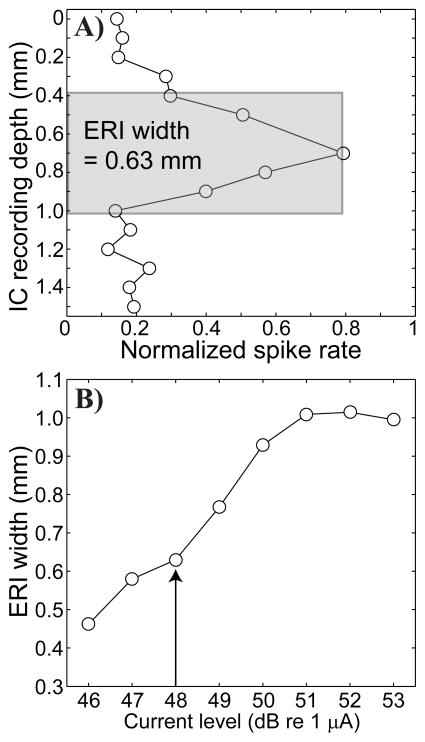
The trends of threshold and spread of activation were consistent across guinea pigs. Spread of activation along the ICC tonotopic axis was quantified as follows. The normalized spike rate at each recording site was based on the distribution of spike rates recorded at that site across all stimulus levels, from no stimulus to saturation. Spontaneous and maximum rates at each site were represented by the 5th and by the 95th percentiles of the rate distributions, respectively. The normalized rate at any stimulus level was the spike rate minus the spontaneous rate divided by the maximum rate minus the spontaneous rate. As in our previous studies, we normalized in this manner to emphasize the stimulus-driven response rather than the absolute spike activity, for which a variable number of neurons may contribute to the responses at each recording site (Arenberg et al., 2000; Bierer and Middlebrooks, 2002). An example of how the spread of activation at a given stimulus level was computed is shown in Figure 2A. An ICC image of the stimulus plots response magnitude, normalized as described, versus ICC depth. The area under the ICC image was computed and divided by the maximum magnitude to give the width of the equivalent rectangular image (ERI), shown as a grey rectangle. An example of the ERI width (ordinate) obtained for each stimulus level (abscissa) is shown in Figure 2B. The vertical arrow indicates the 2-dB-above-threshold level that was used for ERI calculations for all animals, configurations and channels presented subsequently.
Figure 2.
Single-pulse ICC image and equivalent rectangular (ERI) widths. A) This panel shows the distribution of normalized spike activity (abscissa) as a function recording depth in the ICC (ordinate). Data are from cochlear implant channel 6, using a stimulus level of 2 dB above threshold with a partial tripolar fraction of 1.0 in GP5. The grey shading indicates the equivalent rectangular image (ERI): a rectangle that is equivalent to the area under the image curve with the same height as the curve. The width of the ERI, 0.63 mm in this case, provides a measure of spread of activation. B) This panel shows ERI width (ordinate in mm) as a function of stimulus current level (dB re 1 μA). The vertical arrow indicates the ERI for 2 dB above threshold.
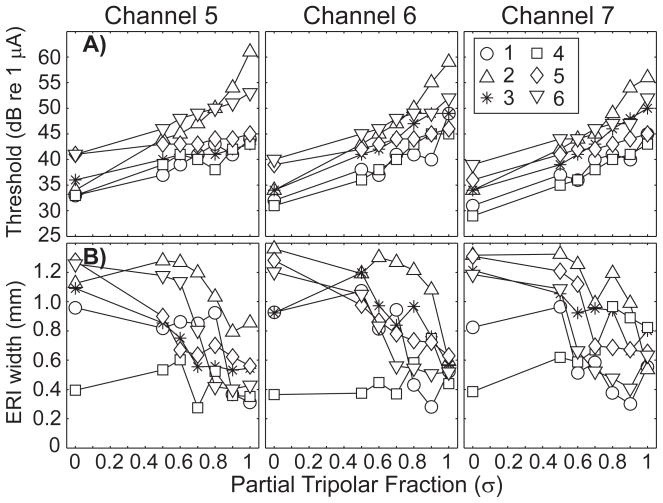
Figure 3 plots thresholds (Fig. 3A) and 2-dB ERI widths (Fig. 3B) as a function of partial tripolar fraction for all animals (indicated by various symbols) and for three cochlear implant channels (left to right). Thresholds varied among animals and implant channels. In each case, however, thresholds increased monotonically with increasing tripolar fraction (p < 0.001 for main effects of animals and partial tripolar fraction; two-tailed analysis of variance), whereas the ERI width decreased as the fraction was increased (p < 0.001 for animals and fraction). In the case of ERI width, however, the decrease in spread of activation did not begin until the fraction was δ = 0.50, or even higher in some animals.
Figure 3.
Neural thresholds and ERI widths. A) threshold of the most sensitive recording site (ordinate) as a function of partial tripolar fraction (abscissa) for three cochlear implant channels; 4 (left), 5 (middle), and 6 (right). B)ER I width (ordinate) as a function of partial tripolar fraction (abscissa) for the three cochlear implant channels tested. Subject number is indicated by symbol.
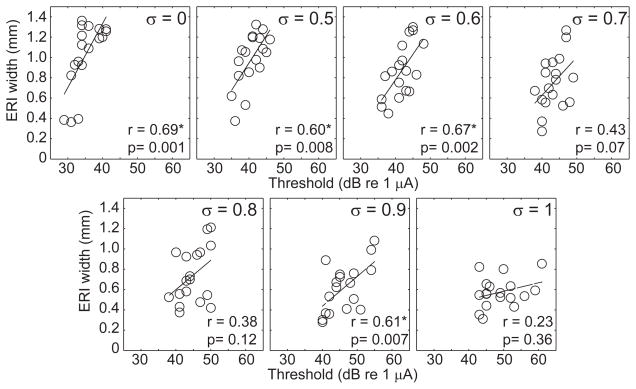
For any given partial-tripolar fraction, we observed a general trend toward broader ERI width associated with higher thresholds (Fig. 4), although that trend was statistically significant only for a subset of partial tripolar fractions (δ= 0, 0.5, 0.6 0.9; p < 0.005). Data from the three tested stimulus channels for each subject are included in the correlation analyses. The across-animal correlation between threshold and ERI width for the highest tripolar fraction suggests that both of those response properties are sensitive to a common factor that varies among animals, such as electrode placement.
Fig. 4.
Relation of ERI and neural thresholds. ERI (ordinate) is plotted as a function of threshold (abscissa) for all of the partial tripolar fractions tested: from 0 (top left) to 1 (bottom right). Data from the three tested stimulus channels for each subject are plotted and included in the correlation analyses. Linear regressions are indicated by the solid lines.
Forward masking
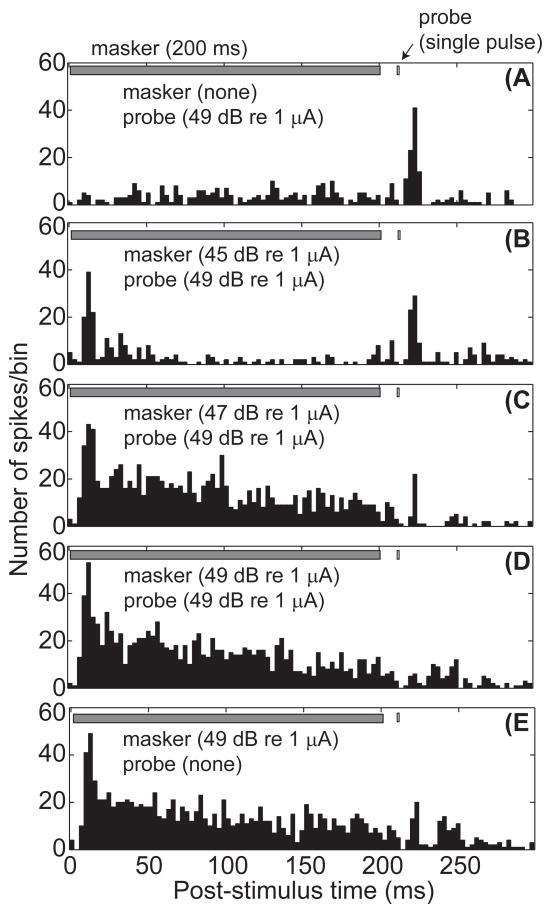
The presence of a 200-ms pulse train substantially reduced or eliminated the response to a single-pulse probe that followed the masker by 10 ms. This effect is demonstrated in Figure 5 by a series of post-stimulus time histograms of neural activity obtained from one animal at a single ICC recording depth. Panels 5B–D show conditions of fixed probe level and increasing masker level, and panels 5A and E show probe-alone and masker-alone conditions, respectively. In this example, both masker and probe stimuli were presented through channel 6, with δ = 0.5 and 1, respectively.
Figure 5.
Post-stimulus time histograms for forward masking stimuli. Each panel represents the post-stimulus time histogram for a given set of masker levels, with or without the fixed-level probe stimulus. The probe level was fixed at 49 dB re 1 μA, approximately 4 dB above the threshold for the probe alone. The average number of spikes per time bin (ordinate) is plotted as a function of post-stimulus time in ms (abscissa). Fig. 5a shows the response to the single pulse probe stimulus (A) with no masker present. Fig. 5b shows the response to a low level masker and the fixed level probe stimulus. Fig. 5c shows the response to a medium level masker and the fixed probe. Fig. 5d shows the response to a high level masker and the fixed probe. Fig. 5e shows the response to the high level masker with no probe stimulus. Responses are from GP5, with masker channel 6 at δ = 0.5 and probe channel 6 at δ = 1.
Units in the ICC tended to respond to the onset of a masking pulse train with a burst of spikes, as in Figs. 5B–E. Tonic responses to the masker at longer post-onset times often were absent or small at low masker current levels (e.g., Fig. 5B) but increased with increasing masker levels. A temporally distinct offset response often was evident at the highest masker level, as in Fig. 5E; a clear offset response was evident at 25 of the 83 total recording sites that showed stimulus-driven activity. A non-masked single-pulse probe consistently produced a burst of spikes (e.g., Fig. 5A). Increases in masker levels reduced (e.g., Figs. 5-C) or eliminated (e.g., Fig. 5D) the response to the probe pulse, thus demonstrating forward masking of the probe. In the illustrated example, the discrete burst of spikes following masker offset apparently was suppressed by the presentation of the probe; i.e., compare Fig. 5E with Fig. 5D. Such suppression of the masker offset response by the probe was observed for about half of the 25 recording sites that exhibited an offset response to the masker.
The tonotopic distribution of masking in the ICC was represented in the form of masking STCs; examples are shown in Fig. 6 for probe δ = 1 (i.e., full TP) and in Fig. 7 for probe δ = 0 (i.e., MP). The left column of panels shows the responses to the probe-only stimulus. The remaining columns of panels correspond to particular probe levels, and the rows correspond to masker channel. In each panel, the shaded area indicates the range of masker levels at which the probe was detectable at various ICC depths at a criterion of d′ = 1. Areas to the right of the shaded area at each ICC depth correspond to masker levels at which the probe was masked to below detectability. The dashed line in each panel represents the recording site for which the probe response was most reduced by the presence of the masker. In Fig. 6, the restricted spread of the masking STC in the ICC-depth dimension reflects the relatively narrow activation by the tripolar probe; that is, the masking STC is limited, somewhat to the ICC depths at which there is a strong probe response available to mask. For any particular masker channel number (i.e., any row of panels), the masking STC tended to broaden and to extend to higher masker levels as the probe level increased. For any particular probe level (i.e., any column of panels), masking was achieved at the lowest levels when the masker was on the same channel as the probe (“on-probe” channel 6). Higher masker levels were needed to achieve criterion levels of masking by “off-probe” masker channels; in many of the off-probe masker-channel conditions, maskers could not be presented at levels high enough to mask the probe completely.
Masking STCs in the MP-probe condition (Fig. 7) were broader than in the TP-probe condition, reflecting the broader spread of activation by the MP probe (left column). The difference between on-probe and off-probe masking channels was smaller in the MP-probe condition, likely due to the broader overlap of tonotopic areas activated by the channel-6 probe and by the three masker channels.
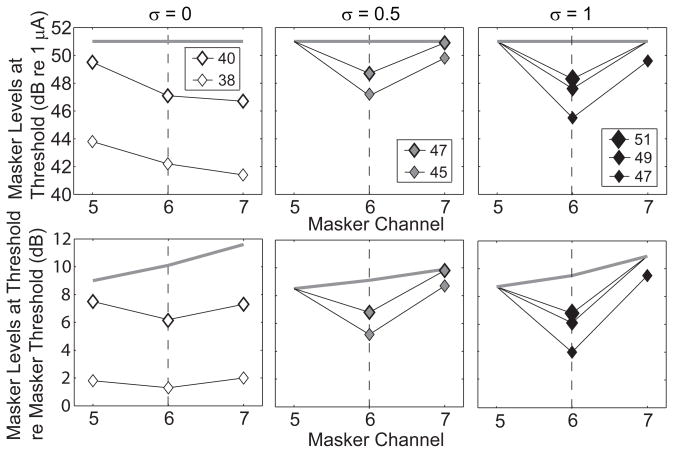
The effectiveness of various masker channels was quantified for each masker and probe condition by the minimum masker level needed to mask the probe response across all ICC depths. The “masker level at threshold” corresponds to the right-most point along each of the masking STCs in Figs. 6 and 7. Data from one animal are displayed in Fig. 8 in the form of forward-masked profiles, which show the masker level at threshold as a function of masker channel number for various tripolar fractions. In the upper row of panels, masker levels are given as current levels, whereas the lower row shows masker levels relative to the threshold for ICC onset responses to the masker. In this example and in most cases, masking of the probe response occurred at the lowest masking levels when the masker channel corresponded to that of the probe, channel 6, resulting in V-shaped profiles. The profiles are sharpest for the tripolar and partial tripolar probe configurations. In many cases, the masker level at threshold exceeded the highest masker level that could be tested, indicated by the gray lines. For that reason, the sharpness of some of the profiles was likely underestimated, particularly in tripolar and partial tripolar conditions.
Figure 8.
Forward masked profiles for the most sensitive recording site. Each panel shows the masker level (ordinate) required to just mask the probe as a function of masker channel (abscissa) for probe configurations of δ = 0 (left), δ = 0.5 (middle) and δ = 1 (right). The masker levels are in units of dB relative to a 1 μA in the top row and in dB relative to masker threshold in the bottom row. The probe level is represented by symbol size. The grey bar at indicates the maximum masker level tested. Symbols are plotted only if masking occurred within the limits of our stimulus set. Data are from GP5.
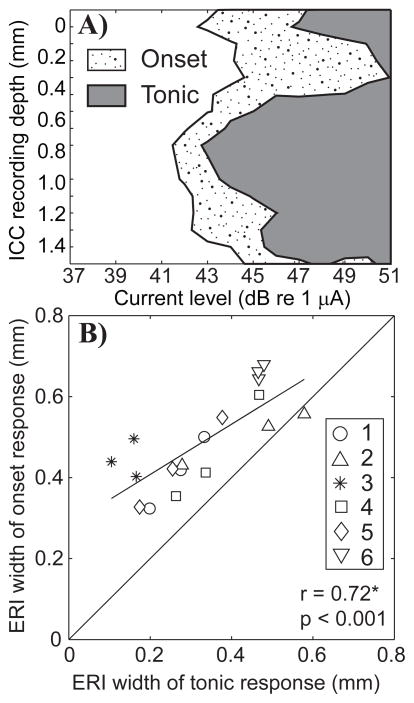
The spread of ICC activation by a masker might reflect, at least qualitatively, the tonotopic spread of forward masking. Spread of activation by the masker, however, differed between the burst of spikes at the masker onset and the tonic phase of the response. That is demonstrated in Fig. 9A by STCs computed for post-masker-onset times 4 to 20 ms (the stippled portion of the STC) and 150 to 200 ms (the gray portion). This example was typical in that the tonotopic spread of activation in the tonic portion of the response was more restricted than the onset burst. Figure 9B plots the ERI width for the tonic versus the onset components of the response to the masker. The ERI was consistently broader for the onset (4.86 ± 1.10 mm) compared to the tonic (3.26 ± 1.37 mm) portion of the response (paired t-test, p<0.001). The ERIs for the two components of the masker response were strongly correlated with one another (r = 0.72, p<0.001, Spearman’s rank correlation coefficient).
Figure 9.
A) Spatial tuning curves for the onset and tonic portions of the masker response. Neural activity along 16 recording sites in the inferior colliculus (ordinate) is shown as a function of stimulus current level (abscissa) in dB re 1 μA. The area of each curve represents neural activity levels that were distinguishable from background levels with a criteria of d′ = 1. The stippled portion of the STC was computed by averaging the responses over the first 3 to 20 ms. The grey portion was computed by averaging the responses over the last 50 ms of the masker pulse train, from 150 to 200 ms. Data are from GP5. B) Equivalent rectangular image widths comparing the onset (ordinate) and tonic (abscissa) portions of the masker response. Subject number is indicated by symbol. Multiple symbols for each subject represent the three masker channels tested (5, 6, and 7). The masker configuration was fixed to δ = 0.5.
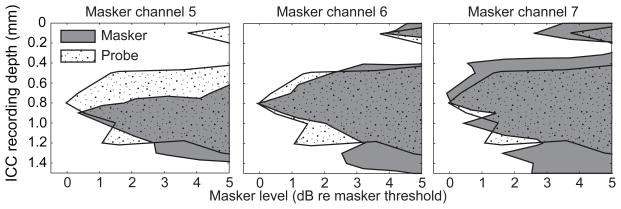
We assumed that forward masking would be more closely related to the ICC activation near the end of the masker than to the burst at the onset of the masker, which preceded the probe by 210 ms. For that reason, we examined the spread of ICC activation during the last 50 ms of the masking pulse train. Examples from one animal are shown in Figure 10, in which the shaded areas depict STCs for responses 150 to 200 ms after the onset (i.e. the tonic component) of 200-ms maskers delivered through channels 5, 6, and 7, with δ = 0.5. The stippled contour in all 3 panels is the STC for a non-masked single-pulse probe presented through channel 6, with δ = 1. Stimulus levels are expressed relative to the thresholds for onset bursts by maskers and by the non-masked probe, respectively. Consistent with the tonotopic organization of the ICC, the locus of the masker STCs varied from deeper in the ICC with the more basal channel (channel 5, left panel) to shallower with the more apical channel (channel 7, right panel). Not surprisingly, the STC for the non-masked probe presented through channel 6 generally conformed more closely to the STC of masker channel 6 than to those of the other masker channels. Note that the activation pattern to the probe stimulus of δ = 1 was not sharper than the δ = 0.5 masker pattern because the latter was based on the spatially restricted tonic portion of the driven response.
Figure 10.
Spatial tuning curves for masker and probe stimuli. Spatial tuning curve conventions are as in Figs. 1 and 4, except that the abscissa is in units relative to the masker alone threshold. In each panel the response to the non-masked single pulse, fixed-level probe is shown by the stippled curve. The shaded areas are the tonic responses to the last 50 ms of the 200-ms maskers, presented through cochlear implant channels 5 (left), 6 (middle) and 7 (right). The masking stimuli were δ = 0.5, and the probe stimulus was δ = 1.0. Data are from GP5.
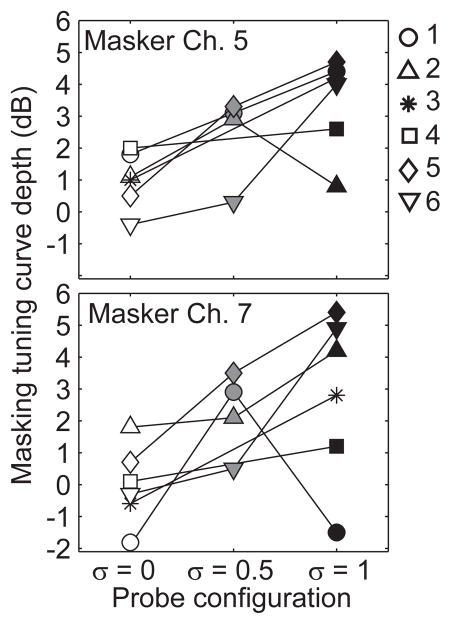
The sharpness of tuning across guinea pigs and probe configurations is summarized in Fig. 11. The depth of each tuning curve was calculated as the difference in the masker level at threshold for masker channel 5 compared to 6 (Fig. 10A) and for masker channel 7 compared to 6 (Fig. 11B). With only 2 exceptions the depth of tuning increased with increasing tripolar fraction (p < 0.05, 2-way ANOVA for channel 5 and 7).
Figure 11.
Depth of forward masked tuning curves. The depth of masked tuning curves is shown for the six tested subjects for the basal channel 5 (top) and apical 7 (bottom) as a function of probe configuration (abscissa). Depth of tuning was measured as the difference between masker levels required for off-channel maskers compared to on-channel maskers in dB (ordinate). The probe stimulus was always delivered to channel 6.
Discussion
The results demonstrate that increases in partial tripolar current fraction result in increases in threshold and decreases in spread of activation along the tonotopic axis of the inferior colliculus. A significant positive correlation was obtained between single-pulse threshold and the spread of excitation measure, suggesting that both measures are sensitive to the condition of the interface between the cochlear implant and the auditory nerve. In addition, when a forward masking paradigm was used, the spatial tuning curves revealed more restricted masking patterns as the partial tripolar fraction was increased. These findings suggest that effects of electrode configuration are consistent for single-pulse and forward-masking spatial tuning curves. The forward-masking results obtained in this animal model accord with the results obtained in human psychophysical studies that used a similar stimulation paradigm (Nelson et al., 2008; Bierer and Faulkner, 2010).
Single-pulse data
Previous physiological studies using single-pulse stimuli have shown that focused electrode configurations, such as bipolar and tripolar, show relatively high thresholds for activating neurons in the auditory nerve (van den Honert and Stypulkowski, 1987; Miller et al, 2003; Kral et al., 1998), the inferior colliculus (Rebscher et al., 2001; Snyder et al., 2004, 2008; Bonham and Litvak, 2008; Middlebrooks and Snyder, 2008) and the auditory cortex (Bierer and Middlebrooks, 2002; Raggio and Schreiner, 1999) compared to monopolar configurations. Consistent with those results, the present study demonstrates monotonically increasing inferior colliculus thresholds as a function of the presumed decreasing spread of electrical current in the cochlea. Those previous studies also demonstrated that more focused electrode configurations produce more restricted spread of activation, consistent with the present observations that the widths of ERI’s narrowed systematically with increasing partial tripolar fraction. Across animals and cochlear-implant channels, there was a general tendency for higher tripolar thresholds to occur in cases showing broader spread of activation. That observation suggests that both spread of activation and threshold are sensitive to the underlying interface between the cochlear implant electrodes and the nearby neurons.
In human cochlear implant listeners, there are several factors that can influence the electrode-neuron interface, including but not limited to neural survival patterns (e.g., Nadol et al., 2001), tissue or bone growth (Hanekom, 2005; Li et al., 2007), and electrode design and placement relative to the modiolus (e.g., Skinner et al., 2007; Finley et al., 2007). In the present animal model, nerve survival probably had little or no effect on variance among animals and electrodes because all animals were subject to a standardized deafening procedure shortly before the onset of data collection and because there was no time for bone growth or loss of nerve fibers resulting from the ototoxic drug administration. The primary factor influencing the electrode-neural interface, therefore, most likely was the location of electrodes within the scala tympani. That conclusion is supported by the observation that thresholds tended to be lowest for the most apical intrascalar electrodes, which fit most closely within the tapered scala tympani; the observation of lowest thresholds for most apical channel agrees with a previous observation (Bierer and Middlebrooks, 2002). In humans, study of electrically-evoked compound action potentials has produced mixed results regarding the effect of electrode location relative to the modiolus. Some studies found lower thresholds and narrower electrically-evoked compound action potential masking patterns for CI listeners with perimodiolar arrays (close electrode-to-neuron distance) compared to straight arrays (far electrode-to-neuron distance) (Cohen et al., 2003; Hughes and Abbas, 2006), whereas other studies have shown no systematic differences in masking patterns among devices with different distances between electrode arrays and the modiolus (different Cohen 2003; Boex 2003).
Forward-masking data
Results from the present study, along with previous physiological studies of single-pulse cochlear implant stimulation, have demonstrated greater effects of electrode configuration on functional spread of activation than have been measured psychophysically in humans (physiological studies: Kral et al., 1998; Bierer and Middlebrooks, 2002; Snyder et al., 2004; psychophysical studies: Chatterjee et al., 2006; Kwon and van den Honert). There are, however, many factors that that complicate comparisons between animal physiological and human psychophysical studies, including: anesthetic state, the type of measurements, responses of the auditory nerve and central auditory system to acute or chronic deafness, and the stimulation protocols. Of those factors, the present study was designed to minimize the effect of differing stimulus protocols by following the design of a previous human forward-masking study (Bierer and Faulkner, 2010). The results of the present animal study are in agreement with that human study in the general observations that increases in partial tripolar fraction resulted in higher thresholds and more restricted masking spatial tuning curves and that masking is greatest when the masker channel is aligned with the probe channel. As in the human study, the probe configuration steps were limited, in the case of the present study, to δ = 0, 0.5 and 1. The resolution of the masking tuning curve depth measurement did not warrant the testing of intermediate fractions between δ = 0.5 and 1.
Forward masking studies in animal models have emphasized the temporal recovery from forward masking rather than the spread of neural excitation effects of masker and probe locations. For instance, Nelson and colleagues (2009) measured forward masking in the inferior colliculi of awake marmosets, and Kirby and Middlebrooks (2010) measured gap detection and recovery from forward masking in cortical neurons of anesthetized guinea pigs. In both cases, forward-masked thresholds were similar to those measured psychophysically in normal-hearing subjects (e.g., Oxenham and Plack 2000), and cochlear implant listeners (e.g., Chatterjee, 1999). The present study, however, emphasized the spatial extent of forward masking, and the more focused electrode configurations had more restricted masking patterns, similar to previous findings.
Conclusions
Together these findings demonstrate the promise of the partial tripolar electrode configuration both for reducing thresholds compared to tripolar and for eliciting more focused activation of the auditory system than monopolar. Physiological results in animal models consistently have shown greater effects of electrode configuration than physiological and psychophysical results in human implant listeners. The discrepancy between animal and human findings is likely the result of greater variability in pathology and/or electrode position in human cochlear implantees. When the results of the present study are considered in the context of the available literature, it seems that focused electrical fields do activate restricted regions of the cochlea and central auditory system and those thresholds are sensitive to electrode placement and other cochlear factors that may indicate a poor electrode-to-neuron interface. This model is a good tool for studying new concepts for sound processing strategies in cochlear implants and for learning about the auditory system.
Acknowledgments
The authors would like to thank C. Ellinger for his engineering expertise and E. Rubel for sharing his lab space. This work was supported by the University of Washington, Bloedel Mini grant (JAB) and Bloedel Traveling Scholar (JCM) and P30 DC04661, and National Institutes of Health (NIDCD- R03 DC8883 to JAB and RO1-DC04312 to JCM).
Footnotes
Publisher's Disclaimer: This is a PDF file of an unedited manuscript that has been accepted for publication. As a service to our customers we are providing this early version of the manuscript. The manuscript will undergo copyediting, typesetting, and review of the resulting proof before it is published in its final citable form. Please note that during the production process errors may be discovered which could affect the content, and all legal disclaimers that apply to the journal pertain.
References
- Berenstein CK, Mens LH, Mulder JJ, Vanpoucke FJ. Current steering and current focusing in cochlear implants: comparison of monopolar, tripolar, and virtual channel electrode configurations. Ear Hear. 2008;29:250–260. doi: 10.1097/aud.0b013e3181645336. [DOI] [PubMed] [Google Scholar]
- Bierer JA, Faulkner KF. Identifying cochlear implant channels with poor electrode-neuron interface: Partial tripolar, single-channel thresholds, and psychophysical tuning curves. Ear Hear. 2010;31(2):247–58. doi: 10.1097/AUD.0b013e3181c7daf4. [DOI] [PMC free article] [PubMed] [Google Scholar]
- Bierer JA, Middlebrooks JC. Auditory cortical images of cochlear-implant stimuli: dependence on electrode configuration. J Neurophysiol. 2002;87:478–492. doi: 10.1152/jn.00212.2001. [DOI] [PubMed] [Google Scholar]
- Boex C, Kos MI, Pelizzone M. Forward masking in different cochlear implant systems. J Acoust Soc Am. 2003;114:2058–2065. doi: 10.1121/1.1610452. [DOI] [PubMed] [Google Scholar]
- Bonham BH, Litvak LM. Current focusing and steering: Modeling, physiology, and psychophysics. Hear Res. 2008;242:141–53. doi: 10.1016/j.heares.2008.03.006. [DOI] [PMC free article] [PubMed] [Google Scholar]
- Chatterjee M, Galvin JJ, 3rd, Fu QJ, Shannon RV. Effects of stimulation mode, level and location on forward-masked excitation patterns in cochlear implant patients. J Assoc Res Otolaryngol. 2006;7:15–25. doi: 10.1007/s10162-005-0019-2. [DOI] [PMC free article] [PubMed] [Google Scholar]
- Cohen LT, Richardson LM, Saunders E, Cowan RS. Spatial spread of neural excitation in cochlear implant recipients: comparison of improved ECAP method and psychophysical forward masking. Hear Res. 2003;179:72–87. doi: 10.1016/s0378-5955(03)00096-0. [DOI] [PubMed] [Google Scholar]
- Finley CC, Holden TA, Holden LK, Whiting BR, Chole RA, Neely GJ, Hullar TE, Skinner MW. Role of electrode placement as a contributor to variability in cochlear implant outcomes. Otol Neurotol. 2008;29:920–928. doi: 10.1097/MAO.0b013e318184f492. [DOI] [PMC free article] [PubMed] [Google Scholar]
- Fu QJ, Nogaki G. Noise susceptibility of cochlear implant users: the role of spectral resolution and smearing. J Assoc Res Otolaryngol. 2005;6(1):19–27. doi: 10.1007/s10162-004-5024-3. [DOI] [PMC free article] [PubMed] [Google Scholar]
- Green DM, Swets JA. Signal Detection Theory and Psychophyics. New York: Wiley; 1966. [Google Scholar]
- Hanekom T. Modelling encapsulation tissue around cochlear implant electrodes. Med Biol Eng Comput. 2005;43:47–55. doi: 10.1007/BF02345122. [DOI] [PubMed] [Google Scholar]
- Hinojosa R, Marion M. Histopathology of profound sensorineural deafness. Ann N Y Acad Sci. 1983;405:459–484. doi: 10.1111/j.1749-6632.1983.tb31662.x. [DOI] [PubMed] [Google Scholar]
- van den Honert C, Stypulkowski PH. Temporal response patterns of single auditory nerve fibers elicited by periodic electrical stimuli. Hear Res. 1987;29:207–222. doi: 10.1016/0378-5955(87)90168-7. [DOI] [PubMed] [Google Scholar]
- Hong RS, Rubinstein JT. Conditioning pulse trains in cochlear implants: effects on loudness growth. Otol Neurotol. 2006;27:50–56. doi: 10.1097/01.mao.0000187045.73791.db. [DOI] [PubMed] [Google Scholar]
- Hong RS, Rubinstein JT, Wehner D, Horn D. Dynamic range enhancement for cochlear implants. Otol Neurotol. 2003;24:590–595. doi: 10.1097/00129492-200307000-00010. [DOI] [PubMed] [Google Scholar]
- Hughes ML, Abbas PJ. Electrophysiologic channel interaction, electrode pitch ranking, and behavioral threshold in straight versus perimodiolar cochlear implant electrode arrays. J Acoust Soc Am. 2006;119:1538–1547. doi: 10.1121/1.2164969. [DOI] [PubMed] [Google Scholar]
- Kirby AE, Middlebrooks JC. Auditory temporal acuity probed with cochlear implant stimulation and cortical recording. J Neurophysiol. 2010;103:531–542. doi: 10.1152/jn.00794.2009. [DOI] [PMC free article] [PubMed] [Google Scholar]
- Koch DBOM, Segel P, Kessler D. HiResolution and conventional sound processing in the HiResolution bionic ear: using appropriate outcome measures to assess speech recognition ability. Audiol Neurootol. 2004;9:214–223. doi: 10.1159/000078391. [DOI] [PubMed] [Google Scholar]
- Kos MI, Boex C, Guyot JP, Pelizzone M. Partial withdrawal of deeply inserted cochlear electrodes: observations of two patients. Eur Arch Otorhinolaryngol. 2007;264:1369–1372. doi: 10.1007/s00405-007-0354-5. [DOI] [PubMed] [Google Scholar]
- Kral A, Hartmann R, Mortazavi D, Klinke R. Spatial resolution of cochlear implants: the electrical field and excitation of auditory afferents. Hear Res. 1998;121:11–28. doi: 10.1016/s0378-5955(98)00061-6. [DOI] [PubMed] [Google Scholar]
- Kwon BJ, van den Honert C. Effect of electrode configuration on psychophysical forward masking in cochlear implant listeners. J Acoust Soc Am. 2006;119:2994–3002. doi: 10.1121/1.2184128. [DOI] [PubMed] [Google Scholar]
- Li PM, Somdas MA, Eddington DK, Nadol JB., Jr Analysis of intracochlear new bone and fibrous tissue formation in human subjects with cochlear implants. Ann Otol Rhinol Laryngol. 2007;116:731–738. doi: 10.1177/000348940711601004. [DOI] [PubMed] [Google Scholar]
- Mens LH, Berenstein CK. Speech perception with mono- and quadrupolar electrode configurations: a crossover study. Otol Neurotol. 2005;26:957–964. doi: 10.1097/01.mao.0000185060.74339.9d. [DOI] [PubMed] [Google Scholar]
- Middlebrooks JC. Effects of cochlear-implant pulse rate and interchannel timing on channel interactions and thresholds. J Acoust Soc Am. 2004;116:452–468. doi: 10.1121/1.1760795. [DOI] [PubMed] [Google Scholar]
- Middlebrooks JC, Bierer JA. Auditory cortical images of cochlear-implant stimuli: coding of stimulus channel and current level. J Neurophysiol. 2002;87:493–507. doi: 10.1152/jn.00211.2001. [DOI] [PubMed] [Google Scholar]
- Middlebrooks JC, Snyder RL. Auditory prosthesis with a penetrating nerve array. J Assoc Res Otolaryngol. 2007;8:258–279. doi: 10.1007/s10162-007-0070-2. [DOI] [PMC free article] [PubMed] [Google Scholar]
- Middlebrooks JC, Snyder RL. Intraneural stimulation for auditoyr prosthesis: Modiolar trunk and intracranial stimulation sites. Hearing Res. 2008;242:52–63. doi: 10.1016/j.heares.2008.04.001. [DOI] [PubMed] [Google Scholar]
- Miller CA, Abbas PJ, Nourski KV, Hu N, Robinson BK. Electrode configuration influences action potential initiation site and ensemble stochastic response properties. Hear Res. 2003;175:200–214. doi: 10.1016/s0378-5955(02)00739-6. [DOI] [PubMed] [Google Scholar]
- Moore BCJ, Alcantara JI. The use of psychophysical tuning curves to explore dead regions in the cochlea. Ear Hear. 2001;22:268–278. doi: 10.1097/00003446-200108000-00002. [DOI] [PubMed] [Google Scholar]
- Nadol JB, Jr, Shiao JY, Burgess BJ, Ketten DR, Eddington DK, Gantz BJ, Kos I, Montandon P, Coker NJ, Roland JT, Jr, Shallop JK. Histopathology of cochlear implants in humans. Ann Otol Rhinol Laryngol. 2001;110:883–891. doi: 10.1177/000348940111000914. [DOI] [PubMed] [Google Scholar]
- Nelson DA, Donaldson GS, Kreft H. Forward-masked spatial tuning curves in cochlear implant users. J Acoust Soc Am. 2008;123:1522–1543. doi: 10.1121/1.2836786. [DOI] [PMC free article] [PubMed] [Google Scholar]
- Nelson PC, Smith ZM, Young ED. Wide-dynamic-range forward suppression in marmoset inferior colliculus neurons is generated centrally and accounts for perceptual masking. J Neurosci. 2009;29:2553–2562. doi: 10.1523/JNEUROSCI.5359-08.2009. [DOI] [PMC free article] [PubMed] [Google Scholar]
- Nie K, Barco A, Zeng FG. Spectral and temporal cues in cochlear implant speech perception. Ear Hear. 2006;27:208–217. doi: 10.1097/01.aud.0000202312.31837.25. [DOI] [PubMed] [Google Scholar]
- Oxenham AJ, Plack CJ. Effects of masker frequency and duration in forward masking: further evidence for the influence of peripheral nonlinearity. Hear Res. 2000;150:258–266. doi: 10.1016/s0378-5955(00)00206-9. [DOI] [PubMed] [Google Scholar]
- Raggio MW, Schreiner CE. Neuronal responses in cat primary auditory cortex to electrical cochlear stimulation. III. Activation patterns in short- and long-term deafness. J Neurophysiol. 1999;82:3506–3526. doi: 10.1152/jn.1999.82.6.3506. [DOI] [PubMed] [Google Scholar]
- Rebscher SJ, Snyder RL, Leake PA. The effect of electrode configuration and duration of deafness on threshold and selectivity of responses to intracochlear electrical stimulation. J Acoust Soc Am. 2001;109:2035–2048. doi: 10.1121/1.1365115. [DOI] [PubMed] [Google Scholar]
- Schoenecker M, Stakhovskaya O, Bonham B, Snyder R, Leake P. Monopolar intracochlear pulse trains can elicit focal central activation. Conference on Implantable Auditory Prostheses; Lake Tahoe, CA. July 12–17, 2009.. [Google Scholar]
- Skinner MW, Holden TA, Whiting BR, Voie AH, Brunsden B, Neely JG, Saxon EA, Hullar TE, Finley CC. In vivo estimates of the position of advanced bionics electrode arrays in the human cochlea. Ann Otol Rhinol Laryngol Suppl. 2007;197:2–24. [PubMed] [Google Scholar]
- Snyder RL, Bierer JA, Middlebrooks JC. Topographic spread of inferior colliculus activation in response to acoustic and intracochlear electric stimulation. J Assoc Res Otolaryngol. 2004;5:305–322. doi: 10.1007/s10162-004-4026-5. [DOI] [PMC free article] [PubMed] [Google Scholar]
- Snyder RL, Middlebrooks JC, Bonham BH. Cochlear implant electrode configuration effects on activation threshold and tonotopic selectivity. Hear Res. 2008;235:23–38. doi: 10.1016/j.heares.2007.09.013. [DOI] [PMC free article] [PubMed] [Google Scholar]


