

Abstract
The human apical sodium dependent bile acid transporter (hASBT) re-absorbs gram quantities of bile acid daily and is a potential prodrug target to increase oral drug absorption. In the absence of a high resolution hASBT crystal structure, 3D-QSAR modeling may prove beneficial in designing prodrug targets to hASBT. The objective was to derive a conformationally sampled pharmacophore 3D–QSAR (CSP-SAR) model for the uptake of bile acid conjugates by hASBT. A series of bile acid conjugates of glutamyl chenodeoxycholate were evaluated in terms of Km and normalized Vmax(normVmax) using hASBT-MDCK cells. All mono-anionic conjugates were potent substrates. Dianions, cations and zwitterions, which bound with a high affinity, were not substrates. CSP-SAR models were derived using structural and physicochemical descriptors, and evaluated via cross-validation. The best CSP-SAR model for Km included two structural and two physiochemical descriptors, where substrate hydrophobicity enhanced affinity. A best CSP-SAR model for Km/normVmax employed one structural and three physicochemical descriptors, also indicating hydrophobicity enhanced efficiency. Overall, the bile acid C-24 region accommodated a range of substituted anilines, provided a single negative charge was present near C-24. In comparing uptake findings to prior inhibition results, increased hydrophobicity enhanced activity, with dianions and zwitterions hindering activity.
Keywords: bile acid, transporter, substrate, Michaelis-Menten, affinity, capacity, hydrophobicity, structure-activity relationship
Introduction
The human apical sodium dependent bile acid transporter (SLC10A2, hASBT) is the major transporter involved in uptake and transport of bile acids from the intestine. It also plays an important role in the enterohepatic circulation of bile acids, enabling efficient recycling and conservation of bile acids to maintain the bile acid pool in the body 1–4. The transport of both conjugated and unconjugated bile acids with over 95% efficacy emphasizes hASBT’s tremendous potential as a prodrug target 5. The design of successful prodrug targets to hASBT is impeded by a lack of understanding of the molecular mechanisms of uptake, and the absence of a high resolution crystal structure. Consequently, there is a need to identify the important structural and functional characteristics that underlie the transport mechanisms for successful prodrug targeting of hASBT. Despite the extensive studies on the functional and molecular properties hASBT and its interactions with various bile acid analogues, an understanding of the substrate requirements for hASBT is limited. In particular, the influence of the C-24 chemistry space attributes that enhance or impede interaction of bile acid analogues with hASBT are not clear 6. Notably, no 3D-QSAR uptake model has been developed for hASBT substrates.
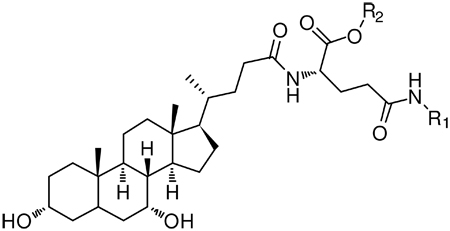
Prior to cloning of hASBT, Lack et al. demonstrated conjugation improved transport efficacy and proposed that a negative charge around the C-24 region is essential for interaction with hASBT 7. Most studies further established that a single negative charge around C-24 was important for transport activity. For instance, Swaan and colleagues examined the transport of four C-24 bile acid conjugates across Caco-2 monolayers, each providing a negative charge near C-24, of which two conjugates were rapidly transported 8. Further analysis suggested the length of the C-24 side chain can be 14 Å or longer for translocation, and that large hydrophobic moieties enhanced binding to hASBT. Baringhaus et al. developed a 3D-QSAR inhibition model with a set of 17 inhibitors of the rabbit ileal Na /bile acid cotransporter. The developed pharmacophore included five essential features: one hydrogen bond donor, one hydrogen bond acceptor and three hydrophobic features.9 Previously, in our laboratory, native and C-24 modified bile acid conjugates were studied in stably transfected hASBT-MDCK monolayers. These studies suggested the natural bile acid chenodeoxycholic acid (CDCA) can be coupled to glutamic acid as a linker (denoted glu-CDCA) in order to maintain a single negative charge around C-24, to which various probes can be conjugated 6, 10. Additionally, acyclovir bioavailability was increased by conjugating acyclovir to CDCA via a valine linker at the bile acid’s C-24 position, demonstrating negative charge could be replaced by a hydrogen bond accepting group 8.
The conformationally sampled pharmacophore (CSP) method is a novel approach 11–14 that can be combined with physiochemical parameters to yield 3D-QSAR models (denoted CSP-SAR). CSP is well suited for compound classes with high structural flexibility, such as bile acid conjugates. CSP considers all accessible molecular conformations to assure that the bioactive conformer of each compound is included for model development. The inhibition requirements of hASBT using anilinyl conjugates of glu-CDCA 15 and aminopiperidine conjugates were studied previously using CSP-SAR 14. In this study, we focus on delineating the uptake requirements of hASBT using a previously reported series of glu-CDCA conjugates of benzene and aminopiperidine analogues 14, 15, where benzene and aminopiperidine represent drug scaffolds. Transport data in these bile acid analogues were used to build a CSP-SAR model that could be of utility to predict potential prodrugs, where CDCA would be conjugated to the drug via a glutamic acid linker. Overall, this work attempts to elucidate hASBT substrate requirements and derive 3D-QSAR uptake models, which have promised to develop a rational prodrug design strategy to target ASBT.
Experimental Section
Materials
[3H]-Taurocholic acid (10 µCi/mmol) was purchased from American Radiolabeled Chemicals, Inc (St. Louis, MO). Taurocholate was obtained from Sigma Aldrich (St. Louis, MO). CDCA was obtained from TCI America (Portland, OR). Geneticin, fetal bovine serum (FBS), trypsin, and DMEM were purchased from Invitrogen (Rockville, MD). All other reagents and chemicals were of the highest purity commercially available.
Synthetic Procedures
A series of substituted anilinyl 15 and aminopiperidine conjugates glu-CDCA were previously synthesized 14. Briefly, almost all conjugates employed coupling α-benzyl glutamic acid to CDCA via either N-hydroxysuccinimide (OSU) ester or benzotriazole (OBT) ester. Various substituted probes were then coupled to bile acid via glutamic acid by stirring either at RT or 60°C using O-benztriazol-1-yloxytris-1,1,3,3 tetra methyl uranium hexaflourophosphate (HBTU) as the activating agent and triethylamine (TEA) as the base. The resulting neutral compounds were then subjected to hydrogenation in a parr shaker for 1–2 h in ethanol and 10% palladium to remove the α- benzyl group, yielding the mono and dianionic targets. Neutral compound intermediates were purified by column chromatography using a gradient of hexane and ethyl acetate. Final target compounds were obtained as solids after deprotection. Identity and purity were confirmed by TLC, MS, NMR, and elemental analysis 15 .
Cell Culture
Stably transfected hASBT-MDCK cells were cultured as described previously 10, 16. Briefly, cells were grown at 37°C, 90% relative humidity, and 5% CO2 atmosphere and fed every 2 days. The media for cell culture comprised DMEM supplemented with 10% FBS, 50 U/mL penicillin, and 50 µg/mL streptomycin. Geneticin at 1 mg/mL was used to maintain selection pressure. Cells were passaged every 4 days or after reaching 90% confluence.
Conjugate uptake into hASBT-MDCK cells
Uptake studies of 32 conjugates of glu-CDCA were performed in 12-well cell culture polystyrene plates (Corning Costar; Corning, NY). Of the 32 conjugates, 29 were anilinyl conjugates of glu-CDCA 15, that were either mono- or di-anionic, while three were aminopiperidinyl conjugates of glu-CDCA 14. Aminopiperidinyl conjugates were either cationic or zwitterionic. The 12-well plates were seeded with hASBT-MDCK cells at a density of 1.5×10⁶ cells/well and induced on day 4 with 10 mM sodium butyrate for 12–15 h prior to uptake experiments. Conjugate concentration varied from 0–100 µM for most monoanions and up to 5000 µM for dianions. Uptake studies were initiated by washing the cells three times with warm Hank’s balanced salt solution (HBSS) [pH 6.8] and exposing cells to donor solution for 10 min at 37°C and 50 rpm in an orbital shaker. Cells were washed three times with chilled sodium free buffer. Parallel identical studies were performed without sodium, in order to measure passive conjugate uptake. Additionally, taurocholate Vmax was measured on each occasion as previously described 14, as taurocholate is a reference hASBT substrate. For each conjugate, conjugate Vmax was normalized to observed taurocholate Vmax to yield substrate normalized Vmax, denoted normVmax. normVmax accommodates variable hASBT protein expression across occasions.
Quantification of conjugates by LC/MS/MS
Cells were lysed and subjected to extraction as described previously 17. Briefly, at the end of uptake experiment, cells were lysed by addition of 300 µL of acetonitrile. Acetonitrile was evaporated at RT over 2–3 hr. Extraction of conjugate from cell lysate was performed by adding 1mL of 50:50 acetonitrile:water spiked with 500 nM internal standard; plates were then sealed with parafilm. After 30 min, extract was placed into silanized vials and stored in −80°C until analyzed. Recovery experiments using the extraction protocol have been previously described using 3[H]-taurocholate as a standard substrate for hASBT 17. Taurocholate uptake studies were performed as a standard control; taurocholate kinetic parameters were determined from LC/MS/MS analysis using the methods described below except detection was achieved under negative ion electrospray tandem MS using the [M-H]−, peaks and compound 1 as the internal standard. The multiple reaction monitoring (MRM) transition used for taurocholate was 514.4> 123.66 and run time was 8 min.
Conjugate uptake was quantified by LC/MS/MS using a Finnigan Surveyor HPLC system equipped with an autosampler with a Finnigan TSQ quantum Discovery Max mass spectrometer (Thermo Fisher Scientific Inc., Waltham MA). The column was a Phenomenex Luna C8, 50 × 2 mm, 5µ column, heated to 40°C. The flow rate was 0.4 mL/min. The gradient of 5–95% acetonitrile was employed over 0.2–4 min and the overall run time for most conjugates was 6–8 min. The starting mobile phase gradient for most conjugates was 50:50 acetonitrile: water (Table S1a in supplemental data) up to 0.2 min, followed by increase in organic phase to 95% up to 3–4 min. It was maintained at 95% organic phase for 1 min and then reduced back to 50% organic phase by 6–8 min. The mobile phase included 0.1% formic acid as a modifier for all monoionic and dianionic conjugates. For zwitterionic and cationic conjugates, 0.1% ammonium hydroxide was used as the modifier. Injection volume was 10 µL. Detection was achieved under positive ion electrospray tandem MS using the [M+H]+ peak, as positive mode provided the greatest sensitivity, except for the standard taurocholate where detection was achieved under negative ion mode. The unsubstituted aniline conjugate, which shares a structure similar to all studied conjugates, was used as the internal standard. MRM transitions for the conjugates are listed in Table S1a.
Kinetic Analysis
Conjugate kinetic parameters Vmax, Km and Pp were obtained by fitting uptake data to modified the Michaelis-Menten model as previously described using WinNonlin 5.2 (Pharsight, Mountain View, CA) 17. Eqn 1 is a modified version of the classical Michaelis-Menten which accounts for the presence of an apical boundary layer, PABL was 1.5 × 10⁻⁴ cm2/s 18. Data from sodium free studies were fitted to eqn. 2 which represents the passive transport.
| (1) |
| (2) |
Computational Methods
The twenty-seven anilinyl conjugates of glu-CDCA that were substrates were used to develop CSP-SAR substrate models, individually for Km and Km /normVmax. None of the aminopiperidine conjugates were substrates, and hence not used in CSP-SAR analysis. Km reflects substrate affinity for the transporter. Km values less than 0.1 µM were assigned a value of 0.1 µM, due to the limited ability to accurately estimate potent Km values 18. Vmax is the transporter capacity for the substrate. normVmax is Vmax normalized against observed taurocholate Vmax in order to accommodate variable hASBT protein expression across occasions. Km/normVmax describes the reciprocal of the transporter efficiency. Model development for normVmax and normVmax/Km were not successful, as described below.
Compound descriptors for CSP-SAR modeling were previously generated 15. Briefly, in silico models of conjugates were built using the program CHARMM 19 with the all-atom CHARMM general force field (CGenFF) 20 . Each molecule was subjected to 1000 steps of steepest descent (SD) and 500 steps of Newton-Raphson (NRAP) energy minimization in the gas phase to a gradient of 10−4 kcal/mol/Å. Structures minimized using CHARMM were subjected to replica exchange molecular dynamic (MD) simulations involving 20 ns simulations with four replicas of each molecule between 300K and 400K, using an exponential scale (300K, 330K, 363K, and 400K) 21–23. Exchange of replicas was attempted after every 250 MD steps. MD simulations were performed using Langevin dynamics 24 with an integration time step of 0.002 ps and the aqueous solvation was modeled implicitly via the Generalized Born Continuum Solvent Model (GBMV) 25, 26. SHAKE was applied to all covalent bonds involving hydrogens 27. Conformations saved every 20 ps and obtained from all 4 replicas were used for the analysis. The protonation states of the ionizable groups present in the molecules were determined based on the experimental pH of 6.8. All free acids were assumed to be protonated.
As previously reported, several physico-chemical descriptors were calculated for each conjugate by averaging over the full trajectories 15. Those descriptors that manifested here in models are briefly described here. The free energy of solvation of each compound in water (ΔGw) was calculated using the semi-empirical quantum chemical program AMSOL6.8 by invoking the AM1-SM5.42R continuum solvent model 28. ΔGw was calculated by taking the difference between the heat of formation plus solvation energy of the solvated system in its relaxed electronic state and that for the gas-phase system. Average solvent accessible surface area (SASA) and polar surface area (PSA) were calculated using the Lee and Richards method as implemented in CHARMM 29. The radius of the solvent molecule was taken as 1.4 Å, which approximates the radius of a water molecule 30. PSA for each compound was calculated by adding the contribution of polar atoms (N, O, F, Cl, Br and hydrogen atoms covalently attached to any of these atoms). For calculation of PSA, halogens were included as they could potentially take part in polar interactions with other polar atoms 31–34. SASA and PSA were also calculated exclusively for the region beyond C-24 of the bile acid conjugates (SASAside and PSAside) to access the contribution of the substituents alone towards the interaction with hASBT. Surface area terms were obtained as averages over the conformations saved from the MD simulations. Molar refractivity (MR) and flexibility parameter (KierFlex) were calculated using the program MOE 35. The number of hydrogen bond donors (HD) for each molecule was calculated using Discovery Studio (Accelrys Inc.) 36.
Conformational properties of molecules required for CSP model development included the 20 pharmacophore distances and 26 pharmacophore angles reported previously 15 as shown in Figure 1. Overlap coefficients (OC) for each compound were calculated with respect to the most potent substrate in the data set (Compound 13, Km = 0.1 µM). Greater OC values reflect greater structural similarity to the most potent compound.
Figure 1.

Structural features in anilinyl conjugates of glu-CDCA used for pharmacophore development. Notation is as follows: O3, position of 3-OH; O7, position of 7-OH; BC, centroid of B and C rings of steroidal nucleus; C18, location of C-18; C19, location of C-19; C20, location of C-20; C-24 is the location of the charge on unconjugated native bile acids; AA, centroid of carboxylic acid oxygens on a-acid; GS, centroid of γ-substituent (R1); R2 is the substituent on the a-acid (-H or -CH2C6H5).
Regression Analysis
Using the statistical program R, regression analysis was applied to each Km and Km/normVmax to develop CSP-SAR substrate models. Molecular descriptors were subjected to single variable as well as multivariable regression against each of the dependent variables. The structural and physico-chemical descriptors were then combined to make a complete set of molecular descriptors for model development. All molecular descriptors were subjected to multivariable regression analysis against both Km and Km/normVmax separately.
Molecular descriptors were subjected to multivariable regression in all possible combinations of two. However, any combination having correlation between each other (r) greater than 0.8 were not considered. Table S2 (supplemental data) lists correlation values between independent descriptors. All combinations of descriptors with p-values of the independent variables, as well as the intercept, less than 0.05 were selected for further analysis. Additional descriptors were sequentially added to each selected pair of descriptors. This approach was applied until all possible combinations of descriptors yielded p-values greater than 0.05. All combinations of descriptors with p-values less than 0.05 formed the set of candidate models. The standardized coefficients of the independent variables 37 of the candidate models were also calculated 38, as previously described 15. Model evaluation was performed using the modified Akaike Information Criterion (AICC) 39, 40 analysis and leave-one-out cross validation method, as described previously 14, 15. In calculating AICC, the residual sum of squares (RSS) obtained from fitting all compounds.
Results and Discussion
Results from uptake experiments into hASBT-MDCK cells are presented, followed by CSP-SAR substrate models. CSP-SAR models are for substrate affinity (i.e. Km) and for reciprocal of efficiency (i.e. Km/normVmax).
Conjugate uptake into hASBT-MDCK cells
A congeneric series of 32 aniline and aminopiperidine bile acid conjugates previously synthesized and tested for hASBT inhibition 15 were evaluated for uptake by hASBT. Figure 2 shows the uptake profiles of taurocholate (Km= 4.84 µM and Vmax= 0.699 pmol/cm2/s) which is a known potent substrate, and the unsubstituted anilinyl conjugate of glu-CDCA (compound 1). Compound 1 kinetics was similar to taurocholate. Like taurocholate, compound 1 was a potent hASBT substrate (Km= 0.823 µM and normVmax= 1.19). Total uptake (in presence of sodium) was markedly higher than passive uptake (absence of sodium).
Figure 2.

Concentration-dependent uptake profiles. (A) Taurocholate and (B) unsubstituted aniline conjugate were actively translocated by hASBT. Uptake was greater in the presence of sodium (●) than in the absence of sodium (○), indicating them to be hASBT substrates.
Kinetics of hASBT-mediated transport was assessed for each conjugate from transport studies employing a range of donor concentrations for each conjugate. Table 1 lists 27 compounds (compounds 1–27) that were hASBT substrates. Table S1b (supplemental data) provides stereochemical SMILES of the compounds used in this study. All were monoanionic, except one dianionic compound. Table 2 lists five compounds (compounds 28–32) that were not hASBT substrates, and includes two dianions, one cation, and two zwitterionic compounds. Tables 1 and 2 indicate compound kinetic parameters Km, normVmax, and Pp. Mono-anionic conjugates were potent substrates of hASBT with activity ranging from 0.1µM to 17 µM. This Km range is the same as the range for native bile acids, which is from <0.1 to 16 µM 41. These results suggest the potential of further exploiting C-24 conjugation to design prodrugs that can be targeted to hASBT. Among the substrates, ring substituents varied in electronic character, size, and hydrophobicity. Increased polarity led to a slight decrease in affinity (i.e. increase in Km) as seen by esters, amine and boc group substituents on the benzene ring. Electronic character did not significantly impact affinity, as electron donating (e.g. methyl, methoxy) and electron withdrawing substituents (e.g. chloro, flouro) were potent substrates.
Table 1.
Structures, Km, and normalized Vmax values of anilinyl conjugates of glu-CDCA. This table only includes conjugates that were substrates.
 | ||||||
|---|---|---|---|---|---|---|
| Compound | R1 | R2 | Charge | Km (µM)a | Normalized Vmax |
Pp × 106 (cm/s)b |
| 1 |  |
H | −1 | 0.823 ± 0.320 | 1.19±0.05 | 1.40±0.11 |
| 2 |  |
H | −1 | 0.100a ± 0.773 | 1.51±0.18 | 4.51±0.05 |
| 3 |  |
H | −1 | 2.22 ± 1.71 | 1.30±0.18 | 6.03+0.72 |
| 4 |  |
H | −1 | 1.11 ± 0.35 | 1.01±0.03 | 0.643±.040 |
| 5 |  |
H | −1 | 0.450 ± 0.611 | 0.686±0.075 | 2.54±0.16 |
| 6 | 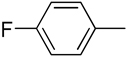 |
H | −1 | 0.100a ± 0.330 | 1.09±0.01 | 2.08+0.15 |
| 7 |  |
H | −1 | 1.69 ± 0.71 | 1.72±0.14 | 2.74±0.19 |
| 8 | 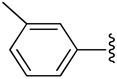 |
H | −1 | 0.919 ± 0.622 | 1.04±0.11 | 1.62±0.26 |
| 9 | 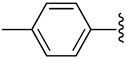 |
H | −1 | 0.100a ± 0.500 | 1.48±0.17 | 2.44±0.10 |
| 10 | 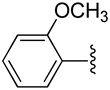 |
H | −1 | 3.87 ± 0.55 | 0.978±0.087 | 1.21±0.08 |
| 11 |  |
H | −1 | 1.21 ± 0.58 | 0.553±0.058 | 2.43±0.13 |
| 12 |  |
H | −1 | 6.56 ± 0.98 | 0.903±0.105 | 0.666±0.086 |
| 13 |  |
H | −1 | 0.100a ± 5.302 | 2.32±0.887 | 9.98±0.09 |
| 14 |  |
H | −1 | 3.42 ± 1.23 | 0.375±0.070 | 1.71±0.01 |
| 15 |  |
H | −1 | 7.27 ± 2.80 | 1.47±0.31 | 4.08±0.28 |
| 16 |  |
H | −1 | 2.54 ± 0.69 | 0.800±0.110 | 3.39±0.12 |
| 17 |  |
H | −1 | 10.3 ± 3.1 | 0.203±0.017 | 1.59±0.07 |
| 18 |  |
H | −1 | 17.5 ± 4.7 | 0.250±0.022 | 1.73±0.07 |
| 19 |  |
H | −1 | 9.89 ± 1.15 | 0.762±0.241 | 0.667±0.031 |
| 20 |  |
H | −1 | 14.9 ± 1.2 | 0.535±0.081 | 0.610±0.029 |
| 21 |  |
H | −1 | 7.91 ± 1.94 | 0.336±0.043 | 0.586±0.045 |
| 22 |  |
H | −1 | 0.549 ± 0.240 | 1.07±0.06 | 1.00+0.05 |
| 23 |  |
H | −1 | 7.82 ± 2.06 | 0.546±0.057 | 1.45+0.06 |
| 24 |  |
H | −1 | 2.53 ± 0.48 | 0.989±0.066 | 1.42+0.02 |
| 25 |  |
H | −1 | 11.4 ± 1.5 | 0.441±0.047 | 0.451+0.017 |
| 26 |  |
 |
−1 | 495 ± 222 | 1.34±0.412 | 1.32+0.39 |
| 27 |  |
H | −2 | 607 ± 476 | 0.639±0.190 | 0.183±0.008 |
Km was assigned a value of 0.1 µM when regressed value was less than 0.1 µM; regressed Km values for compound 2, 6, 9, and 13 were 0.010±0.773 µM, 0.011±0.331 µM, 0.007±0.551 µM, and 0.008±5.301 µM, respectively.
P p is the passive permeability of the conjugates.
Table 2.
Conjugates that were non-substrate for ASBT. R1 and R2 refer to substituents on the same general structure in Table 1.
| Compound | R1 | R2 | Charge | Pp × 106 (cm/s) |
|---|---|---|---|---|
| 28 |  |
H | −2 (Dianion) | 0.216±0.012 |
| 29 | 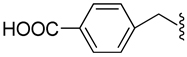 |
H | −2 (Dianion) | 0.104±0.005 |
| 30 | 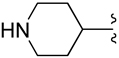 |
CH2C6H5 | +1 (Cation) | 4.71±0.09 |
| 31 | 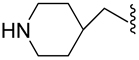 |
H | zwitterion | 0.204±0.023 |
| 32 | 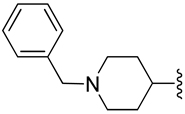 |
H | zwitterion | 0.336±0.017 |
Regarding compound charge, substrate results differed from inhibition results. For inhibition, a single negative charge was not an essential requirement 6. However, charge played the dominant role in translocation across hASBT. Only monoanions were potent substrates. Compared to other monoanions, the location of the negative charge was moved distal from C-24 to the benzene ring by protecting the α-acid on glutamic acid, resulting in loss of activity (compound 26, Km = 495µM). This result suggests that the negative charge should preferentially be within the vicinity of C-24 for active hASBT uptake. None of the three aminopiperidine conjugates (one cation and two zwitterions) were substrates. Only one of the three dianionic conjugates was a substrate (compound 27), but was a very weak substrate. Previous studies have also shown that dianions are weak inhibitors of hASBT 15, but that cations and zwitterions bound with moderate to good affinity 6, 14. Translocation is a more elaborate and complex phenomenon than binding, such that compounds which were strong inhibitors of hASBT were not found to be strongly translocated if not bearing a single negative charge.
Figure 3 (panel A) illustrates the correlation between normVmax and substrate Km for compounds 1–25. Compounds 26 and 27 were weak substrates and not included. An inverse relationship was observed where higher capacity was weakly associated with substrate affinity (i.e. lower Km) (linear r2 = 0.391). This association points towards high binding affinity to generally promote transport capacity.
Figure 3.

Plotted relationships between substrate and inhibition parameters for conjugates 1–25 (i.e. Set 1). (A) The relationship between normalized Vmax and Km is plotted. Compounds with higher affinity (i.e. lower Km) were associated with higher capacity. (B) The relationship between Km and Ki is plotted. Substrate affinity and inhibitory potency were generally similar, implicating binding as the rate limiting step in overall conjugate translocation. (C) The relationship between normalized Vmax and Ki is plotted. Inhibitor potency and capacity for each conjugate were generally positively associated, as lower Ki (i.e. higher binding) was associated with higher translocation capacity. The trend between Ki and normalized Vmax was similar to the trend between Km and normalized Vmax in panel A.
Figure 3 also plots the relationships of Km and normVmax versus inhibitory Ki for compounds 1–25 (panels B and C, respectively). Ki values were reported previously 15 and reflect inhibition potency. Each Km and normVmax were weakly associated with Ki (linear r2 = 0.360 for Km and linear r2 = 0.310 for normVmax). These monoanionic conjugates were potent inhibitors (Ki ranged from 0.889 to 16.3 µM) and potent substrates (Km ranged from 0.1 to 17.5 µM). Ki and Km values were qualitatively similar, reflecting high inhibition potency and high substrate affinity. Like native bile acids 10, these data indicate substrate binding was the rate limiting step for translocation of monoanions.
Computational Modeling
The compounds were subjected to CSP-SAR analysis. Km, normVmax, normVmax/Km, and Km/normVmax were separately considered, with the aim to identify structural and physicochemical descriptors that explain the biological activity. Results for normVmax and normVmax/Km did not yield predictive models. The single variable regression analysis yielded poor correlation for normVmax and normVmax/Km (r2 ≤ 0.3), and further fitting was not attempted. However, successful models were obtained for Km and Km/normVmax and these results are discussed below.
CSP-SAR hASBT Substrate Model Development: Quantitative Model
Two data sets were examined to obtain substrate CSP-SAR models. Set 1 included all compounds that were substrates, while Set 2 excluded compounds 26 and 27. The Km values for 26 and 27 were around 400 – 600 fold higher than that of other compounds, indicating that specific features of 26 and 27 lead to significantly lower activities. 27 was the only dianionic conjugate that showed any measurable translocation. 26 was similar to 27 except the a-acid on the glutamic acid linker was protected by the benzyl group, providing a distal charge to C-24. As shown below, these compounds dominated model fitting when included in data set (i.e. Set 1), such that the sensitivity of the model to properties of the other compounds was diminished. Table S3 (supplemental data) shows various molecular descriptor values used to describe Km and Km/normVmax of the anilinyl conjugates of glu-CDCA. Aminopiperidine conjugates were not substrates and were not considered in the model development.
CSP-SAR Model for Km: Single Variable Regression
For each data Set 1 and Set 2, two best CSP-SAR models for Km were obtained. Table S4 (supplemental data) presents intermediate analysis results from single variable regression of molecular descriptors against Km for Set 1. Table S5 (supplemental data) represents the same results for Set 2. Molecular descriptors included both structural (e.g. angle, distance) as well as physico-chemical descriptors where physico-chemical descriptors provided higher correlations to Km for single variable regression.
In the single regression analysis, the physio-chemical descriptors provided higher correlations to Km than the structural terms. For Set 1, ΔGw yielded the highest correlation against Km amongst all the molecular descriptors (Table S4), while HD yielded the highest correlation with Km for Set 2 (Table S5). LogP and SASAside yielded the second highest correlation with Km for Set 1 and Set 2, respectively. The negative coefficients of ΔGw and logP for both sets indicated that increased compound hydrophobicity enhanced affinity (i.e. decreased Km). Consistently, HD yielded a positive coefficient for Set 2, further indicating that polar character reduced affinity.
Amongst the structural descriptors, OC of the angles C19-GS-O3 and O7-AA-C18 yielded the two highest correlations for Set 1. Figure 4 (panel A and B) shows the probability distributions of these two angles for compounds 13 (most potent substrate among all compounds) and 27 (weakest substrate in Set 1). All conformational descriptors, except angles GS-O3-AA and GS-O7-AA, exhibited negative linear coefficients for the OCs in Set 1, indicating that conformational similarity to 13 promoted lower Km value. Angles GS-O3-AA and GS-O7-AA had positive coefficients. However, further analysis showed almost no change in the angle distributions by compounds (Table S4) and poor r2, suggesting these descriptors were not predictive of Km.
Figure 4.

Probability distributions of structural descriptors for Km modeling of Set 1. (A) Angle C19-GS-O3 and (B) angle O7-AA-C18 displayed the two highest single variable correlations amongst all structural descriptors. (C) Angle O7-AA-BC represents spatial orientation of 7-OH, α-acid and the steroidal nucleus. The red line represents the distribution of 13 (most potent substrate of all compounds) and the blue line for 27 (weakest substrate in Set 1). Panels B and C depict the conformational distributions of the topological descriptors in the top two multivariable CSP-SAR models for Set 1.
Structural descriptors did not yield high correlation (r2 ≤ 0.114) with Km for Set 2 as shown in Table S5. Figure S1 (supplemental data) shows the probability distributions of angles O7-C18-GS and O7-C19-GS for 13 (most potent substrate among all compounds) and 18 (weakest substrate in Set 2). These angles were the structural descriptors in single variable regression for Set 2 that exhibited the two best correlations with Km, but correlations are still relatively low.
CSP-SAR Model for Km: Multivariable Regression
For Set 1 and Set 2, 860 and 168 candidate models, respectively, were identified via multivariable regression. Tables 3 and 4 presents the two top models for Set 1 and 2, respectively. AIC was used to rank model fit quality. The best model for Set 1 yielded r2 = 0.926 and Q2 = 0.630, and showed 10.8% probability of being the best model. The best model Set 2 yielded r2 = 0.821 and Q2 = 0.683, and had 13.5% probability of being the best model. The regression plots of the predicted vs. observed Km values are drawn in Figure 5 for Set 1 and Set 2.
Table 3.
Results from multivariable regression and AICC analysis for the selected CSP-SAR models for Km for Set 1. a
| CSP-SAR Models | r2 | Q2 | F | Wi | K (µM) |
A (µM/ kcal/mol) |
B (µM) |
C (µM/m3 /mol) |
D (µM) |
Standardized A (µM/ kcal/mol) |
Standardized B (µM) |
Standardized C (µM/ m3/mol) |
Standardized D (µM) |
|---|---|---|---|---|---|---|---|---|---|---|---|---|---|
| ΔGw, O7-AA-C18, MR, BC-GSmin |
0.926 | 0.630 | 66.1 | 10.8 | − 1460 ± 217 |
−6.59 ± 0.58 |
− 630 ± 137 |
72.4 ± 11 |
327 ± 104 |
−0.780 | −0.456 | 0.390 | 0.329 |
| ΔGw, O7-AA-BC, MR, O7-GSmin |
0.926 | 0.633 | 60.3 | 10.4 | − 1488 ± 214 |
− 6.89 ± 0.60 |
− 591 ± 129 |
73.1 ± 11 |
295 ± 103 |
−0.816 | −0.413 | 0.394 | 0.288 |
A, B, C and D represent the coefficient of the independent variables (molecular descriptors); K represents the coefficient of the intercept; Q2 represents the cross validated r2; F is the test statistic value from the F-test regarding the significance of the model; Wi is percent probability of the model being the best model; Set 1 includes all compounds that were substrates.
Table 4.
Results from multivariable regression and AICC analysis for the selected CSP-SAR models for Km for Set 2. a
| CSP-SAR Model | r2 | Q2 | F | Wi |
K (µM) |
A (µM) |
B (µM) |
C | D | Standardized A (µM) |
Standardized B (µM) |
Standardized C |
Standardized D |
|---|---|---|---|---|---|---|---|---|---|---|---|---|---|
| HD, KierFlex, ΔGw, GS-O3-C18 |
0.821 | 0.683 | 21.7 | 13.5 | − 99.3 ± 17 |
8.03 ± 1.3 |
5.10 ± 1.1 |
− 0.556 ± 0.184 (µM/kcal /mol) |
− 23.2 ± 6.7 (µM) |
0.662 | 0.457 | −0.397 (µM/kcal /mol) |
−0.438 (µM) |
| HD, GS-O7-C18, KierFlex, ΔGw |
0.809 | 0.673 | 20.1 | 6.35 | − 96.7 ± 17 |
7.74 ± 1.4 |
− 18.6 ± 5.8 |
5.10 ± 1.2 (µM) |
− 0.483 ± 0.18 (µM/kcal /mol) |
0.639 | −0.401 | 0.456 (µM) | −0.344 (µM/kcal /mol) |
A, B, C and D represent the coefficient of the independent variables (molecular descriptors); K represents the coefficient of the intercept. Set 2 includes all compounds that were substrates, except the 26 and 27, which were weak substrates.
Figure 5.

Regression plots of predicted vs. observed Km values for anilinyl conjugates of glu-CDCA using CSP-SAR. (A) Using Set 1, the model yielded r2 = 0.926 and Q2 = 0.630. (B) Using Set 2, which excludes compounds 26 and 27 which were the two least potent substrates, the model yielded r2 = 0.821 and Q2 = 0.683.
ΔGw and MR appeared in the two top models for Set 1 with negative and positive coefficients, respectively, indicating hydrophobicity favors transport affinity (Table 3). In these models, coefficients of angles O7-AA-C18 and O7-AA-BC were negative, indicating conformational similarity to 13, promotes activity. Angle O7-AA-C18 is the spatial relationship between 7-OH, α-acid, and C18; angle O7-AA-BC characterizes the spatial orientation of 7-OH, α-acid, and the steroidal nucleus. Figure 4 (panel B and C) depicts the conformational distribution of these two structural descriptors for 13 and 27 (weakest substrate in Set 1). The standardized coefficients for distances BC-GSmin or O7-GSmin, indicated these distances had the least effect on substrate activity.
ΔGw appeared in 395 of the 860 candidate models for Set 1, in part due to the dianionic compound 27. This compound’s weak affinity is explained by its extreme aqueous solvation free energy. For the top two models, the standardized coefficients of ΔGw indicate this descriptor to be the most influential. The role of ΔGw in determining Km is consistent with inhibition results for these conjugates, where ΔGw was also the most significant factor for binding affinity (i.e. Ki).
The two top models for Set 2 included HD, KierFlex and ΔGw (Table 4). The positive coefficient of HD indicated that increased polar character diminished activity. Consistently, the negative coefficient of logP indicated hydrophobicity favors activity. The positive coefficient of KierFlex indicated that substrate flexibility disfavored affinity. The models also contained angle GS-O3-C18 or angle GS-O7-C18. Each showed negative coefficients, indicating conformational similarity to 13 promoted activity. GS-O3-C18 is the angle between the γ-substituent, 3-OH, and C-18, while GS-O7-C18 represents the spatial relationship between the γ-substituent, 7-OH, and C-18. Figure 6 (panels A and B) depicts the conformational distributions for 13 and 18 (weakest substrate in Set 2). While ΔGw was perhaps the dominant parameter for Set 1, in part due to compound 27 all descriptors in Set 2 contributed more equally to explain the Km data, as judged by the similar magnitude coefficients. The predicted Km values of the conjugates in both sets using their respective best model are shown in Table S8 (supplemental data).
Figure 6.

Probability distributions of structural descriptors for Km modeling of Set 2. (A) Angle GS-O3-C18 and (B) angle GS-O7-C18 were the structural descriptors in the best and second best model for Set 2, respectively. Compounds 13 and 18 were the most and least potent substrates in Set 2, respectively.
Figure 7 presents representative conformers for compounds 13, 18, and 27, (red, blue, and green, respectively). The relative orientation of 27 (weakest substrate) is distinctly different from 13 (most potent substrate). Compound 18 is the least potent substrate in Set 2 and was more similar to 13 than was 27.
Figure 7.

Representative conformations of compounds 13, 18, and 27. The most potent substrate (13) is shown in red. The least potent substrate (27) of all compounds is shown in green. Compound 18 is shown in blue and is the least potent substrate in Set 2. The γ-substituent of Compound 27 sample distinctive conformations compared to other compounds. Regarding structural conformation, compound 18 was more similar to 13 than was 27.
CSP-SAR Model for Km/normVmax: Single Variable Regression
Km/normVmax describes the reciprocal of the transporter efficiency. The more familiar form normVmax/Km reflects transporter efficiency, but was not successfully modeled.Compared to Km/normVmax, normVmax/Km was not successful due to the regression effects of assigned Km = 0.1 µM to the most potent substrates, as Km is in the denominator of normVmax/Km but not Km/normVmax.
Interestingly, single variable regression results for Km/normVmax were similar to such results for Km. ΔGw yielded the highest correlation in Set 1 (Table S6 in supplemental data), while HD yielded the highest correlation for Set 2 (Table S7). logP and SASAside yielded the second highest correlation with Km/normVmax for Set 1 and 2, respectively. For each ΔGw, logP, and HD, compound hydrophobicity favored efficiency. The positive coefficient of SASAside indicates that bulky groups beyond C-24 region disfavors activity, in agreement with prior findings 6. OCs of the angles C19-GS- O3 and O7-C19-GS yielded the two highest correlations amongst the structural descriptors for Set 1. Figure 4 (panel A) and Figure 8 presents these angle distributions for 13 and 27. Similar to the results for Km, all conformational descriptors except angles GS-O3-AA and GS-O7-AA exhibited negative linear coefficients for the OC, as expected since similarity to 13 promoted lower Km/normVmax value. Angles GS-O3-AA and GS-O7-AA had positive coefficients in Set 1, but showed almost no change in compound sampling patterns (Table S6) and poor r2.
Figure 8.

Probability distribution of angle O7-C19-GS. O7-C19-GS was the best structural description from single variable analysis for Km/normVmax for Set 1. The red line represents the distribution of 13; the blue line represents the same for 27.
Amongst the structural descriptors, OCs of angles O7-C19-GS and O7-C18-GS yielded the two highest correlations in single variable regression analysis for Set 2. Angle distributions for 13 and 18 are shown in Figure S1. All structural descriptors, except for C19-GS-O7, AA-GS-O3 and GS-O3-AA, yielded negative coefficient, indicating structural similarity with 13 favors activity (Table S7). The poor r2 (< 0.005) of C19-GS-O7, AA-GS-O3 and GS-O3-AA indicated that these angles did not influence conjugate uptake efficiency.
CSP-SAR Model for Km/normVmax: Multivariable Regression
Multivariable regression identified 500 candidate models for Set 1 and 465 candidate models for Set 2. In Table 5, the best model for Set 1 yielded r2 = 0.975 and Q2 = 0.895, and showed 28.9% probability of being the best model. In Table 6, the best model for Set 2 yielded r2 = 0.937 and Q2 = 0.877, and showed 24.7% probability of being the best model. The regression plots of the predicted vs. observed Km/normVmax values are shown in Figure 9 for Set 1 and Set 2.
Table 5.
Results from multivariable regression and AICC analysis for the selected CSP-SAR models for Km/normVmax for Set 1. a
| CSP-SAR Model | r2 | Q2 | F | Wi |
K (µM) |
A (µM/kcal/mol) |
B (µM) |
C (µM/Å2) |
D (µM/Å2) |
Standardized A (µM/kcal/mol) |
Standardized B (µM) |
Standardized C (µM/Å2) |
Standardized D (µM/Å2) |
|---|---|---|---|---|---|---|---|---|---|---|---|---|---|
| ΔGw, O7-AA-C18, PSAside, SASA |
0.975 | 0.895 | 207 | 28.9 | − 1210 ± 140 |
− 9.61 ± 0.42 | − 535 ± 77 |
0.600 ± 0.25 |
0.835 ± 0.13 |
−0.868 | −0.296 | 0.087 | 0.249 |
| ΔGw, O7-AA-C18, SASA, PSA |
0.974 | 0.867 | 197 | 15.1 | − 1218 ± 148 |
− 9.62 ± 0.44 | − 556 ± 82 |
0.828 ± 0.14 |
0.554 ± 0.26 |
−0.869 | −0.307 | 0.247 | 0.081 |
A, B, C and D represent the coefficient of the independent variables (molecular descriptors); K represents the coefficient of the intercept. Set 1 includes all compounds that were substrates.
Table 6.
Results from multivariable regression and AICC analysis for the selected CSP-SAR models for Km/normVmax for Set 2. a
| CSP-SAR Model | r2 | Q2 | F | Wi |
K (µM) |
A (µM) |
B (µM/Å2) |
C (µM/Å2) |
D (µM) |
Standardized A (µM) |
Standardized B (µM/Å2) |
Standardized C (µM/Å2) |
Standardized D (µM) |
|---|---|---|---|---|---|---|---|---|---|---|---|---|---|
| HD, SASAside, SASA, O7-AA-C19 |
0.937 | 0.877 | 71.1 | 24.7 | − 71.9 ± 29 |
26.7 ± 2.6 |
0.454 ± 0.061 |
− 0.346 ± 0.077 |
70.7 ± 23 |
0.629 | 1.24 | −0.976 | 0.432 |
| HD, SASAside, SASA, C19-AA |
0.936 | 0.884 | 69.6 | 19.4 | − 83.2 ± 28 |
27.8 ± 2.7 |
0.422 ± 0.054 |
− 0.313 ± 0.069 |
63.5 ± 21 |
0.656 | 1.15 | −0.884 | 0.379 |
A, B, C and D represent the coefficient of the independent variables (molecular descriptors); K represents the coefficient of the intercept. Set 2 includes all compounds that were substrates, except the 26 and 27, which were weak substrates
Figure 9.

Regression plots of predicted vs. observed Km/normVmax values for anilinyl conjugates of glu-CDCA using CSP-SAR. (A) Using Set 1, the model yielded r2 = 0.975 and Q2 = 0.895. (B) Using Set 2, the model yielded r2 = 0.937 and Q2 = 0.877.
Each ΔGw and SASA appeared in the two top models for Set 1 with negative and positive coefficients, respectively. ΔGw indicated that lipophilicity favored transport efficiency. SASA suggested that bulky ligands disfavored efficiency. Both models also included angle O7-AA-C18, which is the angle involving 7-OH, α-acid and C18. Its negative coefficients indicated conformational similarity to 13 promoted efficiency. Figure 4 (panel B) depicts O7-AA-C18 distribution for 13 and 27. The two top models also included either PSAside and PSA (Table 5). Higher conjugate polar surface area disfavored efficiency. Similar to Km models for Set 1, the standardized coefficients of both models suggested that ΔGw predominated over other descriptors to determine transport efficiency.
The two top models for Set 2 included HD, SASA, and SASAside (Table 6). The positive coefficient of HD indicated that increase in polar character diminished efficiency. The positive coefficient of SASAside indicated bulker C-24 side chain disfavored efficiency. In contrast to SASAside, the negative coefficient of SASA indicated that overall solvent accessible surface area favored efficiency. However, the standardized coefficients indicate that SASA did not impact efficiency as much as SASAside. Each model included either angle O7-AA-C19 or distance C19-AA. Each exhibited a positive coefficient, indicating that similarity with 13 disfavored efficiency, although amongst all the descriptors had the least amount of contribution to the models indicating that activity was mainly explained by physicochemical properties. The predicted Km/normVmax values of the conjugates in both sets using their respective best model are shown in Table S9 (supplemental data).
Logarithmic transformed data was also analyzed [i.e. logKm and log(Km/normVmax)]. Model regression results for logKm for Set 1 and Set 2 are presented in Table S10 and Table S11, respectively (supplemental data). Model regression results for log(Km/normVmax) for Set 1 and Set 2 are presented in Table S12 and Table S13, respectively (supplemental data). Results from logarithmic transformed data agreed with non-logarithmic transformed data analysis, in that increased hydrophobicity enhanced activity. Figure S2 (supplemental data) shows predicted versus observed logKm for Set 1 and Set 2. Figure S3 (supplemental data) shows predicted versus observed log(Km/normVmax) for Set 1 and Set 2.
Conclusion
hASBT is a prodrug target to increase the absorption of drug candidates that otherwise are insufficiently orally absorbed. The objective was to derive a CSP-SAR model for hASBT uptake, since 3D-QSAR models for ASBT substrates are lacking. A congeneric series of 32 aniline and aminopiperidine bile acid conjugates were evaluated. Twenty-seven compounds were substrates. Five were non-substrates. Mono-anionic conjugates were potent substrates, with Km in the same range as Km of native bile acids, and thus supporting C-24 conjugation as a prodrug approach. Among the substrates, ring substituents that increased polarity led to a slight decrease in affinity. Electronic character did not significantly impact affinity. Only monoanions were potent substrates, with preference for the negative charge to be proximal to C-24 for active hASBT uptake. None of the three aminopiperidine conjugates (one cation and two zwitterions) were substrates, although were potent inhibitors. Only one of the three dianionic conjugates was a substrate, but was a weak substrate. Translocation across hASBT is a more elaborate and complex phenomenon than binding to hASBT, such that compounds which were strong inhibitors of ASBT were not found to be strongly translocated if not bearing a single negative charge.
CSP-SAR models successfully explained substrate affinity (i.e. Km) and Km/normVmax, which is the inverse of substrate efficiency. Since Km data for compounds 26 and 27 were around 400–600 fold higher than the rest of the compounds, two parallel sets of analysis were performed; one set included all substrates (Set 1), while the other set excluded 26 and 27 (Set 2). Single variable linear regression analysis showed that physicochemical properties of these compounds yielded better correlation with the various kinetic parameters than the conformational descriptors. Both Km and Km/normVmax yielded successful CSP-SAR models for both sets of compounds. The best CSP-SAR model for Km included two structural and two physiochemical descriptors, where substrate hydrophobicity enhanced affinity. The best CSP-SAR model for Km/normVmax in both Set 1 and Set 2 employed one structural and three physicochemical descriptors, indicating hydrophobicity enhanced efficiency. Notably, the difference in the quality of model fit and the predictive power of the best models between Set 1 and Set 2 was less than 0.105 showing that CSP-SAR method was able to develop robust models for both set of compounds. CSP-SAR models for the substrate requirements were overall guided by conjugate hydrophobic and polar characteristics.
Supplementary Material
Acknowledgements
This work was support in part by National Institutes of Health grants DK67530 and the Computer-Aided Drug Design Center, University of Maryland, Baltimore for computational resources.
Abbreviations
- hASBT
Human apical sodium-dependent bile acid transporter
- CDCA
Chenodeoxycholic acid
- CSP
Conformationally sampled pharmacophore
- 3D–QSAR
three dimensional structural acivity relationship
- MD
Molecular dynamics
- PSA
Polar surface area
- HD
Hydrogen bond donor
- OC
Overlap coefficient
- SASA
Solvent accessible surface area
- MR
Molar refractivity
- MDCK
Madin Darby canine kidney
Footnotes
Supporting Information (SI): LC/MS/MS conditions and computational tables for all synthesized analogues. This material is available free of charge via the internet at http://pubs.acs.org.
REFERENCE
- 1.Dawson PA, Lan T, Rao A. Bile acid transporters. J Lipid Res. 2009;50:2340–2357. doi: 10.1194/jlr.R900012-JLR200. [DOI] [PMC free article] [PubMed] [Google Scholar]
- 2.St-Pierre MV, Kullak-Ublick GA, Hagenbuch B, Meier PJ. Transport of bile acids in hepatic and non-hepatic tissues. J Exp Biol. 2001;204:1673–1686. doi: 10.1242/jeb.204.10.1673. [DOI] [PubMed] [Google Scholar]
- 3.Hagenbuch B, Dawson P. The sodium bile salt cotransport family SLC10. Pflugers Arch. 2004;447:566–570. doi: 10.1007/s00424-003-1130-z. [DOI] [PubMed] [Google Scholar]
- 4.Alrefai WA, Gill RK. Bile acid transporters: structure, function, regulation and pathophysiological implications. Pharm Res. 2007;24:1803–1823. doi: 10.1007/s11095-007-9289-1. [DOI] [PubMed] [Google Scholar]
- 5.Balakrishnan A, Polli JE. Apical sodium dependent bile acid transporter (ASBT, SLC10A2): a potential prodrug target. Mol Pharm. 2006;3:223–230. doi: 10.1021/mp060022d. [DOI] [PMC free article] [PubMed] [Google Scholar]
- 6.Balakrishnan A, Wring SA, Coop A, Polli JE. Influence of charge and steric bulk in the C-24 region on the interaction of bile acids with human apical sodium-dependent bile acid transporter. Mol Pharm. 2006;3:282–292. doi: 10.1021/mp0600135. [DOI] [PMC free article] [PubMed] [Google Scholar]
- 7.Lack L. Properties and biological significance of the ileal bile salt transport system. Environ Health Perspect. 1979;33:79–89. doi: 10.1289/ehp.793379. [DOI] [PMC free article] [PubMed] [Google Scholar]
- 8.Swaan PW, Szoka FC, Jr, Oie S. Molecular modeling of the intestinal bile acid carrier: a comparative molecular field analysis study. J Comput Aided Mol Des. 1997;11:581–588. doi: 10.1023/a:1007919704457. [DOI] [PubMed] [Google Scholar]
- 9.Baringhaus KH, Matter H, Stengelin S, Kramer W. Substrate specificity of the ileal and the hepatic Na(+)/bile acid cotransporters of the rabbit. II. A reliable 3D QSAR pharmacophore model for the ileal Na(+)/bile acid cotransporter. J Lipid Res. 1999;40:2158–2168. [PubMed] [Google Scholar]
- 10.Balakrishnan A, Wring SA, Polli JE. Interaction of native bile acids with human apical sodium-dependent bile acid transporter (hASBT): influence of steroidal hydroxylation pattern and C-24 conjugation. Pharm Res. 2006;23:1451–1459. doi: 10.1007/s11095-006-0219-4. [DOI] [PMC free article] [PubMed] [Google Scholar]
- 11.Bernard D, Coop A, MacKerell AD., Jr 2D conformationally sampled pharmacophore: a ligand-based pharmacophore to differentiate delta opioid agonists from antagonists. J Am Chem Soc. 2003;125:3101–3107. doi: 10.1021/ja027644m. [DOI] [PubMed] [Google Scholar]
- 12.Bernard D, Coop A, MacKerell AD., Jr Quantitative conformationally sampled pharmacophore for delta opioid ligands: reevaluation of hydrophobic moieties essential for biological activity. J Med Chem. 2007;50:1799–1809. doi: 10.1021/jm0612463. [DOI] [PMC free article] [PubMed] [Google Scholar]
- 13.Bernard D, Coop A, MacKerell AD., Jr Conformationally sampled pharmacophore for peptidic delta opioid ligands. J Med Chem. 2005;48:7773–7780. doi: 10.1021/jm050785p. [DOI] [PubMed] [Google Scholar]
- 14.Gonzalez PM, Acharya C, Mackerell AD, Jr, Polli JE. Inhibition requirements of the human apical sodium-dependent bile acid transporter (hASBT) using aminopiperidine conjugates of glutamyl-bile acids. Pharm Res. 2009;26:1665–1678. doi: 10.1007/s11095-009-9877-3. [DOI] [PMC free article] [PubMed] [Google Scholar]
- 15.Rais RC, Acharya AD, MacKerell JE, Jr, Polli JE. Molecular switch controlling the binding of anionic bile acid conjugates by hASBT. J Med Chem. 2009;53:4749–4760. doi: 10.1021/jm1003683. [DOI] [PMC free article] [PubMed] [Google Scholar]
- 16.Balakrishnan A, Sussman DJ, Polli JE. Development of stably transfected monolayer overexpressing the human apical sodium-dependent bile acid transporter (hASBT) Pharm Res. 2005;22:1269–1280. doi: 10.1007/s11095-005-5274-8. [DOI] [PubMed] [Google Scholar]
- 17.Rais R, Gonzalez PM, Zheng X, Wring SA, Polli JE. Method to screen substrates of apical sodium-dependent bile acid transporter. AAPS J. 2008;10:596–605. doi: 10.1208/s12248-008-9069-9. [DOI] [PMC free article] [PubMed] [Google Scholar]
- 18.Balakrishnan A, Hussainzada N, Gonzalez P, Bermejo M, Swaan PW, Polli JE. Bias in estimation of transporter kinetic parameters from overexpression systems: Interplay of transporter expression level and substrate affinity. J Pharmacol Exp Ther. 2007;320:133–144. doi: 10.1124/jpet.106.107433. [DOI] [PubMed] [Google Scholar]
- 19.Brooks BR, Brooks CL, III, MacKerell AD, Jr, Nilsson L, Petrella RJ, Roux B, Won Y, Archontis G, Bartels C, Boresch S, Caflisch A, Caves L, Cui Q, Dinner AR, Feig M, Fischer S, Gao J, Hodoscek M, Im W, Kuczera K, Lazaridis T, Ma J, Ovchinnikov V, Paci E, Pastor RW, Post CB, Pu JZ, Schaefer M, Tidor B, Venable RV, Woodcock HL, Wu X, Yang W, York DM, Karplus M. CHARMM: The biomolecular simulation program. J. Comp. Chem. 2009;30:1545–1614. doi: 10.1002/jcc.21287. [DOI] [PMC free article] [PubMed] [Google Scholar]
- 20.Vanommeslaeghe K, Hatcher E, Acharya C, Kundu S, Zhong S, Shim J, Darian E, Guvench O, Lopes P, Vorobyov I, MacKerell AD., Jr CHARMM General Force Field (CGenFF): A force field for drug-like molecules compatible with the CHARMM all-atom additive biological force fields. J Comp Chem. 2009 doi: 10.1002/jcc.21367. (Epub ahead of print) [DOI] [PMC free article] [PubMed] [Google Scholar]
- 21.Feig M, Karanicolas J, Brooks CL., 3rd MMTSB Tool Set: enhanced sampling and multiscale modeling methods for applications in structural biology. J Mol Graph Model. 2004;22:377–395. doi: 10.1016/j.jmgm.2003.12.005. [DOI] [PubMed] [Google Scholar]
- 22.Garcia AE, Sanbonmatsu KY. Exploring the energy landscape of a beta hairpin in explicit solvent. Proteins. 2001;42:345–354. doi: 10.1002/1097-0134(20010215)42:3<345::aid-prot50>3.0.co;2-h. [DOI] [PubMed] [Google Scholar]
- 23.Sugita Y, Okamoto Y. Replica-exchange Molecular Dynamics Method for Protein Folding. Chem Phys Lett. 1999;314:141–151. [Google Scholar]
- 24.Allen MP, Tildesley DJ. Computer simulation of liquids. Oxford: Clarendon Press; 1987. p. 385. [Google Scholar]
- 25.Lee MS, Feig M, Salsbury FR, Brooks CL. New analytic approximation to the standard molecular volume definition and its application to generalized born calculations. Journal of Computational Chemistry. 2003;24:1348–1356. doi: 10.1002/jcc.10272. [DOI] [PubMed] [Google Scholar]
- 26.Lee MS, Salsbury FR, Brooks CL. Novel generalized Born methods. Journal of Chemical Physics. 2002;116:10606–10614. [Google Scholar]
- 27.Ryckaert JP, Ciccotti G, Berendsen JC. Numerical integration of the cartesian equations of motion of a system with constraints: molecular dynamics of n-alkanes. Journal of Computational Physics. 1977;23:327–341. [Google Scholar]
- 28.Hawkins GD, Giesen DJ, Lynch GC, Chambers CC, Rossi I, Storer JW, Li J, Zhu T, Thompson JD, Winget P, et al. AMSOL Version 6.8. Minneapolis, MN: University of Minnesota; [Google Scholar]
- 29.Lee B, Richards FM. The interpretation of protein structures: estimation of static accessibility. J Mol Biol. 1971;55:379–400. doi: 10.1016/0022-2836(71)90324-x. [DOI] [PubMed] [Google Scholar]
- 30.Chothia C. Structural invariants in protein folding. Nature. 1975;254:304–308. doi: 10.1038/254304a0. [DOI] [PubMed] [Google Scholar]
- 31.Auffinger P, Hays FA, Westhof E, Ho PS. Halogen bonds in biological molecules. Proc Natl Acad Sci U S A. 2004;101:16789–16794. doi: 10.1073/pnas.0407607101. [DOI] [PMC free article] [PubMed] [Google Scholar]
- 32.Panigrahi SK, Desiraju GR. Strong and weak hydrogen bonds in the protein-ligand interface. Proteins. 2007;67:128–141. doi: 10.1002/prot.21253. [DOI] [PubMed] [Google Scholar]
- 33.Berski S, Ciunik Z, Drabent K, Latajka Z, Panek J. Dominant role of C-Br---N halogen bond in molecular self-organization Crystallographic and quantum-chemical study of schiff-base-containing triazoles. Journal of Physical Chemistry B. 2004;108:12327–12332. [Google Scholar]
- 34.Acharya C, Seo PR, Polli JE, MacKerell AD., Jr Computational model for predicting chemical substituent effects on passive drug permeability across parallel artificial membranes. Mol Pharm. 2008;5:818–828. doi: 10.1021/mp800035h. [DOI] [PMC free article] [PubMed] [Google Scholar]
- 35.Hanke PR, Timm P, Falk G, Kramer W. Behavior of different suture materials in the urinary bladder of the rabbit with special reference to wound healing, epithelization and crystallization. Urol Int. 1994;52:26–33. doi: 10.1159/000282565. [DOI] [PubMed] [Google Scholar]
- 36.Discovery Studio, Accelrys Inc. ( http://www.accelrys.com/dstudio).
- 37.Schroeder LD, Sjoquist DL, Stephan PE. Understanding regression analysis: an introductory guide. Sage Publications; 1986. [Google Scholar]
- 38.Olobatuyi ME. A user’s guide to path analysis. University Press of America; 2006. [Google Scholar]
- 39.Akaike H. Likeliood of a Model and Information Criteria. Journal of Econometrics. 1981;16:3–14. [Google Scholar]
- 40.McQuarrie ADR, Tsai CL. Regression and Time Series Model Selection. Singapore: World Scientific; 1998. [Google Scholar]
- 41.Balakrishnan A, Wring SA, Polli JE. Interaction of native bile acids with human apical sodium-dependent bile acid transporter (hASBT): Influence of steroidal hydroxylation pattern and C-24 conjugation. Pharmaceutical Research. 2006;23:1451–1459. doi: 10.1007/s11095-006-0219-4. [DOI] [PMC free article] [PubMed] [Google Scholar]
Associated Data
This section collects any data citations, data availability statements, or supplementary materials included in this article.