

Abstract
Purpose
There are few validated relapse prediction biomarkers for epithelial ovarian cancer (EOC). We have shown progranulin (PGRN) and secretory leukocyte protease inhibitor (SLPI) are up regulated, overexpressed survival factors in EOC. We hypothesized they would predict presence of occult EOC.
Methods
PGRN, SLPI, and the known biomarker HE4 were measured in EOC patient plasma samples, prospectively collected every 3 months from initial remission until relapse. Clinical data and CA125 results were incorporated into statistical analyses. Exploratory Kaplan-Meier estimates, dividing markers at median values, evaluated association with progression-free survival (PFS) and overall survival (OS). Area-under-the-curve (AUC) statistics were computed from receiver operating characteristic (ROC) curves to evaluate discrimination ability. A Cox proportional hazards model assessed the association between PFS, OS, and biomarkers, adjusting for clinical prognostic factors.
Results
Samples from 23 advanced stage EOC patients were evaluated. PGRN at 3 months was the only biomarker independently associated with PFS (P<0.0001) and OS (P<0.003). When used to predict progression by 18 months, sensitivity and specificity were 93% and 100%, respectively, with AUC = 0.944. The Cox model hazard ratio for PFS, divided at 59 ng/ml by ROC analysis and adjusted for clinical factors, was 23.5 (95% CI: 2.49–220). Combinations with SLPI, HE4, and/or CA125 did not improve the model.
Conclusions
We report pilot data indicating a potential independent association of PGRN on EOC patient PFS and OS. A validation study will be required to confirm this finding and to inform whether PGRN warrants evaluation as a potential screening biomarker.
Keywords: Progranulin (PGRN), biomarkers, progression free survival, overall survival, epithelial ovarian cancer
INTRODUCTION
Epithelial ovarian cancer (EOC) is the most lethal gynecology malignancy and the fifth most common cause of cancer-related deaths in women in the United States [1]. Although 5-year survival has improved steadily to 46% according to most recent SEER data [2], this can be attributed to the application of aggressive cytoreductive surgery and combination chemotherapy, including intraperitoneal administration, rather than early detection of identification of women at high risk for early relapse. Early detection of EOC still remains problematic, because a potential biomarker requires extraordinarily high specificity, given the low prevalence of EOC in the general population [3]. Over 75% of women are diagnosed with advanced disease FIGO stage III/IV, and the majority will relapse and die of their disease [1, 4, 5]. Therefore, there is increasing interest in identifying early indicators of relapse in the high grade, advanced stage EOC patient population as a means to further improve progression-free (PFS) and overall survival (OS) by optimizing therapeutic management [6–8]. It is proposed that biomarkers of minimal residual disease may have value if applied towards early detection of the same generally high grade disease.
The serum CA125 concentration has been established as an important biomarker for surveillance of EOC recurrence [9]. The whey acidic protein (WAP), human epididymis protein 4 (HE4), was approved by the FDA recently as an aid in monitoring EOC recurrence. HE4 has been examined both as a screening biomarker and as a predictor of recurrence [10]. It has been shown to have limited overlap with benign gynecologic and other diseases, unlike CA125 [10, 11]; HE4 is expressed in 50% of clear cell EOC and not in mucinous ovarian carcinomas [11], yielding non-overlapping activity. However, even the two together have not yet been shown to be adequate for screening and they do not predict a priori recurrence.
Secretory leukocyte protease inhibitor (SLPI), also a WAP protein, is made up of two WAP domains with a 4-disulfide core, similar to HE4. Both proteins are located at chromosomal region 20q12-13.1, and are amplified in EOC [12]. We have demonstrated that SLPI is a proliferation and survival factor for EOC and it has been associated with aggressive and malignant ovarian tumors in a protease-inhibitor independent fashion [13–15]. In addition, SLPI was also found to antagonize paclitaxel cytotoxicity in ovarian cancer [14]. Progranulin (PGRN), found on chromosome 17q and upregulated in EOC, is a growth and survival factor for both normal and cancer cells, and promotes angiogenesis and invasion. [16–26]. PGRN partners with SLPI where SLPI prevents neutrophil elastase from cleaving PGRN into pro-inflammatory granulins, and maintaining its survival activity [15, 27]. Neutralizing and silencing studies have demonstrated that SLPI functions as a survival chaperone for PGRN [15].
SLPI has been proposed as a biomarker for ovarian cancer diagnosis and screening, because of its amplification and overexpression, but not as a predictor of recurrence [13, 28–32]. We prospectively collected serial blood samples during every 3 month monitoring from women with advanced stage EOC who had attained a complete clinical remission after initial surgical debulking and platinum/taxane adjuvant chemotherapy. We tested these samples in a blinded fashion in a post-hoc exploratory biomarker study of PRGN and SLPI with CA125 and HE4 as controls. We report the discriminatory potential of PGRN to predict patients who will recur within 18 months of completion of chemotherapy and for whom PFS and OS may be significantly shortened.
MATERIALS AND METHODS
Patients and clinical data collection
National Cancer Institute Institutional Review Board approval was obtained to examine plasma samples previously collected during a prospective remission monitoring protocol (NCT00020033). Participating women had advanced stage EOC, were in first complete clinical remission (CCR: negative clinical examination, CT imaging, and normal CA125) after debulking surgery and platinum/taxane adjuvant chemotherapy, and entered the monitoring trial within 9 weeks of completion of therapy. Patients were followed with history and physical examination, routine laboratory evaluation, chest/abdomen/pelvis CT scan, CA125, and collection of research samples 1 and 3 months after study entry, and every 3 months for at least the first 3 years, every 6 months for the subsequent 2 years, then annually after 5 years on study.
Clinical data were recorded prospectively in the protocol database and included patient age, race, FIGO stage, histology and grade, clinical examination, CA125 concentration, and imaging results at each visit. All patients were followed to recurrence, defined by biopsy-confirmed disease or to last follow-up, prior to December 2009. Duration of PFS was defined as the interval between documentation of CCR and confirmation of disease recurrence by a tissue biopsy or continued CCR as of last follow- up.
Samples and ELISA assays
EDTA plasma samples were collected and plasma collected, aliquoted, and frozen within 4 hours of receipt and stored at −80°C until use; no freeze and thaw of samples was permitted. The samples were number-coded and results blinded to the operator. Plasma PGRN and SLPI concentrations were determined using a commercially available research ELISA kit (R&D Systems, Minneapolis, MN). Plasma HE4 was measured using the FDA-approved clinical ELISA assay (Fujirebio Diagnostics, Malvern, PA). Controls and samples were run in triplicate to assure consistency and intra-sample variability was assessed. The overall coefficient of variability (CV) between samples was ≤10% with mean CV of SLPI, PGRN, and HE4 of 6% (range 1–15%), 9% (1–19%), and 8% (2–18%), respectively.
Statistical analyses
The relationship between biomarkers at CCR or at 3 months after CCR, and PFS or OS was explored by Kaplan-Meier curves, with parameters divided at the median or at pre-specified divisions defined by two standard deviations (2SD) above the mean specified by the manufacturer’s published reference cohort. The significance of the difference between pairs of Kaplan-Meier curves was determined by a two-tailed log-rank test. A Cox proportional hazards model was used to assess the association between PFS and biomarker levels adjusting for clinical prognostic factors. Logistic regression analyses were performed on individual markers with potentially prognostic clinical factors, and on different biomarker combinations to examine their association with progression by 18 months. Receiver operating characteristic (ROC) curves were plotted, and area-under-the-curve (AUC) statistics were computed to explore the best cutoff value for PGRN that may be associated with predicting progression by the fixed time points of 12 months, 16 months (median for this cohort), and 18 months before relapse. The 12 and 18 months periods have been defined in the gynecologic oncology community as time-to-recurrence cut-offs for secondary surgical debulking [33]. The biomarker intervals were selected around the experimental median to assure a reasonable number of recurrences for examination. PGRN was re-examined using intervals defined by the ROC analysis.
All statistical tests are two-sided, and presented without adjustment for multiple comparisons. P values of less than 0.05 were considered to be statistically significant. Analyses were conducted using SAS version 8.2 (SAS institute, Cary, NC), with exception of ROC curves and AUC statistics, which were done using SPSS version 17.0 (SPSS Inc., Chicago, IL).
RESULTS
Patients
Twenty-three patients in first CCR were enrolled between December 2000 and April 2005 (characteristics, Table 1). All patients were found to have been optimally debulked (<1cm residual) upon chart review. A total of 246 plasma samples were evaluated. The median PFS and OS were 15.4 months (range, 3–96) and 54 months (10–96), respectively, with median follow up of 16 months (6–96). Known clinical prognostic factors such as age, grade, and stage were incorporated into the analyses. Over 90% of patients had Stage III grade 3 EOC of different histological types.
Table 1.
Patient demographics and clinical characteristics.
| Characteristics | No. of patients (%) |
|---|---|
| Race | |
| African-American | 1 (4.3) |
| Caucasian | 22 (95.6) |
| Age, yrs | |
| Mean | 52 (range 42–77) |
| Ovarian cancer stage | |
| Stage III | 21 (91) |
| Stage IV | 2 (9) |
| Type of adenocarcinoma | |
| Papillary serous | 12 (52) |
| Endometrioid | 2 (9) |
| Clear cell | 2 (9) |
| Transitional | 1 (4) |
| Mixed | 4 (17) |
| Not otherwise classified | 2 (9) |
| Histologic grade | |
| 2 | 1 (4) |
| 3 | 22 (96) |
PGRN is a predictor of PFS and OS
Initially, PGRN, SLPI, HE4 and CA125 were considered individually for their relationship to PFS using Kaplan-Meier analyses, dividing the cohorts at the sample median and 2SD above the mean. HE4 and CA125 were not associated with recurrence of EOC, testing individual values at study entry and 3 and 6 months from CCR. HE4 and CA125 functioned as monitoring biomarkers of disease progression, changing over time as a herald of potential relapse. In patients who relapsed, CA125 began to change 3 months (median, range 0–8) prior to clinical recurrence in 50% of the patients (sensitivity 50%, specificity 100%). Other relapsed patients did not have elevated CA125 concentration at the time of clinical progression. HE4 concentrations were considered positive if there was at least a 25% increase from the previous value according to the clinical parameters defined by the manufacturer (Fujirebio Diagnostics, Malvern, PA). The test was a positive indicator at a median of 3 months (range 0–8) prior to clinical relapse in 83% of patients. SLPI concentrations which were higher than the 36 ng/ml median of this experimental cohort at 3 months was associated with shorter PFS (P = 0.0063). However, this SLPI concentration is within the normal range defined from 40 random blood samples by the manufacturer (average 40ng/ml [range 29–51]; R&D Systems, Minneapolis, MN), complicating interpretation and use of SLPI as a predictor.
The 3 month value of PGRN was significantly associated with PFS when patients were grouped using the experimental PGRN median of 59.4ng/ml (P<0.0001) as well as 2SD above the mean of normal samples defined by the manufacturer (66ng/ml, P=0.0002; defined mean 44.2ng/ml [range 27.4–67.2]). PGRN was next evaluated by ROC analysis to define the best cut-off value for definition of recurrence at a fixed time point within this experimental cohort.
Optimization of the PGRN cut-off value
ROC curve analysis was performed to identify the optimal PGRN discrimination cut-point. Data were examined at the PFS median (16 months) and at 12 and 18 months (Figure 1 and Table 2). The cut-off value, which was also identified using logistic regression, was defined as 59ng/ml, with an AUC of 0.944 as an indicator of predictive ability at 18 months with a sensitivity of 93% and specificity of 100%, PPV of 100% and NPV of 90%. Kaplan-Meier curve analyses were revisited to evaluate PGRN as predictive of PFS and OS at this experimentally defined cut-point (Figure 2), showing PGRN was significantly associated with both PFS (P<0.0001) and OS (P<0.003). Figure 2A presents the Kaplan-Meier estimates of PFS when patients were grouped using a PGRN concentration ≤59ng/ml as a cut-off. The 5-year PFS rates for patients with a PGRN concentration at this ROC-defined cut off value were 60% compared to 0% for PGRN >59ng/ml (P<0.0001, log-rank test for overall difference). Elevated circulating PGRN at this cut-off also significantly discriminated poor OS as shown in Figure 2B (P<0.003).
Figure 1. ROC curve analysis identifies the best cut-off value of PGRN at 3 months.

A. Ovarian cancer recurrence before 12 months (AUC = 0.825). B. Ovarian cancer recurrence before 16 months (median; AUC = 0.848). C. Ovarian cancer recurrence before 18 months (AUC = 0.944). AUC = area under the curve.
Table 2.
ROC Analysis
| Time | Best cut point | AUC | Sensitivity | Specificity |
|---|---|---|---|---|
| 12 Months | 69 ng/ml | 0.825 | 87.5% | 80.0% |
| 16 Months (median) | 59 ng/ml | 0.848 | 91.7% | 81.8% |
| 18 Months | 59 ng/ml | 0.944 | 92.9% | 100% |
Figure 2. Kaplan-Meier analyses of PGRN using best cut-off value defined by the ROC curve.
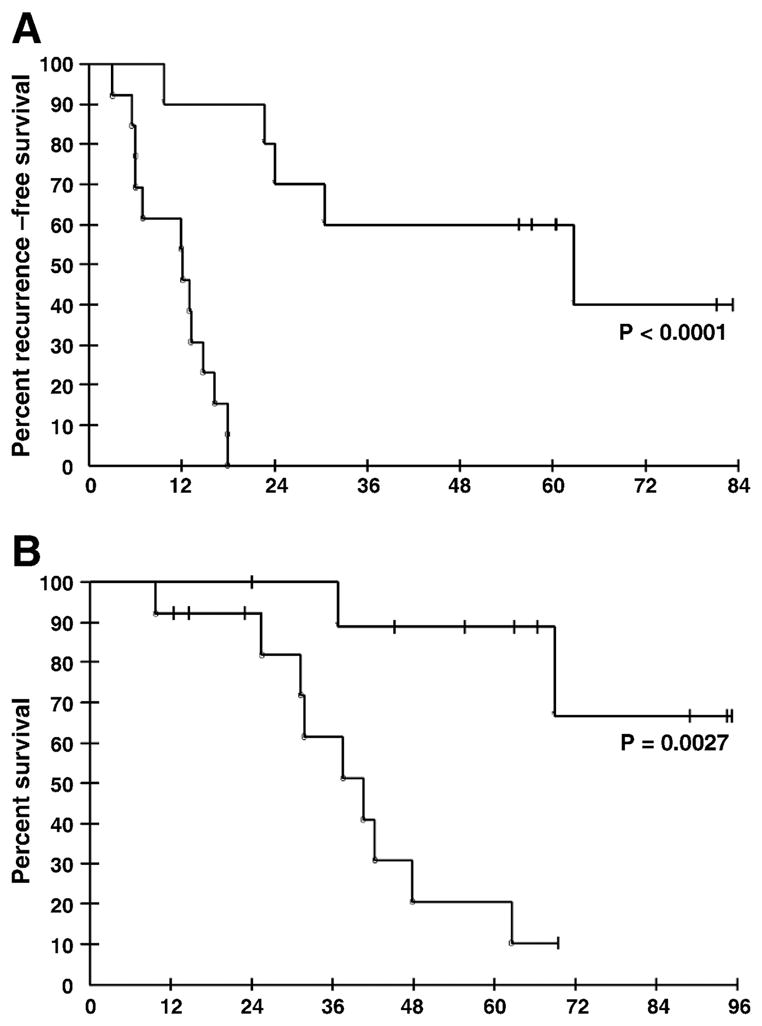
A. PFS according to PGRN concentration at 3 months. The PFS for the PGRN high group was 12 months and PGRN low group was 46.5 months. B. OS according to PGRN concentrations at 3 months.
PGRN is an independent predictor of PFS
A Cox proportional hazards model analysis was performed to examine the independence of PGRN when considered with other biomarkers and clinical parameters. The association between 3-month PGRN <59 and PFS was very strong when adjusted for other covariates with HR=23.5 (95% confidence interval CI: 2.49–221; P<0.006; see Table 3). All other variables (age, stage, and tumor grade) and markers (CA125, HE4, and SLPI) examined were not significantly associated with PFS in this otherwise homogeneous population. PGRN was significant for OS by univariate Kaplan Meier analysis (P<0.003), with a trend for this association by Cox multivariate OS model (P=0.10). This was due to the limited analytical power of only 11 total deaths in our patient cohort and inclusion of multiple clinical parameters with PGRN and other markers in the analyses. However, consistent with the Kaplan-Meier and log-rank test results, a Cox proportional hazards model including PGRN alone showed this parameter to be significant in its association with overall survival (HR 7.80; 95% CI: 1.64–37.1; p=0.01).
Table 3.
Cox proportional hazards model for PFS.
| Parameter and cut-off values | Hazard ratio (95% CI) | P value |
|---|---|---|
| Age, years ≤ 52 vs. >52 (median) | 1.236 (0.390–3.922) | 0.72 |
| Stage IIIa/b vs. IIIc/IV | 0.402 (0.121–1.34) | 0.14 |
| CA125 *(> 10 U/ml vs. ≤ 10 U/ml) | 1.923 (0.594–6.229) | 0.28 |
| SLPI (<=36 ng/ml vs. >36 ng/ml) | 1.566 (0.418–5.869) | 0.51 |
| HE4 (<=74 pM vs. >74 pM) | 1.973 (0.609–6.386) | 0.26 |
| PGRN (<=59 ng/ml vs. >59 ng/ml) | 23.458 (2.49–221) | 0.0058 |
CA125, SLPI, HE4, and PGRN values at 3 months
DISCUSSION
Many biomarkers have been proposed as prognostic indicators of EOC patient survival [34]. However, limited value has been observed by their addition to the current biomarker repertoire. We hypothesized that evaluation of survival-associated proteins as potential blood-based biomarkers indicative of minimal residual disease may be prognostic of both PFS and OS. We elected to examine a secreted protein pair, SLPI and PGRN, in recognition of their potent pro-survival and dissemination activity in EOC [13–16, 18, 19, 25]. SLPI, a relative of HE4, was of interest but did not reach the level of importance and independence of its partner protein, PGRN. The isolated value of PGRN at a time at which the patient was expected to have the lowest occult tumor burden and the least potential for chemotherapy bias, the point of initial clinical complete remission at discontinuation of adjuvant therapy, was a potent and independent predictor of poor PFS and OS in this high grade advanced stage cohort. No added value was found when the FDA-approved biomarkers CA125 [9] and HE4 [10] were examined with PGRN and/or SLPI. Further studies should include validation of this finding in remission prediction, and examination of PGRN in pre-diagnostic sera where its signal of occult disease may be useful in development of a screening tool for aggressive subtype EOC.
Several reports have suggested that the absolute concentration of serum CA125 may be a prognostic marker of relapse and death, even when CA125 is within the normal range. Patients with normal CA125 were divided into arbitrary groups based upon on their CA125 nadir (10 vs. 11–20 vs. 21–35U/ml) [35–38]. Prat et. al showed an absolute increase of CA125 of 5U/ml over baseline significantly predicted recurrence of advanced EOC with a median lead time of 58 days in patient cohorts similar to ours [39]. We did not observe this in Kaplan Meier analyses at the CA125 median of 12U/ml or at 10U/ml (P=0.24 and 0.51, respectively). Our study included only patients in clinical remission, and therefore had a limited CA125 dynamic range. Recently, Rustin et al. reported a physician’s knowledge of and response to a rising CA125 had no impact on ovarian cancer survival [24, 40]. We found that the single value of PGRN at 3 months clinical response is significantly elevated in patients who recur before 18 months from CCR after chemotherapy. This discovery is different from other markers such as HE4 and CA125, that monitor recurrence by observing change in concentration as disease progresses. These findings could be combined for patient stratification in trials of maintenance therapy versus monitoring for high recurrence risk women.
Our exploratory study found the remission value of PGRN is an independent biomarker predictive of PFS less than 18 months and poor OS in patients what would be a good prognosis CCR group of patients. This 3 month time point was selected to minimize biomarker bias due to recent chemotherapy exposure. These results complement our prior findings of high PGRN gene and protein expression in serous stage III ovarian cancers compared with serous borderline ovarian tumors [19, 25] and a related report that increased PGRN expression in ovarian cancer, tumor stroma, and metastases was associated with poor clinical outcome [25]. Pizarro et al. demonstrated an association between PGRN overexpression and a tumor promoting phenotype in ovarian cancer, showing PGRN protects ovarian cancer cells from chemotherapy-associated tumor injury [26]. Tumor PGRN expression was also recently correlated with poor outcome in a third study. Cuevas-Antonio et al. showed that patients with high mRNA progranulin expression in their corresponding ovarian tumor specimens had significantly worse OS compared to patients exhibiting low-progranulin mRNA levels [41]. Thus, both circulating PGRN as shown in our findings, and tumor PGRN expression are important prognostic tools with which to predict poor EOC outcome.
We along with others have shown SLPI to be important biochemically and have demonstrated that SLPI is over-expressed and amplified in ovarian cancer [3, 13–15, 28–32]. Patients in this study with higher SLPI concentrations had significantly shorter PFS on Kaplan-Meier analyses. However, this cut-off concentration was within the range of the normal population provided by the kit manufacturer, defined by 40 random blood samples. Therefore, we conclude that SLPI may not have strength as a biomarker discriminant. We suggest, though, that the definition of the normal range for SLPI may need to be reexamined to provide a normal range more reflective of women in this age group. Although SLPI may not function as a prognostic biomarker, its biochemical function to protect and partner with PGRN makes it of biological interest. Biomarker positivity of PGRN, with its known biochemical pro-survival interaction with SLPI, may also identify a group of patients who may benefit from SLPI-targeted therapy, which is credentialed but not yet ready for clinical application [13–15]. Addition of SLPI to PGRN in our biomarker analysis did not add further value to the PGRN findings.
Although this is a small post-hoc study of 23 patients, this cohort comprises a relatively homogeneous population of advanced stage high-grade EOC patients who had optimal cytoreductive surgery and platinum/taxane-based chemotherapy. This is a cohort for whom early and frequent recurrence is expected and is confirmed with the cohort median PFS of 16 months. The median PFS and OS were comparable to those of the report of Prat et al. that examined 96 patients with similar clinical characteristics [38, 39]. The unexpected findings of strong statistically significant merit of the initial PGRN value, and absence of utility of CA125, HE4, or combinations, suggests that either this is an unusually biased subset of otherwise unselected patients, or that this is a new and potentially valuable finding. These exploratory analyses will require independent validation. ROC analyses should be revisited to confirm the optimal cut-off value in a larger cohort. Validation of this finding can lead to consideration of PGRN as a discriminant with which to stratify high-risk patients in a maintenance clinical trial setting. The high initial PGRN concentration at the time of presumed optimal surgical and chemical cytoreduction is predictive of poor outcome and leads to the hypothesis that it also may be a marker of occult high-grade disease. We also will be examining PGRN in a pre-diagnostic sample set to assess its potential value in screening and early diagnosis of the aggressive high-grade tumors.
Acknowledgments
This research was supported by the Intramural Research Program of the NIH, National Cancer Institute, Center for Cancer Research.
Footnotes
CONFLICT OF INTEREST STATEMENT
The authors declare that there are no conflicts of interest.
References
- 1.Jemal A, Siegel R, Ward E, Hao Y, Xu J, Thun MJ. Cancer statistics, 2009. CA Cancer J Clin. 2009;59:225–49. doi: 10.3322/caac.20006. [DOI] [PubMed] [Google Scholar]
- 2.Horner MJ, Ries LAG, Krapcho M, Neyman N, Aminou R, Howlader N. SEER Cancer Statistics Review, 1975–2006. Bethesda: National Cancer Institute; 2009. [Google Scholar]
- 3.Anderson GL, McIntosh M, Wu L, Barnett M, Goodman G, Thorpe JD, et al. Assessing lead time of selected ovarian cancer biomarkers: a nested case-control study. J Natl Cancer Inst. 2010;102:26–38. doi: 10.1093/jnci/djp438. [DOI] [PMC free article] [PubMed] [Google Scholar]
- 4.Heintz AP, Odicino F, Maisonneuve P, Quinn MA, Benedet JL, Creasman WT, et al. Carcinoma of the ovary. FIGO 6th Annual Report on the Results of Treatment in Gynecological Cancer. Int J Gynaecol Obstet. 2006;95 (Suppl 1):S161–92. doi: 10.1016/S0020-7292(06)60033-7. [DOI] [PubMed] [Google Scholar]
- 5.Tummala MK, McGuire WP. Recurrent ovarian cancer. Clin Adv Hematol Oncol. 2005;3:723–36. [PubMed] [Google Scholar]
- 6.Riedinger JM, Bonnetain F, Basuyau JP, Eche N, Larbre H, Dalifard I, et al. Change in CA 125 levels after the first cycle of induction chemotherapy is an independent predictor of epithelial ovarian tumour outcome. Ann Oncol. 2007;18:881–5. doi: 10.1093/annonc/mdl500. [DOI] [PubMed] [Google Scholar]
- 7.Riedinger JM, Wafflart J, Ricolleau G, Eche N, Larbre H, Basuyau JP, et al. CA 125 half-life and CA 125 nadir during induction chemotherapy are independent predictors of epithelial ovarian cancer outcome: results of a French multicentric study. Ann Oncol. 2006;17:1234–8. doi: 10.1093/annonc/mdl120. [DOI] [PubMed] [Google Scholar]
- 8.Sabbatini P, Spriggs DR. Consolidation for ovarian cancer in remission. J Clin Oncol. 2006;24:537–9. doi: 10.1200/JCO.2005.04.5138. [DOI] [PubMed] [Google Scholar]
- 9.Bast RC, Jr, Klug TL, St John E, Jenison E, Niloff JM, Lazarus H, et al. A radioimmunoassay using a monoclonal antibody to monitor the course of epithelial ovarian cancer. N Engl J Med. 1983;309:883–7. doi: 10.1056/NEJM198310133091503. [DOI] [PubMed] [Google Scholar]
- 10.Hellstrom I, Raycraft J, Hayden-Ledbetter M, Ledbetter JA, Schummer M, McIntosh M, et al. The HE4 (WFDC2) protein is a biomarker for ovarian carcinoma. Cancer Res. 2003;63:3695–700. [PubMed] [Google Scholar]
- 11.Drapkin R, von Horsten HH, Lin Y, Mok SC, Crum CP, Welch WR, et al. Human epididymis protein 4 (HE4) is a secreted glycoprotein that is overexpressed by serous and endometrioid ovarian carcinomas. Cancer Res. 2005;65:2162–9. doi: 10.1158/0008-5472.CAN-04-3924. [DOI] [PubMed] [Google Scholar]
- 12.Tanner MM, Grenman S, Koul A, Johannsson O, Meltzer P, Pejovic T, et al. Frequent amplification of chromosomal region 20q12-q13 in ovarian cancer. Clin Cancer Res. 2000;6:1833–9. [PubMed] [Google Scholar]
- 13.Devoogdt N, Rasool N, Hoskins E, Simpkins F, Tchabo N, Kohn EC. Overexpression of protease inhibitor-dead secretory leukocyte protease inhibitor causes more aggressive ovarian cancer in vitro and in vivo. Cancer Sci. 2009;100:434–40. doi: 10.1111/j.1349-7006.2009.01076.x. [DOI] [PMC free article] [PubMed] [Google Scholar]
- 14.Rasool N, LaRochelle W, Zhong H, Ara G, Cohen J, Kohn EC. Secretory leukocyte protease inhibitor antagonizes paclitaxel in ovarian cancer cells. Clin Cancer Res. 2010;16:600–9. doi: 10.1158/1078-0432.CCR-09-1979. [DOI] [PMC free article] [PubMed] [Google Scholar]
- 15.Simpkins FA, Devoogdt NM, Rasool N, Tchabo NE, Alejandro EU, Kamrava MM, et al. The alarm anti-protease, secretory leukocyte protease inhibitor, is a proliferation and survival factor for ovarian cancer cells. Carcinogenesis. 2008;29:466–72. doi: 10.1093/carcin/bgm212. [DOI] [PubMed] [Google Scholar]
- 16.He Z, Bateman A. Progranulin (granulin-epithelin precursor, PC-cell-derived growth factor, acrogranin) mediates tissue repair and tumorigenesis. J Mol Med. 2003;81:600–12. doi: 10.1007/s00109-003-0474-3. [DOI] [PubMed] [Google Scholar]
- 17.He Z, Ismail A, Kriazhev L, Sadvakassova G, Bateman A. Progranulin (PC-cell-derived growth factor/acrogranin) regulates invasion and cell survival. Cancer Res. 2002;62:5590–6. [PubMed] [Google Scholar]
- 18.He Z, Ong CH, Halper J, Bateman A. Progranulin is a mediator of the wound response. Nat Med. 2003;9:225–9. doi: 10.1038/nm816. [DOI] [PubMed] [Google Scholar]
- 19.Jones MB, Michener CM, Blanchette JO, Kuznetsov VA, Raffeld M, Serrero G, Emmert-Buck MR, Petricoin EF, Krizman DB, Liotta LA, Kohn EC, et al. The granulin-epithelin precursor/PC-cell-derived growth factor is a growth factor for epithelial ovarian cancer. Clin Cancer Res. 2003;9:44–51. [PubMed] [Google Scholar]
- 20.Jones MB, Spooner M, Kohn EC. The granulin-epithelin precursor: a putative new growth factor for ovarian cancer. Gynecol Oncol. 2003;88:S136–9. doi: 10.1006/gyno.2002.6704. [DOI] [PubMed] [Google Scholar]
- 21.Kamrava M, Simpkins F, Alejandro E, Michener C, Meltzer E, Kohn EC. Lysophosphatidic acid and endothelin-induced proliferation of ovarian cancer cell lines is mitigated by neutralization of granulin-epithelin precursor (GEP), a prosurvival factor for ovarian cancer. Oncogene. 2005;24:7084–93. doi: 10.1038/sj.onc.1208857. [DOI] [PubMed] [Google Scholar]
- 22.Matsumura N, Mandai M, Miyanishi M, Fukuhara K, Baba T, Higuchi T, Kariya M, Takakura K, Fujii S, et al. Oncogenic property of acrogranin in human uterine leiomyosarcoma: direct evidence of genetic contribution in in vivo tumorigenesis. Clin Cancer Res. 2006;12:1402–11. doi: 10.1158/1078-0432.CCR-05-2003. [DOI] [PubMed] [Google Scholar]
- 23.Miyanishi M, Mandai M, Matsumura N, Yamaguchi K, Hamanishi J, Higuchi T, Takakura K, Fujii S, et al. Immortalized ovarian surface epithelial cells acquire tumorigenicity by Acrogranin gene overexpression. Oncol Rep. 2007;17:329–33. [PubMed] [Google Scholar]
- 24.Moore RG, MacLaughlan S, Bast RC., Jr Current state of biomarker development for clinical application in epithelial ovarian cancer. Gynecol Oncol. 2010;116:240–5. doi: 10.1016/j.ygyno.2009.09.041. [DOI] [PMC free article] [PubMed] [Google Scholar]
- 25.Davidson B, Alejandro E, Florenes VA, Goderstad JM, Risberg B, Kristensen GB, et al. Granulin-epithelin precursor is a novel prognostic marker in epithelial ovarian carcinoma. Cancer. 2004;100:2139–47. doi: 10.1002/cncr.20219. [DOI] [PubMed] [Google Scholar]
- 26.Pizarro GO, Zhou XC, Koch A, Gharib M, Raval S, Bible K, et al. Prosurvival function of the granulin-epithelin precursor is important in tumor progression and chemoresponse. Int J Cancer. 2007;120:2339–43. doi: 10.1002/ijc.22559. [DOI] [PubMed] [Google Scholar]
- 27.Zhu J, Nathan C, Jin W, Sim D, Ashcroft GS, Wahl SM, et al. Conversion of proepithelin to epithelins: roles of SLPI and elastase in host defense and wound repair. Cell. 2002;111:867–78. doi: 10.1016/s0092-8674(02)01141-8. [DOI] [PubMed] [Google Scholar]
- 28.Devoogdt N, Hassanzadeh Ghassabeh G, Zhang J, Brys L, De Baetselier P, Revets H, et al. Secretory leukocyte protease inhibitor promotes the tumorigenic and metastatic potential of cancer cells. Proc Natl Acad Sci U S A. 2003;100:5778–82. doi: 10.1073/pnas.1037154100. [DOI] [PMC free article] [PubMed] [Google Scholar]
- 29.Devoogdt N, Revets H, Ghassabeh GH, De Baetselier P. Secretory leukocyte protease inhibitor in cancer development. Ann N Y Acad Sci. 2004;1028:380–9. doi: 10.1196/annals.1322.044. [DOI] [PubMed] [Google Scholar]
- 30.Hough CD, Cho KR, Zonderman AB, Schwartz DR, Morin PJ. Coordinately up-regulated genes in ovarian cancer. Cancer Res. 2001;61:3869–76. [PubMed] [Google Scholar]
- 31.Shigemasa K, Tanimoto H, Underwood LJ, Parmley TH, Arihiro K, Ohama K, et al. Expression of the protease inhibitor antileukoprotease and the serine protease stratum corneum chymotryptic enzyme (SCCE) is coordinated in ovarian tumors. Int J Gynecol Cancer. 2001;11:454–61. doi: 10.1046/j.1525-1438.2001.01062.x. [DOI] [PubMed] [Google Scholar]
- 32.Tsukishiro S, Suzumori N, Nishikawa H, Arakawa A, Suzumori K. Use of serum secretory leukocyte protease inhibitor levels in patients to improve specificity of ovarian cancer diagnosis. Gynecol Oncol. 2005;96:516–9. doi: 10.1016/j.ygyno.2004.10.036. [DOI] [PubMed] [Google Scholar]
- 33.Chi DS, McCaughty K, Diaz JP, Huh J, Schwabenbauer S, Hummer AJ, et al. Guidelines and selection criteria for secondary cytoreductive surgery in patients with recurrent, platinum-sensitive epithelial ovarian carcinoma. Cancer. 2006;106:1933–9. doi: 10.1002/cncr.21845. [DOI] [PubMed] [Google Scholar]
- 34.Na YJ, Farley J, Zeh A, del Carmen M, Penson R, Birrer MJ. Ovarian cancer: markers of response. Int J Gynecol Cancer. 2009;19 (Suppl 2):S21–9. doi: 10.1111/IGC.0b013e3181c2aeb5. [DOI] [PubMed] [Google Scholar]
- 35.Crawford SM, Paul J, Reed NS. The prognostic significance of the CA125 nadir in patients that achieve a CA125 response. Proc Am Soc Clin Oncol. 2004;23:448. Abstr 5001. [Google Scholar]
- 36.Crawford SM, Peace J. Does the nadir CA125 concentration predict a long-term outcome after chemotherapy for carcinoma of the ovary? Ann Oncol. 2005;16:47–50. doi: 10.1093/annonc/mdi012. [DOI] [PubMed] [Google Scholar]
- 37.Markman M, Liu PY, Rothenberg ML, Mon BJ, Brady M, Alberts DS. Pretreatment CA-125 and risk of relapse in advanced ovarian cancer. J Clin Oncol. 2006;24:1454–58. doi: 10.1200/JCO.2005.04.7373. [DOI] [PubMed] [Google Scholar]
- 38.Prat A, Parera M, Peralta S, Perez-Benavente MA, Garcia A, Gil-Moreno A, et al. Nadir CA-125 concentration in the normal range as an independent prognostic factor for optimally treated advanced epithelial ovarian cancer. Ann Oncol. 2008;19:327–31. doi: 10.1093/annonc/mdm495. [DOI] [PubMed] [Google Scholar]
- 39.Prat A, Parera M, Adamo B, Peralta S, Perez-Benavente MA, Garcia A, Gil-Moreno A, Martinez-Palones JM, Baselga J, del Campo JM, et al. Risk of recurrence during follow-up for optimally treated advanced epithelial ovarian cancer (EOC) with a low-level increase of serum CA-125 levels. Ann Oncol. 2009;20:294–7. doi: 10.1093/annonc/mdn601. [DOI] [PubMed] [Google Scholar]
- 40.Rustin GJ, van der Burg ME. A randomized trial in ovarian cancer of early treatment of relapse based on CA125 level alone versus delayed treatment based on conventional clinical indicators (MRC OV05/EORTC 55955 trials) J Clin Oncol. 2009;27:18S. [Google Scholar]
- 41.Cuevas-Antonio R, Cancino C, Arechavaleta-Velasco F, Andrade A, Barron L, Estrada I, Fernandez RL, Olguin V, Ruiz S, Imani F, Zeferino-Toquero M, Ulloa-Aguirre A, Gerton GL, Diaz-Cueto L, et al. Expression of progranulin (Acrogranin/PCDGF/Granulin-Epithelin Precursor) in benign and malignant ovarian tumors and activation of MAPK signaling in ovarian cancer cell line. Cancer Invest. 2009;28:452–8. doi: 10.3109/07357900903346455. (epub) [DOI] [PubMed] [Google Scholar]