

Abstract
The co-evolution of tumors and their microenvironment involves bidirectional communication between tumor cells and tumor-associated stroma. Various cell types are present in tumor-associated stroma, of which fibroblasts are the most abundant. The Rac exchange factor Tiam1 is implicated in multiple signaling pathways in epithelial tumor cells and lack of Tiam1 in tumor cells retards tumor growth in Tiam1 knock-out mouse models. Conversely, tumors arising in Tiam1 knock-out mice have increased invasiveness. We have investigated the role of Tiam1 in tumor-associated fibroblasts as a modulator of tumor cell invasion and metastasis, using retroviral delivery of short hairpin RNA to suppress Tiam1 levels in three different experimental models. In spheroid co-culture of mammary epithelial cells and fibroblasts, Tiam1 silencing in fibroblasts led to increased epithelial cell outgrowth into matrix. In tissue-engineered human skin, Tiam1 silencing in dermal fibroblasts led to increased invasiveness of epidermal keratinocytes with premalignant features. In a model of human breast cancer in mice, co-implantation of mammary fibroblasts inhibited tumor invasion and metastasis, which was reversed by Tiam1 silencing in co-injected fibroblasts. These results suggest that stromal Tiam1 may play a role in modulating the effects of the tumor microenvironment on malignant cell invasion and metastasis. This suggests a set of pathways for further investigation, with implications for future therapeutic targets.
Keywords: Tiam1, Rac, tumor-associated fibroblasts, invasion, metastasis
Introduction
The role of the microenvironment in tumor development is gaining increased recognition (Cunha & Donjacour, 1989). There is growing evidence that the stromal microenvironment around cancer cells influences the growth, invasiveness, and metastatic behavior of cancer cells, and perhaps also therapeutic response. It is becoming increasingly apparent that there are bidirectional signals between cancer cells and tumor-associated stroma. Tumor-associated stroma is comprised of various cell types and extracellular molecules comprising or secreted into the extracellular matrix. The list of factors that participate in the co-evolution of tumors with tumor-associated stroma is growing, and the interplay between signaling pathways within tumor cells and the stroma itself is beginning to be understood (Bhowmick & Moses, 2005; Li et al., 2007).
Since the discovery of oncogenes, protooncogenes, and their signaling pathways, significant effort has gone into deciphering the molecular pathways governing specific cellular behaviors and how these are corrupted in tumor cells. Much of this work has been done using traditional two-dimensional cell culture models, allowing for ready manipulation of individual signaling components. Some of the best-studied signaling molecules are the Ras family proteins, which function as molecular switches that control the flow of information from upstream inputs to downstream target pathways by cycling between active (GTP-bound) and inactive (GDP-bound) conformations (Boguski & McCormick, 1993). The Rho sub-family proteins (Rho, Rac, and Cdc42) have been a particular focus of study since the identification of their effects on cytoskeleton dynamics (Hall, 1998) and they play key roles in multiple signaling pathways affected in malignant cell transformation. Three classes of regulatory proteins affect the activation state of Rho molecules: GEFs (guanine nucleotide exchange factors, which promote exchange of GTP for bound GDP and GTPase activation), GAPs (GTPase-activating proteins, which enhance intrinsic GTP-hydrolysis activity and GTPase inactivation), and GDIs (guanine-nucleotide dissociation inhibitors, which bind prenylated GDP-bound Rho proteins and allow translocation between membranes and cytosol). GEFs appear to be the primary regulators of Rho family activation in response to upstream stimuli (Erickson & Cerione, 2004; Rossman et al., 2005; Schmidt & Hall, 2002).
There are over 60 GEFs identified for the Rho family proteins. Of particular interest is the Rac GEF Tiam1 (T-lymphoma Invasion and Metastasis gene). First identified by retroviral mutagenesis as a pro-invasion factor in T lymphocytes, it has since been recognized as a ubiquitous Rac activator with multiple effects in cells (Habets et al., 1994; Mertens et al., 2003). It is increasingly being identified in human cancers and experimental cancer models. Increased Tiam1 expression is associated with increased invasiveness and/or epithelial-mesenchymal transition in colon, pancreatic, breast, and lung cancer cell lines (Cruz-Monserrate & O’Connor, 2008; Hou et al., 2004; Liu et al., 2005; Minard et al., 2005; Minard et al., 2004). Depletion of Tiam1 in a pancreatic cell line retards colony formation in soft agar, decreases growth and invasiveness of colorectal cancer cells and decreases migration of oral cancer cells (Baines et al., 2006; Liu et al., 2006; Supriatno et al., 2003). Tiam1 is a Wnt-responsive gene that is up-regulated in mouse intestinal tumors and human colon adenomas (Malliri et al., 2006).
Much of our understanding of Tiam1 in cancer comes from studying Tiam1 in the cancer cell itself, using two-dimensional culture systems. However, cells, tissues, and organs are three-dimensional entities, and processes can vary considerably when occurring in the context of two dimensions vs. three dimensions (Yamada & Cukierman, 2007). In the current work we have applied concepts of tumor-stroma co-evolution and three-dimensional experimental models to study the role of Tiam1 in the tumor microenvironment.
We developed this work after studying a major paradox in the current understanding of Tiam1. Germline knock-out of Tiam1 leads to decreased growth of both skin and intestinal tumors in mouse models, perhaps due to lack of Tiam1-mediated protection against apoptosis in these cell types (Malliri et al., 2006; Malliri et al., 2002; Rygiel et al., 2008). Development of T-cell lymphomas in mice carrying targeted deletion of PTEN in T-lymphocytes is not affected by presence or absence of Tiam1, perhaps because T cells in these mice are hyperproliferative, with underlying resistance to apoptosis (Strumane et al., 2008). However, in all of these models of tumorigenesis, tumors developing in the absence of Tiam1 are more invasive, conceptually inconsistent with the effects of Tiam1 on tumor growth. It has been hypothesized that this may be due to the requirement for Tiam1 in establishing E-cadherin-mediated cell-cell adhesions (Gupta & Massague, 2006; Tse & Kalluri, 2007). However, other work suggests that tumor invasion is also dependent on signals from the tumor-associated stroma (Bhowmick et al., 2004a; Kuperwasser et al., 2004). We therefore hypothesized that in these mice with unconditional Tiam1 knock-out, effects on tumor growth are due to Tiam1 deficiency in the tumor cells themselves, while the effects on tumor invasion are due to Tiam1 deficiency in the fibroblasts of the tumor stroma. Here we present results from three different experimental models in support of this hypothesis.
Results
Tiam1 depletion in fibroblasts affects epithelial cell outgrowth in mammary spheroid co-culture
To assess the role of Tiam1 in mammary stromal cells, we first utilized a three-dimensional in vitro model allowing co-culture of human mammary-derived fibroblasts with human mammary-derived epithelial cells in an extracellular matrix (Kim, 2005). We used human mammary epithelial cells (HMECs) and human reduction mammary fibroblasts (RMFs), both derived after immortalization through retroviral delivery of human telomerase (hTERT) (Kuperwasser et al., 2004; Kuperwasser et al., 2005). When mixed in a 1:1 ratio and cultured in a Matrigel plug, the cells assemble into 3D spheroid structures with fibroblasts clustering in the interior core of the sphere and epithelial cells coating the outside. We initially performed these experiments with non-fluorescing HMECs and RMFs expressing GFP. Supplemental figure S1A demonstrates the appearance of one of these spheroids under light microscopy, with green fluorescence of the same field shown in Figure S1B. The fibroblasts can be visualized within the interior core of the spheroid, with non-fluorescing HMECs arrayed around the fibroblast core and assembling into outgrowths projecting into the surrounding matrix (arrows, Figure S1A). An occasional fluorescing fibroblast can also be seen within this corona of epithelial cells (arrowhead, Figure S1B). We then repeated these experiments with HMECs engineered to express the red fluorescing mCherry protein to further demonstrate the location of the HMECs around the periphery and in the projecting outgrowths (Figure S2). The projecting outgrowths are multicellular, as seen on hematoxylin and eosin staining of fixed, paraffin-embedded spheroids (arrows, Figure S1C). These spheroids do not progress to hollowed-out gland-like structures such as those described in one-cell-type models of mammary morphogenesis (Debnath et al., 2003). However, because the 3D spheroid is composed of close juxtaposition of epithelial cells with stromal fibroblasts, this model does permit observation of factors that increase the ability of the epithelial cells to grow out into (invade) the surrounding extracellular matrix.
In order to test our hypothesis that modulation of Tiam1 levels in breast stromal fibroblasts affects invasiveness in adjacent breast epithelial cells, we used retroviral delivery of hairpin RNA to engineer stable suppression of Tiam1 in either the HMEC line or the RMF line. Tiam1 levels were verified by immunoblotting (Figure S3, top panels), with equal protein loading verified by immunoblotting for GAPDH (bottom panels). In cells expressing the short hairpin targeting Tiam1 (shTiam), Tiam1 levels were decreased by approximately 75% compared with control cells (C) expressing empty vector (or parental cells, not shown). We have previously used this sequence to suppress Tiam1 levels in 293T and NIH3T3 cells (using siRNA oligomers or retroviral hairpin respectively) (Connolly et al., 2005). NIH3T3 fibroblasts with suppressed Tiam1 levels by this method exhibit significantly less Rac activation in response to specific stimuli compared with control fibroblasts (Rajagopal et al., 2010). Similarly, RMFs with suppressed Tiam1 expression also showed significantly less Rac activation in response to pervanadate stimulation compared with control fibroblasts (Figure S4).
We then established Matrigel co-cultures using all four possible combinations of control and shTiam1 expression in the HMEC and GFP-RMF lines (Figure 1A). After 10 days in culture, length of cellular projections into matrigel was measured under light microscopy (Figure 1B). Differential Tiam1 expression in HMECs did not affect number or length of projections into Matrigel in the presence of control RMFs (compare combinations 1 and 2). However, Tiam1 silencing in RMFs led to significant enhancement of these epithelial cell outgrowths, regardless of the Tiam1 levels in the co-cultured HMECs (compare combinations 1 and 3). This suggests that Tiam1 silencing in the fibroblasts, rather than in the epithelial cells, influenced the invasion of the HMECs into the matrix.
Figure 1. Effect of Tiam1 suppression in mammary fibroblasts on epithelial cell invasion in spheroid co-cultures.
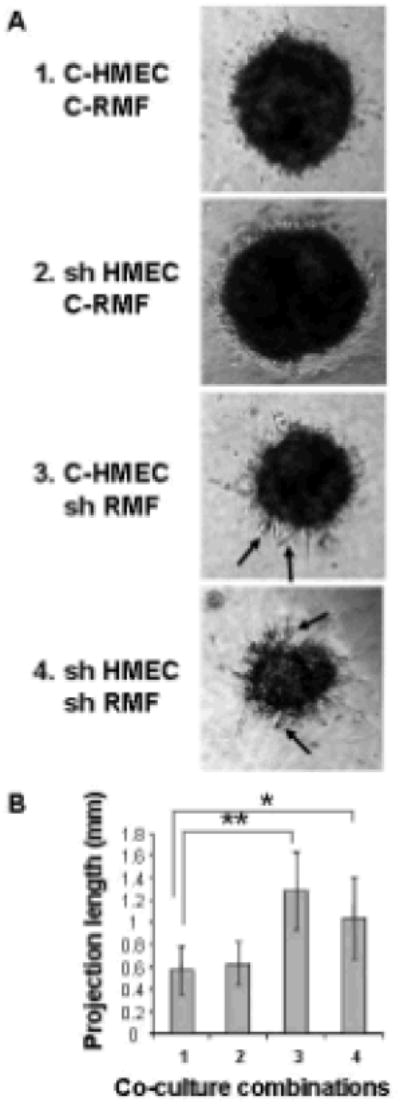
A. Co-cultures of HMECs and RMFs with either control (C) or suppressed (sh) levels of Tiam1 were established in Matrigel in all four possible combinations: C- HMEC in 1, 3; sh HMEC in 2,4; C-RMF in 1,2; shRMF in 3,4. Representative images were taken on day 10. Arrows indicate examples of projections extending out beyond the spheroid perimeter.
B. For projection measurements, the longest projection on each spheroid from the tip of the projection to the perimeter of the spheroid was measured. Numbers along X-axis correspond to the co-culture combinations from A. Data represent mean +/- S.D. from 10 representative spheroids in each of 3 separate experiments. * indicates p-value < 0.0005, ** indicates p-value < 0.00005 by two-tailed t-Test.
We also determined whether suppression of Rac expression in fibroblasts led to a similar phenotype. Spheroid co-cultures were established with HMECs and either control RMFs or RMFs with stable decrease in Rac1 levels (Figure S5A). Spheroids from co-culture of HMECs with shRac-RMFs exhibited a somewhat blunted phenotype compared with co-culture of HMECs with shTiam-RMFs developing over the same time frame, exhibiting small projections in somewhat increased numbers compared to control but to a lesser degree than those in shTiam1-RMF co-cultures (Figure S5B). While Tiam1 deficiency led to decreased Rac activation in cell lysates, Rac deficiency only partially recapitulated Tiam1 deficiency in this three-dimensional assay.
Tiam1 depletion in dermal fibroblasts affects keratinocyte invasion in a 3D model of human skin
We then extended the experiments on Tiam1-deficient fibroblasts to an engineered tissue in order to test our hypothesis in conditions with more physiologic tissue architecture than simple spheroid co-culture in Matrigel. The organotypic model of human skin is a well-established tissue model of squamous cell carcinoma progression (Andriani et al., 2004; Garlick, 2007; Segal et al., 2008). In this model, human skin equivalents are fabricated by growing a fully-stratified “epidermis” layered over a stromal “dermis” at an air-liquid interface. In our experiments the stromal “dermis” is composed of collagen mixed with fibroblasts derived from human foreskin fibroblasts (HFFs). The epithelial “epidermis” is composed of a spontaneously-immortalized human keratinocyte cell line that expresses an activated Ras oncogene (HaCaT-ras-II-4) and forms dysplastic, premalignant epithelium under appropriate culture conditions (Boukamp et al., 1990; Fusenig & Boukamp, 1998).
In order to test the effect of Tiam1 signaling in dermal fibroblasts on HaCaT-ras-II-4 cell invasiveness, we derived HFFs with stable Tiam1 silencing using the same retroviral plasmid hairpin approach as described above with the HMECs and RMFs. Tiam1 expression was verified by immunoblot and was decreased by 80% compared with parental cells (P) or control vector-containing cells (C) (Figure S6). We then established human skin equivalents with either parental HFFs, HFFs with control retroviral vector or sh-HFFs in the collagen dermis. For these experiments we used two different human keratinocyte cell lines. In the first model the keratinocyte layer is established with the HaCaT-ras-II-4 line, originally derived from spontaneously immortalized keratinocytes transformed with Ras, which is not invasive in organotypic culture and displays an intact basement membrane without evidence of cell invasion under control conditions (Figure 2A, left panels) (Boukamp et al., 1990). In the second model the keratinocyte layer is established with HaCaT-ras-II-4-DN-ECad, a more aggressive subline expressing dominant negative E-Cadherin (Figure 2A, right panels) (Margulis et al., 2005).
Figure 2. Effect of Tiam1 suppression in dermal fibroblasts on keratinocyte invasion in 3-dimensional human skin equivalents (HSE).
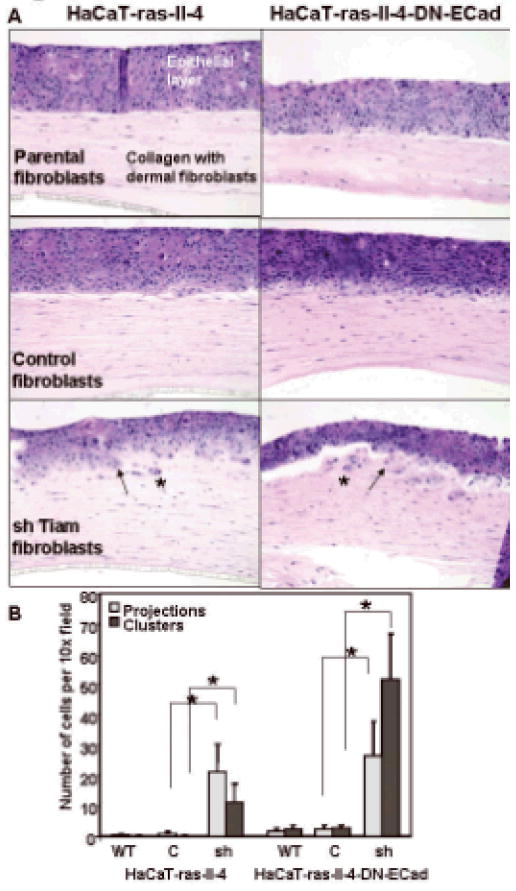
A. HSE were established using either parental HaCat-ras-II-4 (left panels) or HaCat-ras-II-4-DN-ECad (right panels) as the epithelial keratinocyte layers, over collagen layers containing either parental fibroblasts (top panels), fibroblasts with control hairpin vector (middle panels) or shTiam1 fibroblasts (bottom panels). Arrows indicate examples of keratinocytes invading as projections from the dermal layer, asterisks indicate examples of invading cell clusters that have separated from the dermal layer.
B. Numbers of invading keratinocytes present in projections or as clusters of cells separated from the epithelial layer were counted in fixed sections of HSE established over collagen layers containing either parental (WT), control vector (C), or shTiam1 (sh) fibroblasts. Data represent mean +/- S.D. for 15 representative high-power fields in at least 2 sections for each experimental condition. * indicates p-value < 0.00001 by two-tailed t-Test. Results are representative of duplicate experiments.
We found no difference in invasiveness of either keratinocyte line established over dermal layers containing either parental HFF or HFF transduced with control retrovirus (Figure 2A, top and middle panels respectively). In contrast, both keratinocyte lines exhibited significantly increased invasiveness into the underlying collagen dermis containing Tiam1-suppressed HFFs (Figure 2A, bottom panels). In both models, invasion was observed either as projections of groups of cells disrupting the smooth basement membrane and extending out into the collagen layer (projections) or as single cells or small clusters of isolated cells in the collagen layer (clusters). Staining for β-galactosidase, expressed by both keratinocyte lines, confirmed the identity and epithelial nature of the invading cells (not shown). Numbers of invading cells were quantified under light microscopy (Figure 2B). Similar to our results in the Matrigel co-culture model, suppression of Tiam1 in dermal fibroblasts enhanced epithelial invasiveness, inducing a transition from a premalignant, dysplastic state to a condition showing incipient invasion in this three-dimensional model of human skin.
Tiam1 depletion in breast stromal fibroblasts affects tumor invasion in a mouse model of human breast cancer
We next examined the role of Tiam1 in stromal cells in a mouse model of human breast cancer (Kuperwasser et al., 2004). The human breast cancer cell line, SUM1315-GFP/luc, when injected into mammary fat pads of NOD-SCID mice, yields mammary tumors within a defined time period (8-12 weeks) in 90% of mice (Figure 3), and spontaneously metastasizes to other organs (Kuperwasser et al., 2005). Similar to these studies, we found that orthotopic tumors from SUM1315-GFP/luc breast cancer cells resulted in lung metastases in approximately 50% of the mice (Table 1). 75% of orthotopic tumors demonstrated areas of invasive growth into surrounding stroma (Figure 4, top panels). In addition, consistent with previous studies in which normal fibroblasts suppressed tumor formation, injection of SUM1315-GFP/luc cells co-mixed with normal mammary fibroblasts inhibited tumor formation during this time frame (Kuperwasser et al., 2004; Willhauck et al., 2007).
Figure 3. Effect of human stromal fibroblasts on tumor growth.
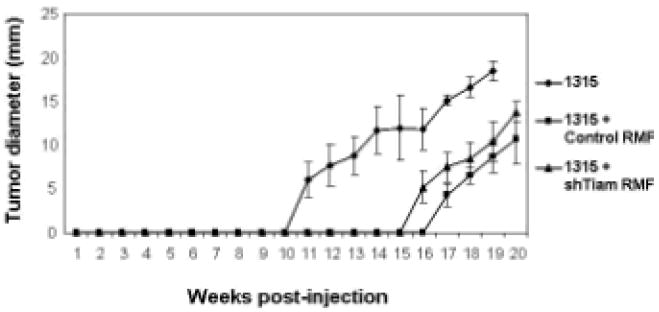
Tumor size in largest dimension shown for mice implanted with SUM1315-GFP/luc only (diamonds), or co-mixed with either control RMFs (squares) or shTiam-RMFs (triangles). Each curve represents means +/- S.D. from cohorts of 10 mice.
Table 1.
Tumor growth and metastasis in mice bearing human breast cancer xenografts +/- co-mixed mammary fibroblasts
| # mice with tumors/total mice (#tumors) (p-value) | # weeks until measurable tumor (s.d) (p-value) | #mice with detectable lung mets/#evaluable lungs (p-value) | |
|---|---|---|---|
| SUM1315 | 10/10 | 10.8 (1.4) | 4/8 |
| (16) | |||
| (--) | (--) | (--) | |
| SUM1315 + Control RMF | 8/10 | 17.1 (2.0) | 0/7 |
| (8) | |||
| (p=0.66) | (p=0.000006 | (p=0.03) | |
| SUM1315 + shTiam RMF | 8/10 | 15.8 (2.9) | 5/10 |
| (12) | |||
| (p=0.66) | (p=0.0006) | (p=1.0) | |
Figure 4. Effect of Tiam1 suppression in stromal fibroblasts on breast cancer invasiveness.
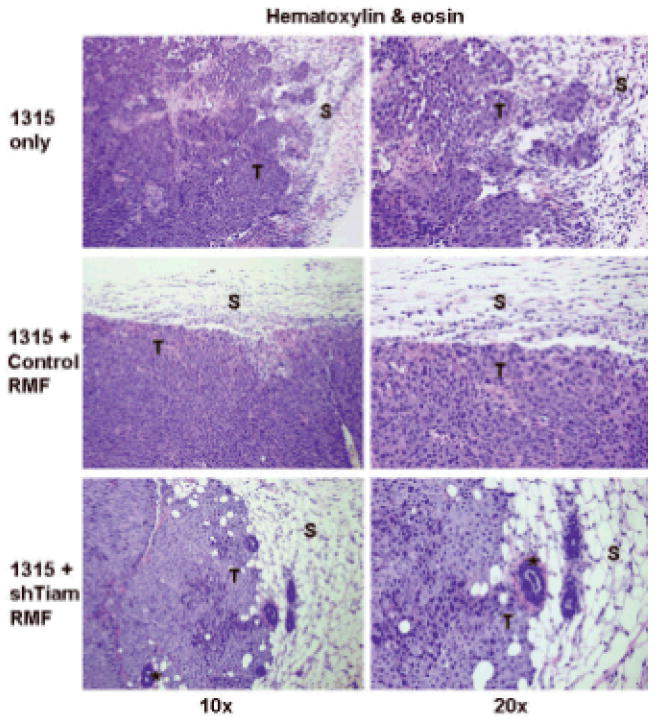
Histopathology (hematoxylin & eosin) from orthotopic tumors in mice implanted with SUM1315-GFP/luc breast cancer cells alone (top panels), co-mixed with control RMF (middle panels) or shTiam1-RMF (bottom panels). Right panels are magnification of a section from corresponding left panels depicting a representative tumor-stroma interface. T indicates primary tumor, S indicates adjacent stroma. Asterisks indicate murine mammary structures.
We tested the effect of Tiam1 suppression in fibroblasts on tumor growth, invasiveness, and metastasis in this model, with the control RMF and shTiam-RMF cells used earlier in our spheroid co-culture model. We found that co-mixture with either fibroblast line decreased orthotopic tumor formation by 25-50% in terms of numbers of mice developing detectable tumors and total number of tumors formed, compared with injection of tumor cells alone (Table 1). Tumor development was also delayed to a similar extent after co-mixture with either fibroblast line, with time to first measurable tumor being significantly delayed in these mice (Table 1 and Figure 3). Thus tumorigenesis was decreased by the presence of co-injected fibroblasts, but this was independent of fibroblast Tiam1 expression.
However, the histology of the tumors was notably different at the interface between tumor and surrounding stroma depending on Tiam1 status in the associated fibroblasts (Figure 4). All tumors developing in mice implanted with Sum 1315-GFP/luc cells co-mixed with control RMF demonstrated a “pushing” smooth border between tumor cells and adjacent stroma, with less evidence of stromal invasion by tumor cells (Figure 4, middle panels). In mice implanted with SUM1315-GFP/luc cells co-mixed with shTiam-RMF, 75% of tumors exhibited a more infiltrative, invasive tumor-stromal border, with tumor cells extending out into the surrounding stroma and around murine mammary structures (Figure 4, bottom panels), similar to the pattern seen with implantation of Sum 1315-GFP/luc cells alone. In this model, the tumor cells express vimentin, and immunohistochemical staining for human-specific vimentin readily demonstrated the presence of tumor cells invading into surrounding stroma after injection of SUM1315-GFP/luc cells alone (Figure 5, top panel) or in association with Tiam1-suppressed fibroblasts (bottom panel), as opposed to with control fibroblasts (middle panel).
Figure 5. Immunohistochemical staining on orthotopic tumors from mice implanted and labeled as shown in Figure 4.
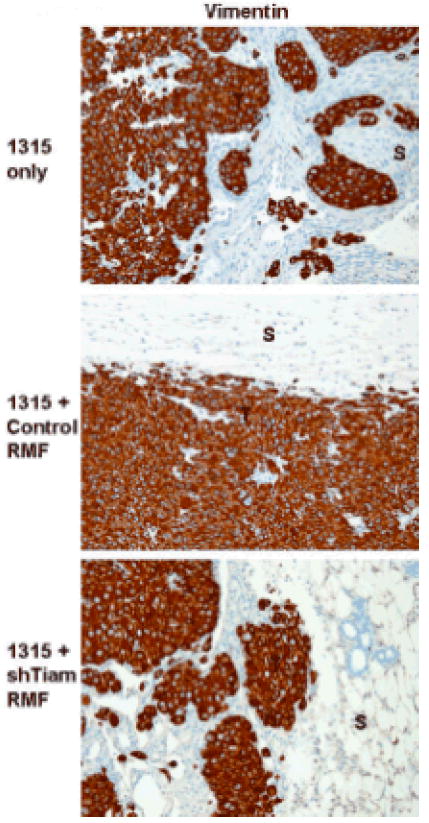
Vimentin staining, 20x magnification. T indicates tumor cells, S indicates adjacent stroma.
Finally, we determined whether the degree of tumor invasion observed on histopathologic examination of the tumor correlated with metastatic behavior. Half of the mice implanted with SUM1315-GFP/luc alone had lung metastases, detectable either as tumor nodules visible on routine histopathology or as isolated tumor cells detected by vimentin immunostaining (Table 1 and Figure 6, top panels). No mice with establishment of orthotopic tumors from SUM1315-GFP/luc breast cancer cells co-mixed with control fibroblasts exhibited detectable tumor cells within their lungs (middle panels). However, 50% of the mice receiving shTiam RMF along with SUM1315-GFP/luc breast cancer cells had detectable tumor cells in their lungs by routine histology or vimentin immunostaining, similar to mice receiving the tumor cells alone (bottom panels). Thus, while tumorigenesis was not affected, Tiam1 suppression in breast stromal fibroblasts significantly increased invasiveness and metastatic potential of the breast tumors in this model.
Figure 6. Effect of Tiam1 suppression in stromal fibroblasts on breast cancer metastasis.
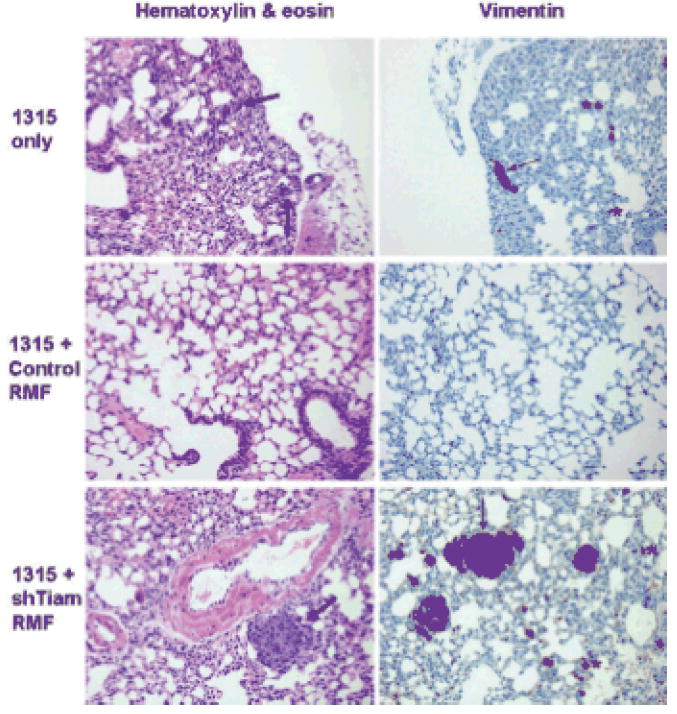
Histopathology on lung sections from mice implanted as in Figure 4. Left panels shown at 20x magnification, thick arrows indicate nodular metastatic deposits detectable on H&E staining. Right panels show corresponding vimentin staining at 20x magnification, thin arrows indicate larger metastatic deposits, asterisks indicate examples of isolated tumor cells detectable only with vimentin staining.
Discussion
We set out to examine the role of Tiam1 in fibroblasts of the tumor microenvironment on epithelial cell invasiveness. The tissue microenvironment is defined by a complex network of intercellular interactions mediated by physical attachment, as in direct cell-cell or cell-extracellular matrix interactions, and by biochemical signals, mediated by soluble molecules. Evidence is accumulating that cancer is a disease of altered tissue architecture and that neoplastic progression is a consequence of abnormal interactions between tumor cells and their tissue microenvironment. As a result, it is essential to study how the tissue microenvironment affects human cancer progression in systems that incorporate proper 3D-tissue context and architecture. Monolayer, 2D culture systems do not generate the spatially-organized, 3D structures that occur in vivo. Consequently, increasing numbers of human three-dimensional models are being developed using a variety of materials. Multiple cell functions are affected by dimensional context, including cell shape and polarity, growth, morphogenesis, differentiation, and gene expression. Factors affecting experimental outcome in different models include use of cells in single suspension vs. aggregates, nutrient restrictions, composition and stiffness of extracellular matrix, and cell polarity (Yamada & Cukierman, 2007). Thus, a result observed across several different models may have more physiologic significance than a result dependent on any single particular model.
We used different tissue models with a range of technical complexity and biologically meaningful tissue context in order to validate the significance of our findings. We found that Tiam1 expression in stromal fibroblasts affects the invasive behavior of associated epithelial cells. In spheroid co-culture of HMECs and RMFs, epithelial cells exhibited increased invasiveness into the surrounding extracellular matrix when Tiam1 was suppressed in the fibroblasts. Similarly, in organotypic cultures of engineered human skin fabricated with epidermis from premalignant keratinocytes and dermis comprised of collagen mixed with skin fibroblasts, two different keratinocyte lines exhibited significantly more invasion into dermis when Tiam1 levels were suppressed in dermal fibroblasts. Extending this study into a more complex whole animal system, a murine model of human breast cancer, yielded more complex findings. Co-injection of any mammary fibroblasts retarded tumorigenesis, invasiveness, and lung metastasis, compared with tumor establishment in the absence of fibroblasts. While the effects on tumorigenesis were independent of stromal Tiam1 levels, breast tumor invasion and metastasis were clearly increased in the presence of fibroblasts with suppressed Tiam1. Tiam1 suppression reversed the stromal inhibition of tumor invasion and metastasis but did not affect the stromal inhibition of tumorigenesis itself. This suggests that fibroblasts of the microenvironment have complex effects on associated tumors governed by more than one set of signaling pathways. This is reminiscent of the paradigm in tumor cells that multiple distinct pathways are involved in acquisition of the characteristics needed for malignant transformation (Hanahan & Weinberg, 2000).
How Tiam1 expression in breast stromal fibroblasts could affect tumor cell invasiveness is not yet clear. Of note, fibroblasts are the predominant cell type in stromal connective tissue, contributing to deposition and maintenance of basement membrane and paracrine growth factors. There is also emerging evidence that fibroblasts may actively function in the induction of cancers (Bhowmick & Moses, 2005). Best documented in this regard include studies on TGFβ (transforming growth factor-beta), HGF (hepatocyte growth factor), and Wnt, in which stromal secretion of these paracrine factors leads to transformation in culture or development of pre-cancerous or cancerous lesions (Jue et al., 1992; Kuperwasser et al., 2004). TGFβ, with both tumor suppressing and tumor promoting roles, seems to have particularly complex effects in epithelial-stromal cross-talk. In the murine orthotopic xenograft model of human mammary development, mice implanted with human mammary epithelial cells along with human fibroblasts overexpressing TGF-β1 develop mammary pathology consistent with ductal breast carcinomas (Kuperwasser et al., 2004). However, mice with conditional deletion of TGF-β type II receptor in fibroblasts develop increased stromal fibroblasts in the prostate and forestomach along with preneoplastic prostate lesions and invasive squamous cell carcinoma of the stomach, with associated HGF activation, implying both tumor suppressive and tumor promoting effects (Bhowmick et al., 2004a). Other fibroblast-secreted soluble factors have also been implicated in regulating tumor development, including insulin-like growth factors, extracellular growth factor, fibroblast growth factors, matrix metalloproteinases, and interleukins (Bhowmick et al., 2004b). Moreover, studies have demonstrated loss of heterozygosity (LOH) in breast-cancer associated stroma, with mutations in p53 and PTEN, and stromal somatic LOH in p53 is associated with regional lymph node metastasis in sporadic human breast cancers (Kurose et al., 2002; Moinfar et al., 2000; Patocs et al., 2007). The mechanism of these acquired stromal mutations in affecting neoplastic transformation is not clear.
We observed that Tiam1 suppression led to decreased Rac activation in these fibroblasts, consistent with published work showing that all effects of Tiam1 described to date are Rac-dependent. Silencing the Rac1 GTPase only partially recapitulated the phenotype seen with Tiam1 silencing. This was not altogether surprising, as Tiam1 directs Rac signaling to specific downstream effector pathways, leading to precise defects in Rac signaling (Rajagopal et al., 2010), rather than the global Rac defect imposed by Rac silencing. Consistent with this, we observed that fibroblasts with decreased Rac expression were more difficult to derive and grew more slowly in culture. Tiam1 is not the only exchange factor that activates Rac in cells (Buchsbaum, 2007). Rac silencing impacts additional pathways beyond those involving Tiam1, and this may therefore abrogate a full phenotype in our co-culture system. However, the question of which Tiam1 pathways are responsible for the phenotype is important. Tiam1 is involved in multiple signaling pathways through interactions with numerous proteins, with different functional outcomes. Which specific Tiam1 pathway(s) account for this phenotype is currently under study.
Additional questions include whether Tiam1 expression itself affects fibroblast secretion of soluble factors implicated in tumor cell invasion, or whether Tiam1 levels are affected by mutations in tumor-associated stroma. We have not been able to recapitulate the phenotype of shTiam1-RMFs in the spheroid co-culture model using control RMFs combined with conditioned media from shTiam1-RMFs (not shown), which may indicate that Tiam1-related effects are not mediated solely through secreted soluble factors. The effect of stromal Tiam1 on epithelial tumor invasiveness is unlikely to be mediated through changes in E-cadherin expression, as the effect of stromal Tiam1 levels was independent of E-cadherin signaling in our experiments with human skin equivalents (Figure 2), and we have not detected any significant differences in the E-cadherin expression of the tumor cells in our mouse model (not shown). Furthermore, this effect does not seem to be mediated by matrix metalloproteinases, as incorporation of an MMP inhibitor into the cultures did not block epithelial invasiveness into the matrix (not shown). A systematic screen for potential mechanisms underlying the effect of stromal Tiam1 levels on associated epithelial cell invasiveness is currently underway.
In summary, we have shown that Tiam1 levels in tumor-associated fibroblasts affect tumor cell invasion and metastasis using three different experimental models. Our results indicate a strategy for studying the role of specific signaling molecules and pathways in the tumor microenvironment in the evolution of cancers. The model of stromal Tiam1 suppression may mimic human pathology by modulating the same signaling pathways that are actually affected in the microenvironment of human tumors. The finding that signaling in breast stromal fibroblasts can affect not only local invasiveness but also organ metastasis means that stromal effects on associated tumor cells persist beyond the time of direct tumor-stroma contact, suggesting potential epigenetic changes. Understanding the underlying details could potentially lead to new therapeutic strategies for treating and preventing breast cancer metastasis. Whether variation in stromal Tiam1 levels correlates with malignant progression of breast disease, whether stromal Tiam1 levels are affected by various treatment modalities for breast cancer, and whether these findings hold true for other solid tumors, remain to be explored.
Materials and Methods
Details of cell culture, generation of cell lines, and immunoblotting are included in Supplemental Material.
Rac activation assay
Rac activation in RMF cell lines were assessed using an ELISA-based assay with colorimetric read-out (Rac G-LISA Activation Assay kit; Cytoskeleton, Inc) according to manufacturer’s instructions. Cells were serum-deprived for 16 hours; then some were stimulated with 200μM pervanadate for 10 minutes. Experiments were carried out in 96-well plates; signals were detected by absorbance at 490 nm using a SpectraMax 340 microplate spectrophotometer.
Spheroid co-culture in Matrigel
Matrigel (BD Biosciences) was diluted in 1:1 ratio with ice-cold HMEC medium, and 30 microliters were placed mid-well in a 24-well plate. After incubating for 5 min in 37 °C, an additional 200 uL of Matrigel:medium mixture was added into the well and incubated for another 30 min. A 1:1 mixture of HMEC and RMF cells (0.75 × 10⁵ cells each) in 0.5 mL of HMEC medium was then gently dropped onto the top of the solidified gel. Cells were cultured for two weeks and medium was changed every two to three days. Spheroid formation and projection growth were monitored daily under light microscopy. Images were obtained on a Diaphot TMD Nikon Inverted Tissue Culture Microscope using a Spot RT-SE™ camera and SPOT Software Version 4.1 (Diagnostic Instruments Inc).
Organotypic culture
Three-dimensional human skin equivalents (HSEs) were established as previously described (Andriani et al., 2004). Briefly, early passage human foreskin fibroblasts (HFF) were added to neutralized Type I collagen (Organogenesis) mixture to 3.0 × 10⁴ cells/ml final concentration. Three mls of this mixture were added to each 35 mm well insert of a 6-well plate and incubated for 7 days in media containing DMEM and 10% fetal calf serum, until the collagen matrix exhibited no further shrinkage. 6×10⁵ keratinocytes were then put on top of the contracted collagen gel. Cultures were maintained submerged in low calcium epidermal growth media for 2 days, followed by 2 days in normal calcium medium. Cells were then fed with cornification medium only from the bottom of the well in order to raise the air-liquid interface. Cornification medium was replaced on days 3 and 5, and tissues were harvested on day 7. Polycarbonate membranes at the bottom of the insert were cut into portions for fixation with 10% formalin overnight and embedded in paraffin. Tissue blocks were sectioned into 8μm thin sections, mounted, and stained with hematoxylin and eosin (H&E). Images were obtained on a Nikon Eclipse 80i microscope.
Murine model of human breast cancer
Eight-week old female non-obese diabetic severe combined immunodeficient (NOD/SCID) mice were purchased from Jackson Laboratory. 2.5×10⁵ SUM1315-GFP/luc cells, with or without co-mixed 7.5×10⁵ RMF cells, were resuspended in Matrigel (BD Biosciences), and injected into 4th inguinal mammary glands in a 35μl volume. Animals were supplemented with antibiotics (Septra) in the drinking water for 10 days after surgery. Tumor growth was monitored weekly by manual measurement using electronic digital caliper (Control Company, TX).
Tissues were harvested according to established protocol when appearing ill or when total tumor bulk reached 2 cm3 and put into ice-cold PBS. Tumors, lungs and livers were weighed and then cut into portions for snap-freezing or fixation. Sections were placed into Histosette II Tissue Cassettes (Fisher), fixed in 10% neutral-buffered formalin at 4oC overnight, and then transferred into 70% alcohol. Paraffin embedding, tissue sectioning, H&E staining, and immunostaining were performed in the Tufts Medical Center Histopathology Laboratory.
Supplementary Material
A. Representative light microscope image from spheroid co-culture established with HMECs and RMFs as described in Figure 1. Most of the cellular projections extending out from the spheroid are non-fluorescing epithelial cells (arrows).
B. Green fluorescence image of same field. GFP-expressing fibroblasts cluster in the interior core of the spheroid. Arrowheads indicate occasional fluorescing fibroblasts extending out from the spheroid.
C. Hematoxylin and eosin staining of spheroids after ethanol fixation and paraffin embedding. Arrows indicate outgrowths projecting out into the extracellular matrix. Multiple nuclei can be seen in each projecting outgrowth.
Representative images from spheroid co-culture established with mCherry-expressing epithelial cells and GFP-expressing fibroblasts, as described in Figure 1. Two different spheroids are shown (top panels and bottom panels), using bright field (A, D), green fluorescence filter (B, E), and red fluorescence filter (C, F). All images are 100X, fluorescent images were obtained with 200msec exposure, gain 8; brightfield images were obtained with 0.42 sec exposure. Arrows indicate location of developing projections for each spheroid.
Western blots showing levels of Tiam1 (top panels) and GAPDH (bottom panels) in HMECs (left panels) and RMFs (right panels). Duplicate lysates are shown for cells transduced with control vector (C) or short hairpin targeting Tiam1 (shTiam). Arrows indicate position of specific Tiam1 band.
Rac activation in RMFs depends on Tiam1 expression. Rac activation levels in RMFs with endogenous (control) or suppressed (shTiam) Tiam1 expression grown under quiescent (light gray bars) or pervanadate-stimulated conditions (dark gray bars) as indicated. Data indicate mean +/- S.D. and are representative of duplicate experiments, each done in triplicate. * indicates p-value = 0.001 by two-sided t-Test compared with unstimulated control cells.
A. Quantitative real-time PCR results for Rac1 and GAPDH on shRac1-RMFs and control shLuciferase-RMFs. Results are shown as mean (S.D) for triplicate samples and are representative of duplicate experiments. Rac levels in shRac1-RMFs are approximately 30% of Rac levels in control cells.
B. Spheroids established with HMECs in combination with RMFs with endogenous protein levels (control), suppressed Tiam1 (shTiam), or suppressed Rac1 (shRac) were visualized under light microscopy and projections extending beyond spheroid perimeter were counted. Graphs depict spike count distribution for each line. Numbers in parentheses indicate mean projection counts for each line. Differences in mean projection counts were statistically significant between control and shTiam (p < 0.0001), control and shRac (p < 0.0013), and shTiam and shRac (p < 0.0001). An overall test of differences among lines was done using an ANOVA followed by t-tests for pairwise comparisons of cell line means using Sidak adjusted p-values.
Western blots showing levels of Tiam1 (top panel) and GAPDH (bottom panel) in HFFs. Duplicate lysates are shown for parental cells (P), cells infected with control vector (C) or short hairpin targeting Tiam1 (shTiam). Arrow indicates position of specific Tiam1 band.
Acknowledgments
This work was supported by grants from the NIH (RB: CA 095559 and CK: CA12555), the Landmann Family Fund of the Vermont Community Foundation (RB), the Breast Cancer Research Foundation (CK), the Diane Connolly-Zaniboni Research Scholarship in Breast Cancer (RB), the Tufts Medical Center GRASP Digestive Disease Center (RB, P30-DK34928), and the Design and Data Resource Center of the Tufts Clinical and Translational Science Institute (National Center for Research Resources: UL1 RR025752).
Footnotes
Conflict of Interest
The authors declare no conflict of interest.
References
- Andriani F, Garfield J, Fusenig NE, Garlick JA. Int J Cancer. 2004;108:348–57. doi: 10.1002/ijc.11525. [DOI] [PubMed] [Google Scholar]
- Baines AT, Lim KH, Shields JM, Lambert JM, Counter CM, Der CJ, Cox AD. Methods Enzymol. 2006;407:556–74. doi: 10.1016/S0076-6879(05)07045-X. [DOI] [PubMed] [Google Scholar]
- Bhowmick NA, Chytil A, Plieth D, Gorska AE, Dumont N, Shappell S, Washington MK, Neilson EG, Moses HL. Science. 2004a;303:848–51. doi: 10.1126/science.1090922. [DOI] [PubMed] [Google Scholar]
- Bhowmick NA, Moses HL. Curr Opin Genet Dev. 2005;15:97–101. doi: 10.1016/j.gde.2004.12.003. [DOI] [PMC free article] [PubMed] [Google Scholar]
- Bhowmick NA, Neilson EG, Moses HL. Nature. 2004b;432:332–7. doi: 10.1038/nature03096. [DOI] [PMC free article] [PubMed] [Google Scholar]
- Boguski MS, McCormick F. Nature. 1993;366:643–654. doi: 10.1038/366643a0. [DOI] [PubMed] [Google Scholar]
- Boukamp P, Stanbridge EJ, Foo DY, Cerutti PA, Fusenig NE. Cancer Res. 1990;50:2840–7. [PubMed] [Google Scholar]
- Buchsbaum RJ. J Cell Sci. 2007;120:1149–52. doi: 10.1242/jcs.03428. [DOI] [PubMed] [Google Scholar]
- Connolly BA, Rice J, Feig LA, Buchsbaum RJ. Mol Cell Biol. 2005;25:4602–14. doi: 10.1128/MCB.25.11.4602-4614.2005. [DOI] [PMC free article] [PubMed] [Google Scholar]
- Cruz-Monserrate Z, O’Connor KL. Neoplasia. 2008;10:408–17. doi: 10.1593/neo.07868. [DOI] [PMC free article] [PubMed] [Google Scholar]
- Cunha GR, Donjacour AA. Cancer Treat Res. 1989;46:159–75. doi: 10.1007/978-1-4613-1595-7_9. [DOI] [PubMed] [Google Scholar]
- Debnath J, Walker SJ, Brugge JS. J Cell Biol. 2003;163:315–26. doi: 10.1083/jcb.200304159. [DOI] [PMC free article] [PubMed] [Google Scholar]
- Erickson JW, Cerione RA. Biochemistry. 2004;43:837–42. doi: 10.1021/bi036026v. [DOI] [PubMed] [Google Scholar]
- Fusenig NE, Boukamp P. Mol Carcinog. 1998;23:144–58. doi: 10.1002/(sici)1098-2744(199811)23:3<144::aid-mc3>3.0.co;2-u. [DOI] [PubMed] [Google Scholar]
- Garlick JA. Adv Biochem Eng Biotechnol. 2007;103:207–39. doi: 10.1007/b137206. [DOI] [PubMed] [Google Scholar]
- Gupta GP, Massague J. Cell. 2006;127:679–95. doi: 10.1016/j.cell.2006.11.001. [DOI] [PubMed] [Google Scholar]
- Habets GG, Scholtes EH, Zuydgeest D, van der Kammen RA, Stam JC, Berns A, Collard JG. Cell. 1994;77:537–49. doi: 10.1016/0092-8674(94)90216-x. [DOI] [PubMed] [Google Scholar]
- Hall A. Science. 1998;279:509–514. doi: 10.1126/science.279.5350.509. [DOI] [PubMed] [Google Scholar]
- Hanahan D, Weinberg RA. Cell. 2000;100:57–70. doi: 10.1016/s0092-8674(00)81683-9. [DOI] [PubMed] [Google Scholar]
- Hou M, Tan L, Wang X, Zhu YS. Acta Biochim Biophys Sin (Shanghai) 2004;36:537–40. doi: 10.1093/abbs/36.8.537. [DOI] [PubMed] [Google Scholar]
- Jue SF, Bradley RS, Rudnicki JA, Varmus HE, Brown AM. Mol Cell Biol. 1992;12:321–8. doi: 10.1128/mcb.12.1.321. [DOI] [PMC free article] [PubMed] [Google Scholar]
- Kim JB. Semin Cancer Biol. 2005;15:365–77. doi: 10.1016/j.semcancer.2005.05.002. [DOI] [PubMed] [Google Scholar]
- Kuperwasser C, Chavarria T, Wu M, Magrane G, Gray JW, Carey L, Richardson A, Weinberg RA. Proc Natl Acad Sci U S A. 2004;101:4966–71. doi: 10.1073/pnas.0401064101. [DOI] [PMC free article] [PubMed] [Google Scholar]
- Kuperwasser C, Dessain S, Bierbaum BE, Garnet D, Sperandio K, Gauvin GP, Naber SP, Weinberg RA, Rosenblatt M. Cancer Res. 2005;65:6130–8. doi: 10.1158/0008-5472.CAN-04-1408. [DOI] [PubMed] [Google Scholar]
- Kurose K, Gilley K, Matsumoto S, Watson PH, Zhou XP, Eng C. Nat Genet. 2002;32:355–7. doi: 10.1038/ng1013. [DOI] [PubMed] [Google Scholar]
- Li H, Fan X, Houghton J. J Cell Biochem. 2007;101:805–15. doi: 10.1002/jcb.21159. [DOI] [PubMed] [Google Scholar]
- Liu L, Wu DH, Ding YQ. World J Gastroenterol. 2005;11:705–7. doi: 10.3748/wjg.v11.i5.705. [DOI] [PMC free article] [PubMed] [Google Scholar]
- Liu L, Zhang Q, Zhang Y, Wang S, Ding Y. Neoplasia. 2006;8:917–24. doi: 10.1593/neo.06364. [DOI] [PMC free article] [PubMed] [Google Scholar]
- Malliri A, Rygiel TP, van der Kammen RA, Song JY, Engers R, Hurlstone AF, Clevers H, Collard JG. J Biol Chem. 2006;281:543–8. doi: 10.1074/jbc.M507582200. [DOI] [PubMed] [Google Scholar]
- Malliri A, van der Kammen RA, Clark K, van der Valk M, Michiels F, Collard JG. Nature. 2002;417:867–71. doi: 10.1038/nature00848. [DOI] [PubMed] [Google Scholar]
- Margulis A, Zhang W, Alt-Holland A, Crawford HC, Fusenig NE, Garlick JA. Cancer Res. 2005;65:1783–91. doi: 10.1158/0008-5472.CAN-04-3399. [DOI] [PubMed] [Google Scholar]
- Mertens AE, Roovers RC, Collard JG. FEBS Lett. 2003;546:11–6. doi: 10.1016/s0014-5793(03)00435-6. [DOI] [PubMed] [Google Scholar]
- Minard ME, Herynk MH, Collard JG, Gallick GE. Oncogene. 2005;24:2568–73. doi: 10.1038/sj.onc.1208503. [DOI] [PubMed] [Google Scholar]
- Minard ME, Kim LS, Price JE, Gallick GE. Breast Cancer Res Treat. 2004;84:21–32. doi: 10.1023/B:BREA.0000018421.31632.e6. [DOI] [PubMed] [Google Scholar]
- Moinfar F, Man YG, Arnould L, Bratthauer GL, Ratschek M, Tavassoli FA. Cancer Res. 2000;60:2562–6. [PubMed] [Google Scholar]
- Patocs A, Zhang L, Xu Y, Weber F, Caldes T, Mutter GL, Platzer P, Eng C. N Engl J Med. 2007;357:2543–51. doi: 10.1056/NEJMoa071825. [DOI] [PubMed] [Google Scholar]
- Rajagopal S, Ji Y, Xu K, Li Y, Wicks K, Liu J, Wong KW, Herman IM, Isberg RR, Buchsbaum RJ. J Biological Chemistry. 2010 doi: 10.1074/jbc.M109.051490. in press. [DOI] [PMC free article] [PubMed] [Google Scholar]
- Rossman KL, Der CJ, Sondek J. Nat Rev Mol Cell Biol. 2005;6:167–80. doi: 10.1038/nrm1587. [DOI] [PubMed] [Google Scholar]
- Rygiel TP, Mertens AE, Strumane K, van der Kammen R, Collard JG. J Cell Sci. 2008;121:1183–92. doi: 10.1242/jcs.017194. [DOI] [PubMed] [Google Scholar]
- Schmidt A, Hall A. Genes & Development. 2002;16:1587–1609. doi: 10.1101/gad.1003302. [DOI] [PubMed] [Google Scholar]
- Segal N, Andriani F, Pfeiffer L, Kamath P, Lin N, Satyamurthy K, Egles C, Garlick JA. Matrix Biol. 2008;27:163–70. doi: 10.1016/j.matbio.2007.09.002. [DOI] [PMC free article] [PubMed] [Google Scholar]
- Strumane K, Song JY, Baas I, Collard JG. Leuk Res. 2008;32:113–20. doi: 10.1016/j.leukres.2007.03.034. [DOI] [PubMed] [Google Scholar]
- Supriatno, Harada K, Kawaguchi S, Yoshida H, Sato M. Oncol Rep. 2003;10:527–32. [PubMed] [Google Scholar]
- Tse JC, Kalluri R. J Cell Biochem. 2007;101:816–29. doi: 10.1002/jcb.21215. [DOI] [PubMed] [Google Scholar]
- Willhauck MJ, Mirancea N, Vosseler S, Pavesio A, Boukamp P, Mueller MM, Fusenig NE, Stark HJ. Carcinogenesis. 2007;28:595–610. doi: 10.1093/carcin/bgl188. [DOI] [PubMed] [Google Scholar]
- Yamada KM, Cukierman E. Cell. 2007;130:601–10. doi: 10.1016/j.cell.2007.08.006. [DOI] [PubMed] [Google Scholar]
Associated Data
This section collects any data citations, data availability statements, or supplementary materials included in this article.
Supplementary Materials
A. Representative light microscope image from spheroid co-culture established with HMECs and RMFs as described in Figure 1. Most of the cellular projections extending out from the spheroid are non-fluorescing epithelial cells (arrows).
B. Green fluorescence image of same field. GFP-expressing fibroblasts cluster in the interior core of the spheroid. Arrowheads indicate occasional fluorescing fibroblasts extending out from the spheroid.
C. Hematoxylin and eosin staining of spheroids after ethanol fixation and paraffin embedding. Arrows indicate outgrowths projecting out into the extracellular matrix. Multiple nuclei can be seen in each projecting outgrowth.
Representative images from spheroid co-culture established with mCherry-expressing epithelial cells and GFP-expressing fibroblasts, as described in Figure 1. Two different spheroids are shown (top panels and bottom panels), using bright field (A, D), green fluorescence filter (B, E), and red fluorescence filter (C, F). All images are 100X, fluorescent images were obtained with 200msec exposure, gain 8; brightfield images were obtained with 0.42 sec exposure. Arrows indicate location of developing projections for each spheroid.
Western blots showing levels of Tiam1 (top panels) and GAPDH (bottom panels) in HMECs (left panels) and RMFs (right panels). Duplicate lysates are shown for cells transduced with control vector (C) or short hairpin targeting Tiam1 (shTiam). Arrows indicate position of specific Tiam1 band.
Rac activation in RMFs depends on Tiam1 expression. Rac activation levels in RMFs with endogenous (control) or suppressed (shTiam) Tiam1 expression grown under quiescent (light gray bars) or pervanadate-stimulated conditions (dark gray bars) as indicated. Data indicate mean +/- S.D. and are representative of duplicate experiments, each done in triplicate. * indicates p-value = 0.001 by two-sided t-Test compared with unstimulated control cells.
A. Quantitative real-time PCR results for Rac1 and GAPDH on shRac1-RMFs and control shLuciferase-RMFs. Results are shown as mean (S.D) for triplicate samples and are representative of duplicate experiments. Rac levels in shRac1-RMFs are approximately 30% of Rac levels in control cells.
B. Spheroids established with HMECs in combination with RMFs with endogenous protein levels (control), suppressed Tiam1 (shTiam), or suppressed Rac1 (shRac) were visualized under light microscopy and projections extending beyond spheroid perimeter were counted. Graphs depict spike count distribution for each line. Numbers in parentheses indicate mean projection counts for each line. Differences in mean projection counts were statistically significant between control and shTiam (p < 0.0001), control and shRac (p < 0.0013), and shTiam and shRac (p < 0.0001). An overall test of differences among lines was done using an ANOVA followed by t-tests for pairwise comparisons of cell line means using Sidak adjusted p-values.
Western blots showing levels of Tiam1 (top panel) and GAPDH (bottom panel) in HFFs. Duplicate lysates are shown for parental cells (P), cells infected with control vector (C) or short hairpin targeting Tiam1 (shTiam). Arrow indicates position of specific Tiam1 band.