Abstract
Understanding the role of lipids in drug transport is critical in cancer chemotherapy to overcome drug resistance. In this study, we isolated lipids from doxorubicin-sensitive (MCF-7) and -resistant (MCF-7/ADR) breast cancer cells to characterize the biophysical properties of membrane lipids (particularly lipid packing and membrane fluidity) and to understand the role of the interaction of cell membrane lipids with drug/nanocarrier on drug uptake and efficacy. Resistant cell membrane lipids showed significantly different composition and formed more condensed, less fluid monolayers than did lipids from sensitive cells. Doxorubicin, used as a model anticancer agent, showed a strong hydrophobic interaction with resistant cell membrane lipids but significantly less interaction, as well as a different pattern of interaction (i.e., ionic), with sensitive ones. The threshold intracellular doxorubicin concentration required to produce an antiproliferative effect was similar for both sensitive and resistant cell lines, suggesting that drug transport is a major barrier in determining drug efficacy in resistant cells. In addition to the biophysical characteristics of resistant cell membrane lipids, lipid-doxorubicin interactions appear to decrease intracellular drug transport via diffusion as the drug is trapped in the lipid bilayer. The rigid nature of resistant cell membranes also seems to influence endosomal functions that inhibit drug uptake when a liposomal formulation of doxorubicin is used. In conclusion, biophysical properties of resistant cell membrane lipids significantly influence drug transport, and hence drug efficacy. A better understanding of the mechanisms of cancer drug resistance is vital to developing more effective therapeutic interventions. In this regard, biophysical interaction studies with cell membrane lipids might be helpful to improve drug transport and efficacy through drug discovery and/or drug delivery approaches by overcoming the lipid barrier in resistant cells.
Keywords: membrane fluidity, lateral heterogeneity, drug response, nanocarriers, doxorubicin, Doxil
Introduction
The interactions of cell membrane lipids with drugs/nanocarriers are critical to our understanding of drug transport mechanisms and their impact on drug efficacy.1, 2 This knowledge is particularly important to cancer therapy, because many drugs have intracellular targets, and the cell membrane could act as a barrier to drug/nanocarrier transport to these targets.3, 4 One factor that might explain the difference in drug efficacy in resistant vs. sensitive cancer cells is the limited drug transport that occurs across the membranes of resistant cells.5–7 Hence, it is essential to understand the lipid-drug/nanocarrier interactions to develop effective strategies to circumvent the problem of drug delivery to resistant cells.
It has been realized in recent years that the cell membrane is not just an inert lipid bilayer in which proteins are embedded and/or cytosol and intracellular vesicles are enclosed; rather, the lipid bilayer is a dynamic heterogeneous structure with caveoles, lipid rafts, and microdomains.8, 9 Lipids also play an important role in cell signaling through plasma membrane lipid rafts.10 Alterations in membrane lipid composition have also been reported in various disease conditions,11 including cancer and certain neurological and inflammatory conditions.12, 13 Furthermore, drug-lipid interactions have been used to predict the pharmacokinetic properties of drugs, such as their transport, biodistribution, and accumulation in various body compartments.14 These studies emphasize the importance of membrane lipids and their role in disease conditions and drug interactions.
The complexity of lipid composition as well as the dynamics of lipid-lipid and lipid-protein interactions within the cell membrane limits the investigation of interaction between drugs and cell membrane lipids in real time because of the lack of suitable detection techniques in living cells.8, 9 To address this problem, model membranes, such as Langmuir monolayers, liposomes, and supported lipid bilayers, have been extensively used to mimic many essential aspects of the cell membrane.1, 15 Langmuir model membranes have the advantage that external parameters such as temperature, surface pressure (SP), molecular area, and subphase can be set to imitate biological conditions.15, 16 In addition, this model allows one to control the lateral molecular packing of lipids. In our previous studies, we have shown that the Langmuir technique can be used to investigate biophysical interactions between endothelial cell model membrane and nanoparticles of different physical and surface properties.17–19
In this study, we isolated lipids from doxorubicin-sensitive (MCF-7) and -resistant (MCF-7/ADR) breast cancer cells to (i) characterize the biophysical properties of membrane lipids, particularly lipid packing and membrane fluidity and (ii) study the biophysical interactions with a model drug (doxorubicin and its injectable pegylated liposomal formulation, Doxil) to determine whether uptake of the drug can be explained on the basis of biophysical interactions with membrane lipids. We separated hydrophobic proteins from cell lipid extracts to ensure that the observed differences in biophysical characteristics between sensitive and resistant cells could be attributable only to the lipids. We showed significant differences in the biophysical properties of the lipids of the resistant vs. sensitive cell membranes as well as their interactions with doxorubicin that may, in part, explain the difference in drug response between sensitive and resistant cells.
Experimental Section
2. Materials and Methods
2.1. Materials
Hydrochloric acid, sodium chloride, isopropanol, petroleum ether, glacial (water-free) acetic acid, ethanolic phosphomolybdic acid, copper sulfate pentahydrate, 98% sulfuric acid, 85% orthophosphoric acid of reagent grade, and chloroform, methanol, and isopropanol of high-performance liquid chromatography grade were purchased from Fisher Scientific (Pittsburgh, PA). Ethylenediaminetetraacetic acid, Tris (hydroxymethyl)aminomethane, ammonium hydroxide, and diethyl ether were purchased from Sigma-Aldrich (St. Louis, MO). Doxorubicin HCl was purchased from Drug Source Co. LLC (Westchester, IL), and Doxil (doxorubicin HCl liposome injection) from Ortho Biotech, (Raritan, NJ).
2.2. Cell Culture
Doxorubicin-sensitive (MCF-7) and -resistant (MCF-7/ADR) breast cancer cells were grown in T-162 cell culture flasks at 37 °C in a 5% CO2 atmosphere. Sensitive cells were cultured in Eagle’s minimum essential medium supplemented with Earle’s salts, L-glutamine, 10% fetal bovine serum, 100 µg/mL penicillin and 100 µg/mL streptomycin. Resistant cells were cultured with 15% fetal bovine serum containing minimum essential medium. The cell culture media used to culture both cell lines were obtained from the Central Cell Services’ Media Laboratory of our institution. To maintain drug resistance, cells were cultured in a medium containing 100 ng/mL doxorubicin after every two passages.
2.3. Lipid Extraction
Lipids were extracted using a modified Bligh and Dyer method.20 In a typical procedure, cells at 80–90% confluency were scraped in 10 mL sterile water using a Corning® cell scraper (Lowell, MA). Cell suspensions from five flasks were combined and centrifuged at 1,300 rpm and 4 °C for 7 min using a Sorvall Legend RT centrifuge (Thermo Electron Corp. Waltham, MA). The cell pellet was suspended in sterile water, lyophilized for 48 h at −48 °C, 3.5 Pa (FreeZone 4.5, Labconco Corp., Kansas City, MO) and stored at −80 °C. To extract lipids, the lyophilized cell mass was resuspended in 3 mL of nitrogen-purged sterile water to which a 10.2 mL mixture of chloroform:methanol:1 M HCl (10:23:1 v/v) was added, vortexed thoroughly, and then kept on an ice bath for 15 min to obtain a clear monophasic cell mass suspension. To the cell mass suspension, 3 mL of 0.1 M HCl and 3 mL chloroform were added. The suspension was vortexed, then centrifuged at 3,500 rpm at 0 °C for 5 min.
Centrifugation results in the separation of the cell mass into two phases: an aqueous phase at the top contains aqueous soluble contents of cells; an organic phase at the bottom contains lipids. The organic phase was collected carefully using a Hamilton syringe (Hamilton Co., Reno, NV) in a glass vial (Fisher Scientific) and was mixed with 3 mL of a sodium chloride-Tris-ethylenediaminetetraacetic acid (STE) buffer mixture (1 M NaCl, 0.1 M ethylenediaminetetraacetic acid, 0.05 M Tris buffer, pH ~8.20). The above protocol was repeated one more time, and the organic phase collected from the second extraction was added to the above-mentioned STE buffer. The mixture of STE buffer and organic phases from the two extractions was further separated by first vortexing and then centrifugation as above. The organic phase containing lipids was collected in glass vials and mixed with isopropanol (for every 15 mL of organic phase, 1 mL of isopropanol was added).
Protein Separation from Lipid Extracts
The lipid extracts mentioned above contain hydrophobic proteins that were removed by column chromatography as follows. A glass column with a reservoir (Sigma-Aldrich) was packed with 2 g of silica gel (Polygosyl-60, Macherey-Nagel, Inc., Bethlehem, PA). Silica slurry was prepared by adding 2 g of silica to 15 mL of chloroform:methanol (1:1 v/v) mixture containing 1% NH4OH; the slurry was packed in the glass column; the column was rinsed first with 45 mL of chloroform:methanol (1:1 v/v) to remove traces of HCl, then with 45 mL of 1.5 µmol egg-phosphatidylcholine (PC) (Avanti Polar Lipids, Alabaster, AL) to saturate the binding sites of silica to PC so that the PC present in the lipid extract could be eluted. A 10-mL lipid extract was added to the column, and it was eluted sequentially, first with 45 mL of chloroform alone, next with the same volume of 1:1 chloroform:methanol mixture (1:1 v/v), and finally with the same volume of methanol alone. The elutents were collected separately and then mixed; the organic solvents from the lipid extract were removed using a Rotavapor rotary evaporator at 318 mbar and 50 °C (R-215, Buchi Corp., New Castle, DE). The lipid residues were dissolved in a nitrogen-purged chloroform:methanol mixture (4:1 v/v) and stored at −20 °C until used.
Fourier Transform Infrared Spectrometric Analysis of Lipids
To ensure removal of hydrophobic proteins, following column separation the lipid extracts were analyzed using a Fourier transform infrared (FTIR) spectrometer (Spectrum 100 FTIR spectrometer, PerkinElmer, Shelton, CT) with a ZnSe attenuated total reflectance objective. In a typical measurement, 5 µL of lipid extract (5 mg/mL) was added to attenuated total reflectance cells, and a 10-min wait time was allowed for the chloroform to evaporate before the scan. A total of 32 sample and background scans were measured from wavelengths of 400–4,000 cm−1.
2.4. Lipid Analysis
Phospholipid and neutral lipid (NL) separation was achieved by using the high-performance thin-layer chromatography (HPTLC) technique.21 In a typical experiment, plates (10 cm × 10 cm, Sigma-Aldrich), were dried at 140 °C for 30 min, and a 5 µL aliquot of 5 mg/mL of lipid solution was added at a distance of 1 cm from the bottom. To separate the phospholipids, the mobile phase consisting of a mixture of chloroform:methanol:water:ammonia (120:75:6:2 v/v) was allowed to run in a trough chamber containing 50 mL of mobile phase for a distance of 8 cm from the point at which lipid samples were added. To separate NLs, the identical protocol as above was used, but the mobile phase consisted of petroleum ether:diethyl ether:glacial acetic acid (80:20:1 v/v). The plates were dried in a fume hood under nitrogen gas for 15 min. Different phospholipids were identified by immersing them in a copper sulfate solution for 5 s, followed by heating at 140 °C for 30 min, whereas NLs were marked by using 5% ethanolic phosphomolybdic acid solution. The phospholipid staining solution was prepared by adding 20 g of copper sulfate pentahydrate to a mixture of solvents consisting of 200 mL of methanol, 8 mL of 98% sulfuric acid and 8 mL of 85% orthophosphoric acid.
2.5. Lipid Isotherms
A KSV minimicro Langmuir balance (KSV Instruments, Helsinki, Finland) was used to study the Langmuir monolayer behavior of the lipids isolated from sensitive and resistant cell lines. To obtain a complete SP (π)-area (A) isotherm, a chloroform:methanol (4:1 v/v) solution (5 mg/mL) of the lipid mixture of each cell line was spread onto the subphase at different initial SPs, and the lipids were compressed at 5 mm/min following a 10-min wait time. Because of the limited trough area in our KSV system, a complete isotherm could not be collected in a single experiment; hence different parts of the isotherm were collected to construct the complete isotherm.
2.6. Atomic Force Microscopic Analysis of Lipid Membranes
The Langmuir-Blodgett (LB) films of the sensitive and resistant cell membrane lipids were transferred onto a glass substrate at SPs of 20, 30, and 40 mN/m. Different SPs were chosen so that the arrangement of lipids could be monitored with compression. A clean glass substrate (24 × 55 mm) was immersed into the subphase prior to the deposition of lipids onto it. The lipids were compressed until the desired SP was reached; Langmuir films were then transferred onto the glass substrate by lifting vertically at the rate of 5 mm/min through the monolayer. The transfer ratio for all LB films ranged from 0.9 to 1.2. A similar transfer was carried out following interaction of the cell membrane lipids with doxorubicin for 20 min at 30 mN/m. This SP was chosen as it is known to be equal to the lateral pressure that exists in the cell-membrane bilayer.1, 18, 19 Therefore, the arrangement at this SP would be most likely to mimic the arrangement of lipids in the cell membrane. The LB films were allowed to dry in a vacuum desiccator at room temperature for 24 h. The dried films were then analyzed for surface morphology using a BioScope atomic force microscope (AFM; Veeco Metrology, Inc., Santa Barbara, CA) in tapping mode using a 125-µm-long silicon probe with a resonance frequency of approximately 300 Hz and a tip radius of <10 nm (Ted Pella, Inc., Redding, CA).
2.7. Doxorubicin Interaction with Sensitive and Resistant Cell Membrane Lipids
In a typical procedure, 6.5 µL of the respective lipid solution (5 mg/mL) was added onto the subphase and compressed as above until SP reached 30 mN/m. A 5-min wait time was allowed to ensure the stability of the cell-membrane lipid. An aliquot of 10 µL (1 mg/mL) of doxorubicin solution in an ethanol:water (1:1 v/v) mixture was injected into the subphase using a Hamilton glass syringe. To investigate the effect of Doxil on the SP of lipid membrane, 50 µL of Doxil (which contains 1 mg/mL doxorubicin) was injected into the subphase. The change in SP of the lipid membrane was monitored for 20 min following the injection. Ten microliters of ethanol:water (1:1 v/v) without doxorubicin was injected as a control for doxorubicin, whereas 50 µL of de-ionized water was injected as a control for Doxil.
2. 8. Doxorubicin Cellular Uptake
Doxorubicin uptake in sensitive and resistant breast cancer cells was studied with drug in solution or Doxil at different incubation time. Additionally, in resistant cancer cells, doxorubicin uptake was studied at the 4-h point by incubating with different concentrations of drug in solution. The concentration-dependent uptake study in resistant cells was carried out to examine the cytotoxic effects of drug at very high concentrations. In a typical uptake experiment, cells (~1.2 × 10⁵ cells/well/mL) were seeded onto 24-well plates and cultured until they reached 90% confluency in about 2 d. Media in the culture plate were changed on the second day and replaced with medium containing doxorubicin or Doxil (1 µg/mL/well). Cells were incubated for different time periods at 37 °C in a CO2 incubator; then the cell culture medium was removed, and the cells were washed twice with ice-cold phosphate-buffered saline. Whole cell lysates were prepared in cold radioimmunoprecipitation assay (RIPA) buffer (Sigma-Aldrich) containing 1x protease inhibitor cocktail (Calbiochem, Gibbstown, NJ). In a typical procedure, 200 µL of RIPA buffer was added to each well, and cells were scraped and were collected in 1.5-mL Eppendorf tubes. Cell samples in RIPA buffer were sonicated for three 5-s bursts at an energy output of 25 W (Sonicator® XL, Misonix, Inc., Farmingdale, NY) over an ice bath to avoid heating of the sample and protein denaturation. Cell lysate (20 µL) from each well was used to determine the total protein content using the Pierce BCA protein assay kit (Pierce Biotechnology, Rockford, IL). The remaining cell lysate from each well was lyophilized at −48 °C, 3.5 Pa for 48 h.
To each lyophilized cell lysate, 1 mL of methanol was added, and the samples were kept in a LabRoller rotator (Denville Scientific, Inc., Metuchen, NJ) for 18 h in a cold room. The samples were centrifuged in a microcentrifuge (Eppendorf 5417R, Eppendorf North America, Inc., Hauppauge, NY) at 14,000 rpm for 10 min at 4 °C. The supernatant from each sample was collected and analyzed for doxorubicin levels using a high-performance liquid chromatography (Shimadzu Scientific Instruments, Columbia, MD). The chromatographic analysis was performed using a Nova-Pak C8 column (4 µm, 2.1 × 150 mm; Millipore-Waters, Milford, MA) as a stationary phase. The mobile phase was a mixture of acetonitrile:water:triethylamine (25:75:0.1, v/v) with pH adjusted to 3 with orthophosphoric acid. Samples were injected using a Shimadzu SIL-20AHT auto sampler with a 25-µL loop. Separation of the analytes was performed in the isocratic elution mode for 6 min at a flow rate of 1.0 mL/min. Analytes were detected using a Shimadzu RF-10 AXL fluorescence detector. The detector was set at 480 nm and 560 nm (excitation and emission wavelengths, respectively) with gain 4 and high sensitivity. A standard plot of doxorubicin in solution and Doxil (1–25 ng/mL) was prepared for the cell lysates under identical conditions.
2.9. Cytotoxicity of Doxorubicin
Cytotoxicity of doxorubicin in solution and with Doxil was studied at 3-d and 6-d post-treatment in both sensitive and resistant breast cancer cells. In a typical experiment, respective cells were seeded at ~3,000 cells per well/0.1 mL in 96-well plates (Microtest, Becton Dickinson Labware, Franklin Lakes, NJ). Following 24 h incubation, culture medium in wells was replaced with a medium containing different concentrations of drug either as a drug in solution or Doxil formulation. Cell viability was measured at 3- and 6-d post-treatment using a MTS assay (Promega CellTiter 96 AQueous Promega, Madison, WI). In the experiment involving 6-d treatment, cells were incubated with drug for 3 d as above and then in drug-free medium for another 3 d prior to MTS assay. Prior to MTS assay, cells were washed with PBS and an aliquot of 20 µL of the MTS reagent was added to each well, the plates were incubated for 2 h at 37 °C, and color intensity was measured at 490 nm using a plate reader (Bio-Tek Instruments, Inc., Winooski, VT). The effects of the drug on cell proliferation were calculated as the percentage cell growth vs. growth of control cells that received no drug treatment. IC50 values for each treatment were calculated using the following equation:
where, x = drug concentration, y = % cell growth as determined by MTS assay, A1 = % growth on the top plateau region of the growth curve, A2 = % growth at the bottom plateau region of the curve, x0 = inflexion point of the curve, and p = slope. The data points were fit to this equation using Origin 7.5 (OriginLab Corporation, Northampton, MA). IC50 was determined by using y = 50 in the above equation and calculating x using the parameters obtained after curve fitting. Mean of six replicates for each set of experiment was used to calculate IC50.
2.10. Statistical Analysis
Values are represented as mean ± standard error of mean (SEM). Statistical analyses were performed using Student’s t test. The differences were considered significant for p values of ≤ .05.
3. Results
3.1. Protein Separation
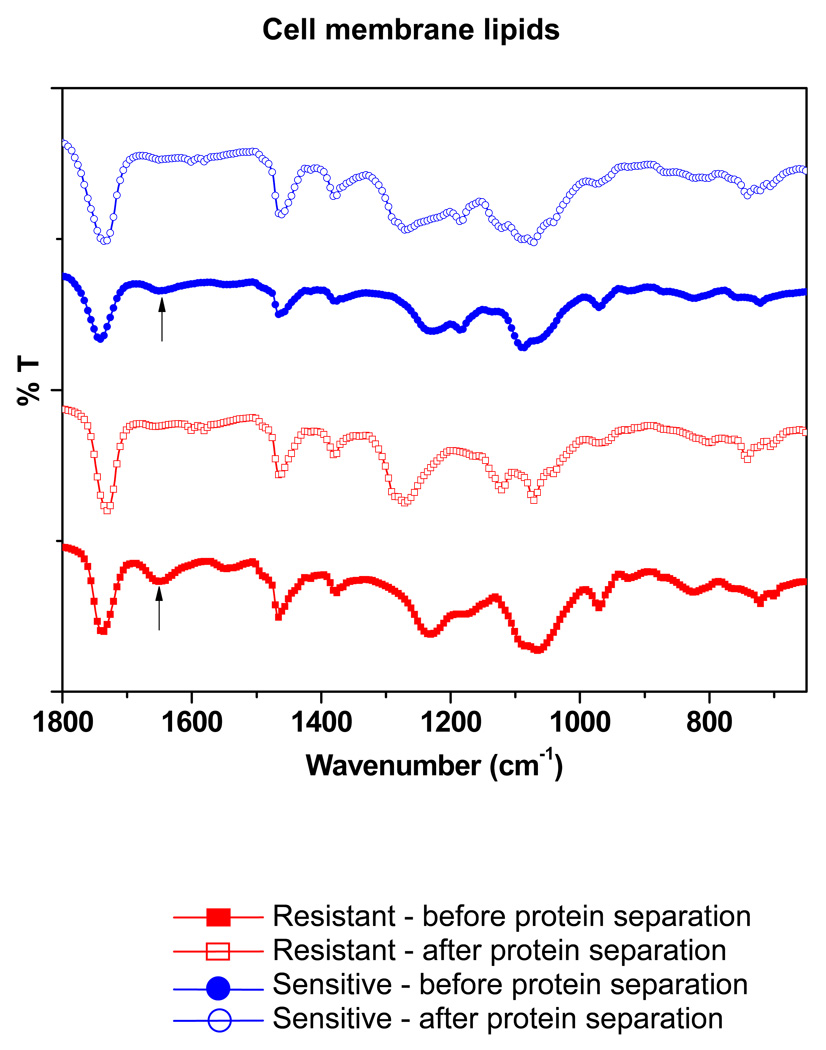
The FTIR spectra of the lipid extracts of both sensitive and resistant cells showed the absence of a peak at ~1,650 cm−1 following protein separation, which is typical for the peptide bond, indicating the successful removal of hydrophobic proteins from the lipid extracts (Figure 1). The FTIR spectrum of bovine serum albumin (Sigma-Aldrich) was taken as a standard for this protein peak (spectrum not shown).
Figure 1.
Analysis of sensitive vs. resistant cell membrane lipids following hydrophobic protein separation. FTIR spectra show the absence of a peak at 1650 cm−1 (shown with arrows), corresponding to a peptide following column separation of lipids.
3.2. Composition of Sensitive and Resistant Cell Membrane Lipids
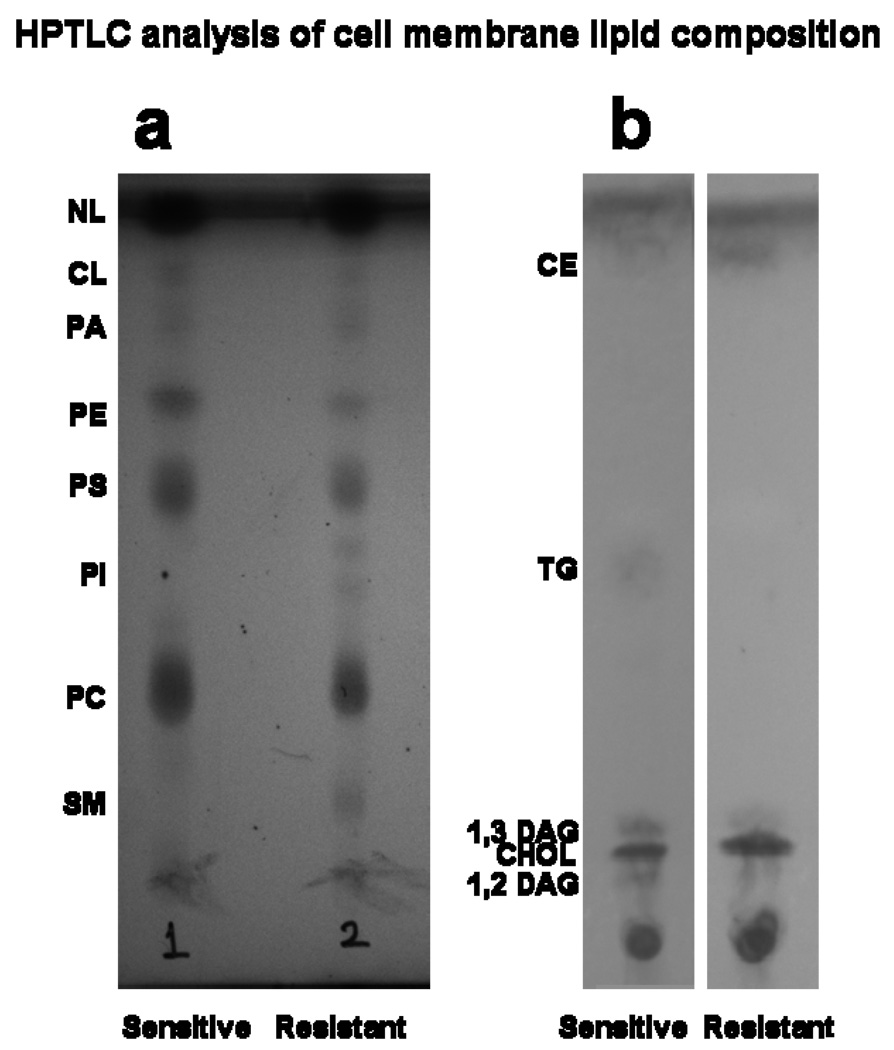
HPTLC showed that the phospholipid and NL composition of the sensitive vs. resistant cell-membrane lipids is significantly different (Figure 2). Most notably, the phosphatidylinositol spot was seen only in the resistant cell lipid extract. The phosphatidylethanolamine spot was darker in the sensitive cell lipids than in the resistant cell lipids (Figure 2a). NL separation clearly shows that cholesterol and cholesterol ester spots are darker in resistant cell membrane lipids (Figure 2b). Further analysis of the HPTLC plate using ImageQuant TL software (ImageQuant 300, GE Healthcare Bio-Sciences Corp., Piscataway, NJ) provided the relative concentrations of different phospholipids and NLs. In phospholipids, the amount of sphingomyelin (SM) was nearly four-fold in resistant cell lipids than in sensitive cell lipids, whereas the amount of phosphatidylethanolamine was almost double in sensitive cell lipids than in resistant cell lipids (Table 1). In NLs, the amounts of cholesterol and cholesterol ester were 1.5- and 2.5-fold greater, respectively, in resistant cell lipids than in sensitive cell lipids (Table 2).
Figure 2.
Phospholipid separation and quantification of different lipids in sensitive vs. resistant cell membrane lipid extracts by HPTLC. Representative data from four different lipid extracts from each cell line.
Table 1.
Relative concentration of different phospholipids in total lipids
| Lipids | Sensitive cells | Resistant cells |
|---|---|---|
| SM | 0.72 | 4.12 |
| PC | 32.73 | 21.8 |
| PI | 0 | 2.03 |
| PS | 16.96 | 12.38 |
| PE | 7.7 | 3.59 |
| PA | 0.52 | 1.58 |
| CL | 2.57 | 1.15 |
| NL | 38.79 | 51.27 |
SM, sphingomyeline; PC, phosphatidylcholine; PI, phosphatidylinositol; PS, phosphatidylserine; PE, phosphatidylethanolamine; PA, phosphatic acid; CL, cariolipin; NL, neutral lipid.
Table 2.
Relative concentration of different neutral lipids
| Neutral lipids | Sensitive cells | Resistant cells |
|---|---|---|
| 1,3 DAG | 15.17 | — |
| CHOL | 52.43 | 78.67 |
| TG | 12.31 | 3.1 |
| CE | 4.93 | 13.53 |
DAG, diacylglycerol; CHOL, cholesterol; TG, triglycerides; CE, cholesterol esters.
3.3. Isotherm and Compression Modulus of Sensitive and Resistant Cell Membrane Lipids
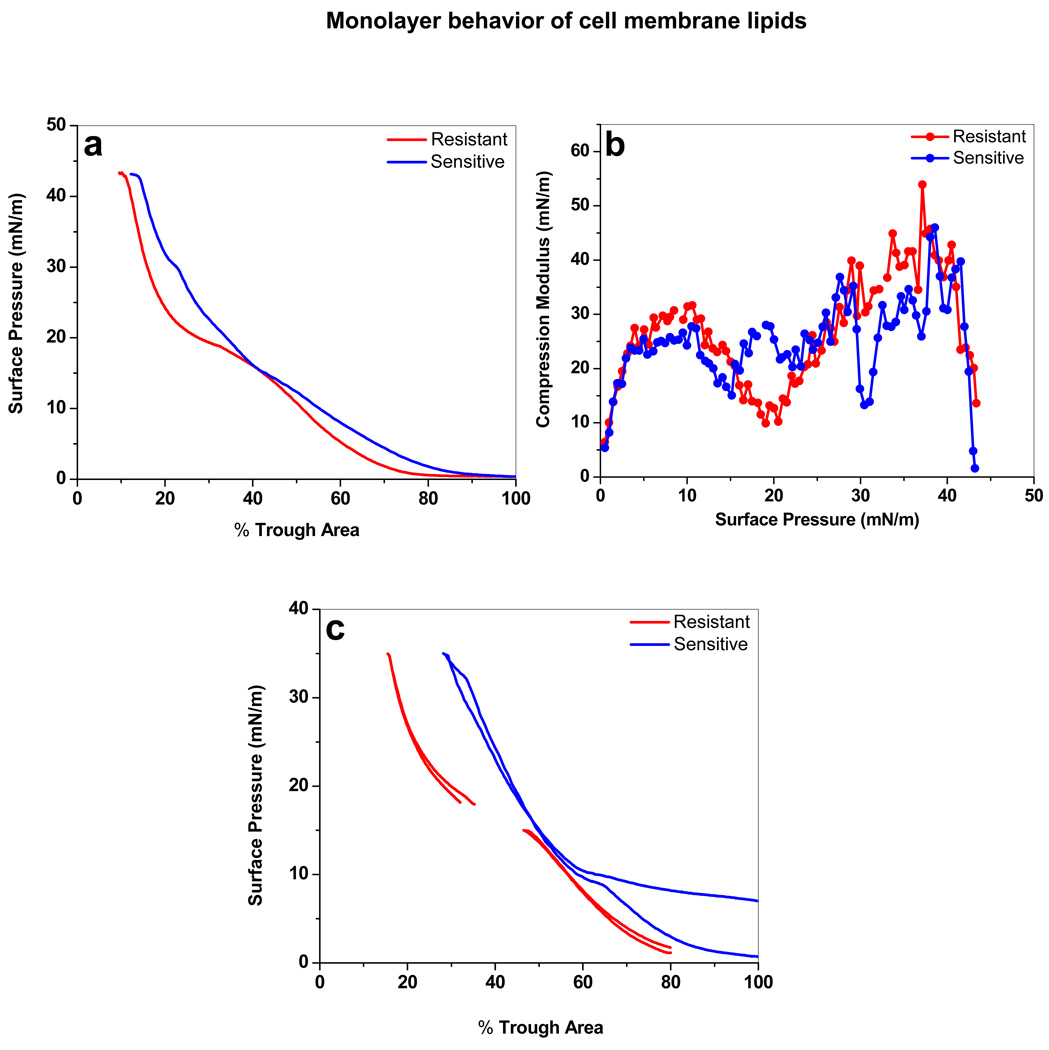
The shape of the compression isotherm (π-A) of the sensitive and resistant cell lipids differed (Figure 3a). The isotherm of the sensitive cell-membrane lipids began at a 95% trough area, whereas that of the resistant cell membrane lipids began at a 75% trough area. The sensitive cell membrane lipid isotherm showed a gradual increase in SP until the collapse at SP 42 mN/m, with a small kink at SP 30 mN/m. The resistant cell lipid isotherm showed a gradual increase in SP until 17.5 mN/m, followed by a pseudo-plateau until SP 19 mN/m, then a rapid increase in SP with further compression until the collapse at SP 42 mN/m.
Figure 3.
Biophysical characterization of the lipids isolated from resistant vs. sensitive cells. (a) Compression isotherm (π-A) of sensitive and resistant cell membrane lipids. To obtain a complete isotherm, the lipid extract was spread onto the subphase at different initial SPs, and the lipids were compressed at 5 mm/min. Different parts of the isotherms were collected in two experiments. Data from these experiments were copied into one plot, and the overlapping regions were merged to show the complete isotherm. (b) Compression modulus of Langmuir films over the entire SP range for sensitive vs. resistant cell membrane lipids. Compression modulus was calculated from π-A isotherm data using Cs−1 = − A* (dπ/dA). (c) Compression-expansion isotherm of sensitive vs. resistant cell membrane lipids shows mixing and demixing of lipids.
Two-dimensional surface compression modulus, which characterizes the monolayer’s resistance to compression, was calculated from the SP-area (π-A) isotherm data using the following equation: Cs−1 = − A* (dπ/dA), where A is the trough area and π the corresponding SP.22, 23 The compression modulus of each Langmuir monolayer was plotted against the SP (Figure 3b). At low SP, sensitive and resistant cell lipids showed a compression modulus of <10 mN/m. A significant difference between the sensitive and resistant cell membrane lipid monolayer compression modulus was observed at SP 20 and 30 mN/m. At SP 20 mN/m, resistant cell membrane lipids showed a significantly lower compression modulus (9.5 mN/m). Sensitive cell membrane lipids, on the other hand, showed a low compressibility modulus (13 mN/m) at SP 30 mN/m. The maximum compression modulus for both the cell-membrane lipid monolayers was observed prior to the collapse SP (~40 mN/m). The compression-expansion isotherm of both sensitive and resistant cell lipids showed the reversibility of the lipid monolayers on the buffer surface (Figure 3c).
3.4. Surface Morphology of Sensitive vs. Resistant Cell Membrane Lipids
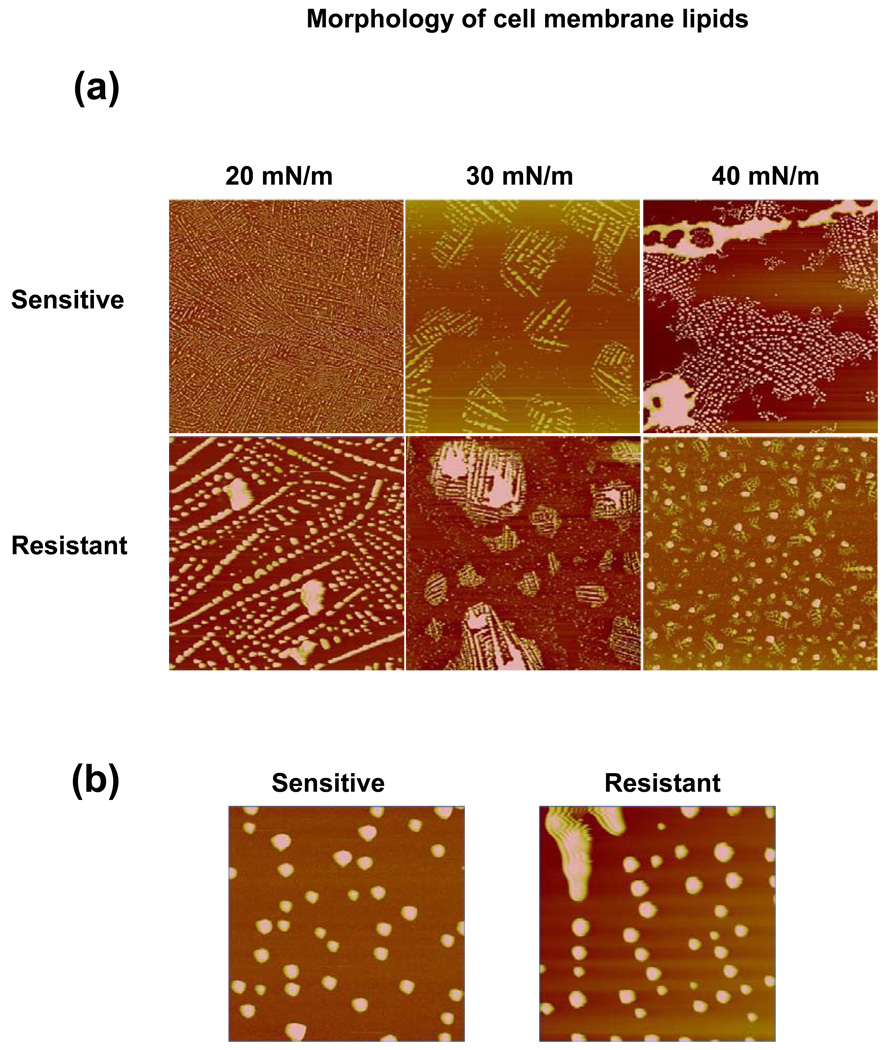
The comparative surface morphology of the sensitive and resistant cell membrane lipid LB films demonstrated differences in the arrangement at the interface with changing SP (Figure 4a). At SP 20 mN/m, the AFM images of the LB films of both types of cell-membrane lipids showed similar structures throughout the large scan area. Magnified AFM images clearly show that these structures are mostly spherical in shape (Figure 4b). At SP 30 mN/m, both the sensitive and resistant cell-membrane lipids showed phase separation of spherical structures. The resistant and sensitive cell-membrane lipids clearly showed bright thick regions (domain structures) surrounded by dark liquid-expanded regions. At SP 40 mN/m, resistant cell membrane lipids showed domain structures that were further condensed and more in number, whereas the sensitive cell membrane lipids showed domain structures that appeared to have fused to increase in size.
Figure 4.
Morphological analysis of the LB films of resistant vs. sensitive membrane lipids using an AFM. (a) Height images of the LB films of resistant and sensitive cell membrane lipids transferred at different SPs. Scan size = 40 µm; height scale = 300 nm. Resistant and sensitive cell membrane lipids show phase separation but form distinctly different domains upon compression. (b) Magnified AFM images of LB films at SP 20 mN/m. Scan size = 10 µm; height scale = 100 nm.
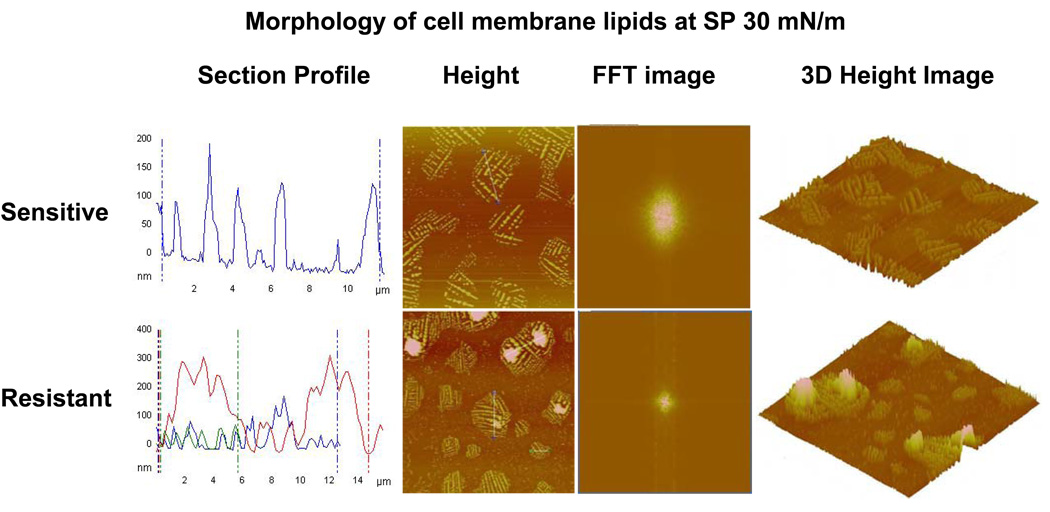
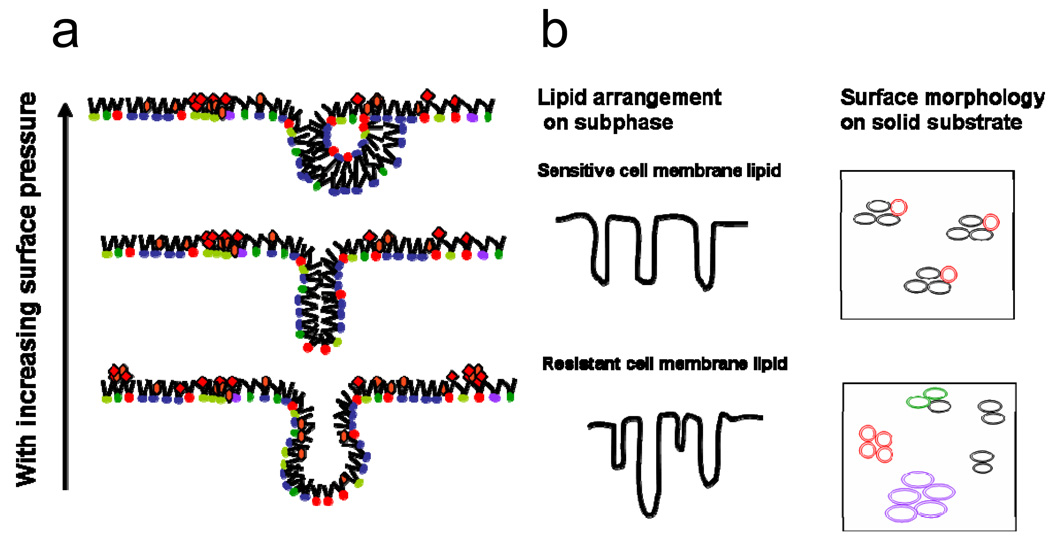
Detailed analysis of the surface morphology of the LB films transferred at SP 30 mN/m using AFM revealed that the arrangements of lipid monolayers were significantly different for the sensitive vs. resistant cell membrane lipids (Figure 5). Section analysis of the height images showed that the domain structures of the sensitive cell membrane lipids were uniform (width, ~10 µm; height, ~100 nm), whereas those of the resistant cell membrane lipids were larger and markedly heterogeneous in size (width, 6–15 µm; height, 50–300 nm). The average height (120 nm) of the spherical structures formed with resistant cell membrane lipids was significantly higher than the average height (30 nm) of structures formed with sensitive cell membrane lipids. Fast Fourier transformation (FFT) images showed that the resistant cell-membrane lipid LB films were more condensed compared to the sensitive cell-membrane lipid LB film. Three-dimensional AFM height images also showed significantly greater lateral heterogeneity in the resistant cell-membrane lipid LB film than in sensitive cell-membrane lipid LC film. Figure 6 depicts the schematic representation of domain formation with compression of lipids.
Figure 5.
Morphological analysis of domains of lipids obtained from resistant and sensitive cells. The LB films were transferred at SP 30 mN/m and analyzed using an AFM. Section profiles of the height images show large and more heterogeneous domains for resistant cell membrane lipids than for sensitive cell membrane lipids. FFT images of the corresponding height images revealed that resistant cell membrane lipids form more condensed film than sensitive cell membrane lipids. The 3D height image clearly shows a greater degree of lateral heterogeneity in the LB films of resistant cell membrane lipids than sensitive cell membrane lipids, thus confirming the section profile analysis.
Figure 6.
A schematic representation of the monolayer behavior of a complex lipid mixture with compression. (a) Upon lateral compression, saturated and unsaturated phospholipids as well as NLs (cholesterol, triglycerides) become unstable at very high surface density and form bilayer folds. The bilayer folds can bend to form semi-vesicles. (b) A schematic representation of differences in lipid arrangement on the subphase and on solid substrate between sensitive and resistant cell membrane lipids. Lipids extracted from sensitive cells form vesicles, which are uniform and have similar interfacial characteristics, whereas in resistant cells, because of the higher number of lipid species, vesicles with different interfacial characteristics are formed. Domains are formed due to differences in interfacial characteristics, which arise due to differences in the head group, a hydrophobic chain length of lipids in different vesicles.
3.5. Doxorubicin Interactions with Cell Membrane Lipids
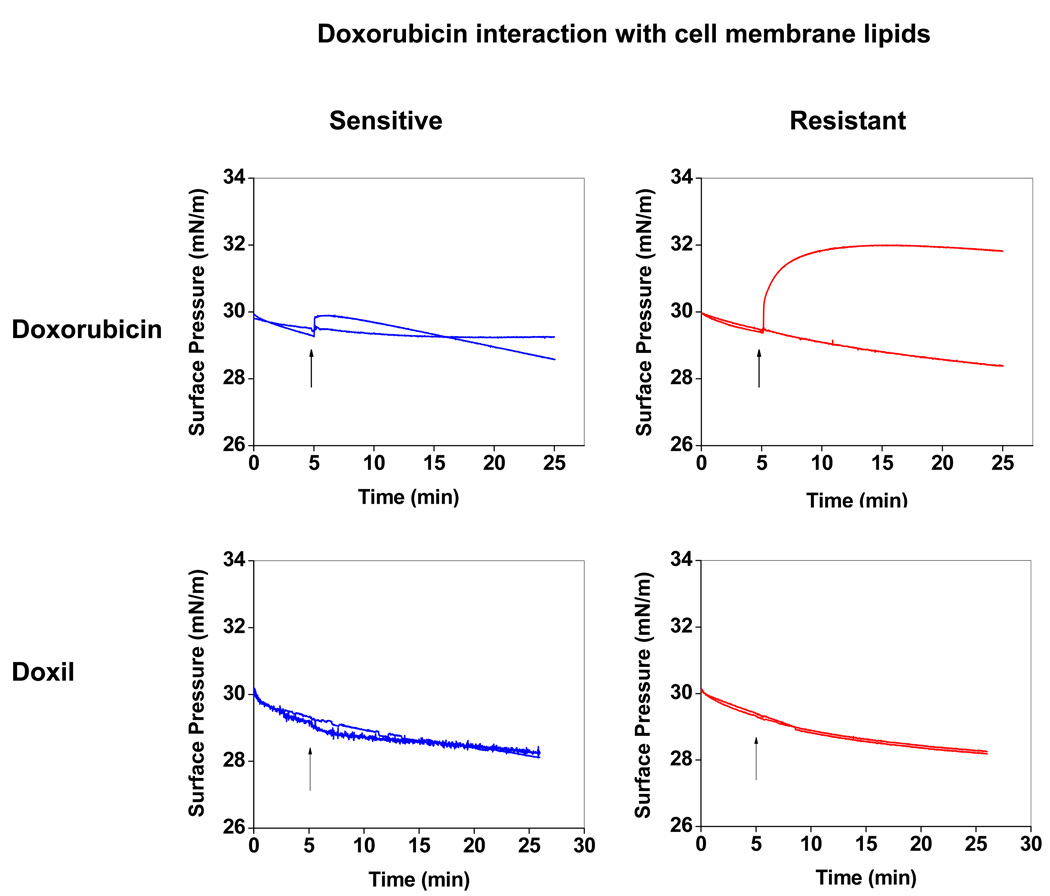
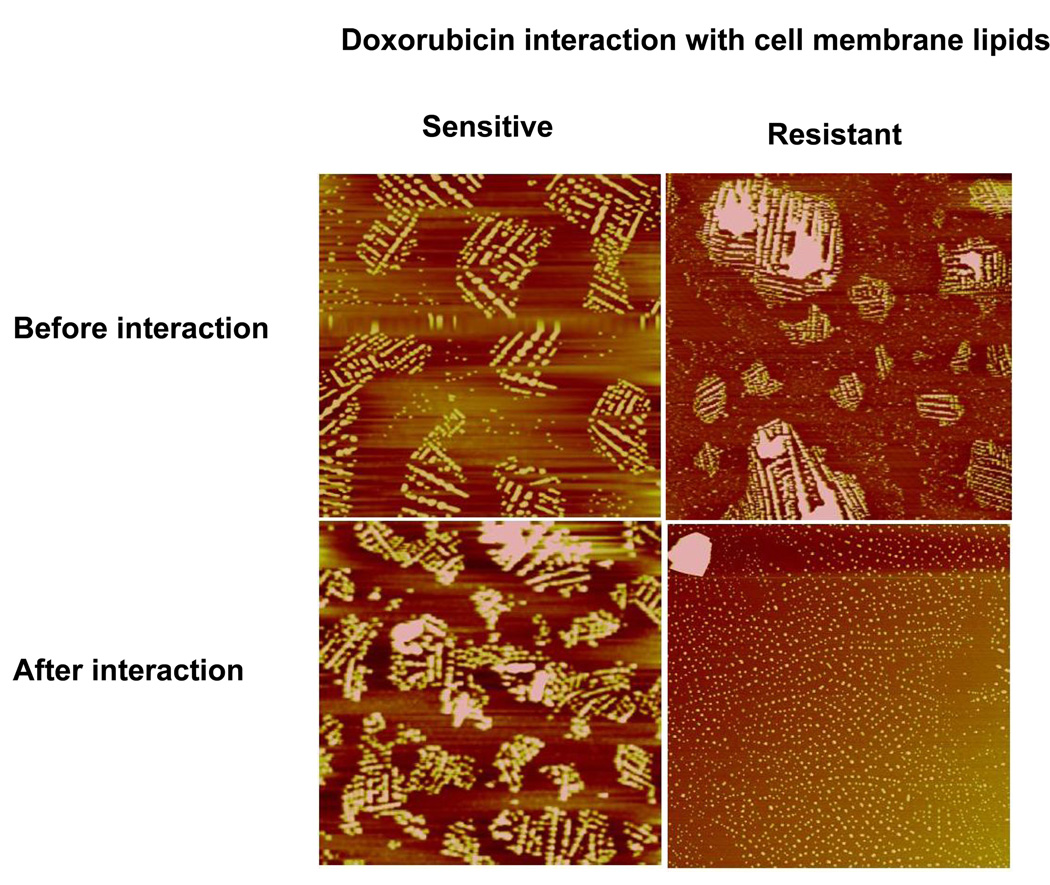
The interaction of doxorubicin with sensitive vs. resistant cell lipid membranes differed, as evidenced by the difference in the change in SP over time. The sensitive cell lipid membrane showed an initial increase in SP following interaction with doxorubicin, but it was insignificant compared to the increase in SP of the resistant cell lipid membrane. In addition, the sensitive cell lipid membrane showed a gradual decrease with time after an initial increase, whereas the resistant cell lipid membrane showed almost an exponential increase in SP with time. Following 20 min of interaction with doxorubicin, the SP of the resistant cell membrane lipid was significantly above the baseline (control), whereas it was slightly below the baseline (control) for the sensitive cell lipid membrane (Figure 7). Interaction with Doxil did not produce any change in SP in either the sensitive or resistant cell lipid membranes (Figure 7). The AFM images show that prior to interaction with doxorubicin, both resistant and sensitive cell lipid membranes showed phase separation and domain formation. However, following interaction with doxorubicin, resistant cell membrane lipids formed significantly smaller domains; but there was no effect on domain formation of sensitive cell membrane lipids (Figure 8).
Figure 7.
Changes in SP of sensitive and resistant membrane lipids following interaction with doxorubicin in solution and Doxil. Ten microliters of doxorubicin (1 mg/mL in ethanol:water [1:1 v/v] or 50 µL of Doxil (1 mg/mL doxorubicin) was injected into the subphase, and the change in SP was recorded immediately with time. Similarly, 10 µL of ethanol:water (1:1 v/v) without drug was injected as a control for doxorubicin, whereas 50 µL of water was injected as a control for Doxil. Representative data from four different repeats.
Figure 8.
Effect of doxorubicin interaction on the morphology of cell membrane lipids. LB films were transferred at SP 30 mN/m prior to and after interaction with doxorubicin for 20 min. Height scale for all images is 150 nm. The LB film of the sensitive cell membrane lipids did not change following interaction with doxorubicin, but resistant cell membrane lipids showed inhibition of phase separation following interaction with doxorubicin.
3.6. Doxorubicin Cellular Uptake
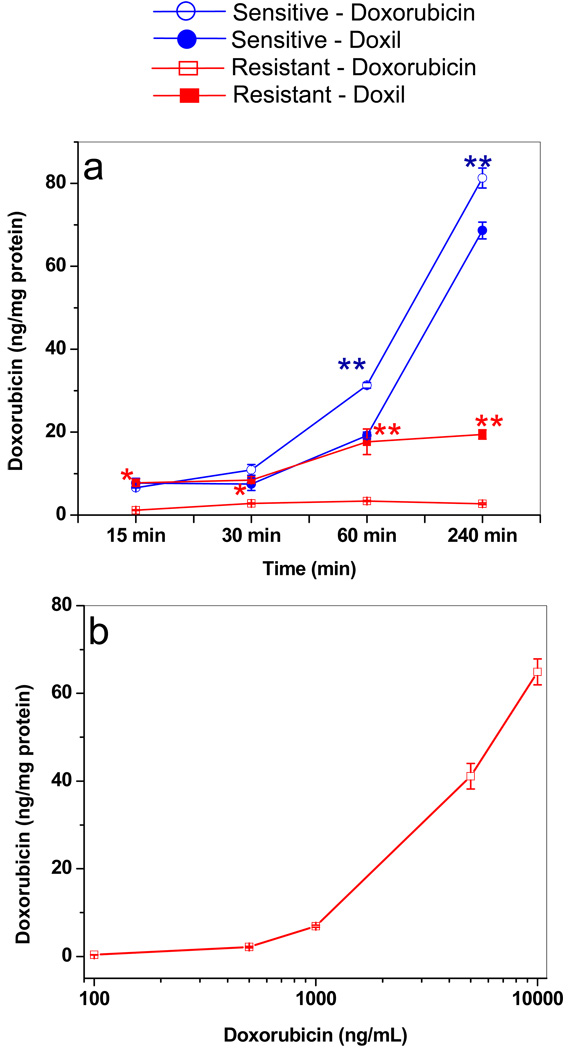
Drug uptake was greater in sensitive cells treated with doxorubicin in solution than in resistant cells, and this uptake increased with longer incubation. In contrast, drug uptake did not change in the resistant cells, even when they were incubated longer (Figure 9a). Drug uptake was slightly higher in sensitive cells treated with doxorubicin in solution than with Doxil. The opposite was true for resistant cells; in these cells, drug uptake with Doxil was greater than that with doxorubicin in solution. Interestingly, for up to a 60-min incubation time, drug uptake with Doxil was almost the same in both resistant and sensitive cells, but thereafter, uptake continued to increase in sensitive cells with longer incubation time but remained unchanged in resistant cells. Drug uptake in resistant cells did not change significantly at 100–1,000 ng/mL, but there was a marked concentration-dependent increase in uptake at 1,000–10,000 ng/mL (Figure 9b).
Figure 9.
Doxorubicin uptake in resistant and sensitive cells. (a) Drug uptake in cells treated with doxorubicin in solution vs. Doxil with incubation time. Uptake increased with longer incubation time in sensitive cells but not in resistant cells. Data as mean ± SEM (n = 4). *p < 0.05 doxorubicin vs. Doxil; **p < 0.005 doxorubicin vs. Doxil. (b) Drug uptake in resistant cells with doxorubicin in solution at different concentrations at 4-h incubation time. Uptake of doxorubicin in resistant cells increased only after ~1,000 ng/mL concentration in culture medium.
3.7. Doxorubicin Cytotoxicity in Sensitive vs. Resistant Cells
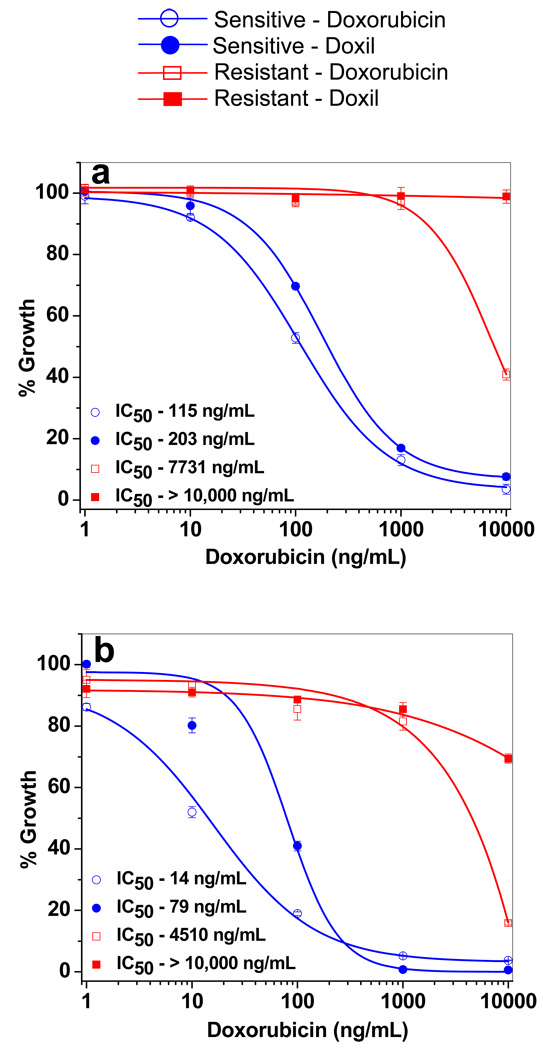
In both sensitive and resistant cells, doxorubicin in solution showed higher antiproliferative activity than Doxil (Figure 10). The antiproliferative effect of the drug increased with incubation time, and this effect was greater in resistant cells than in sensitive cells. The IC50 (concentration of drug that produces 50% cell death) following 3-d and 6-d treatment with doxorubicin in solution was over 65-fold and 320-fold greater, respectively, for resistant cells than for sensitive cells. Similarly, Doxil showed a significantly higher antiproliferative effect in sensitive cells than in resistant cells. In resistant cells, Doxil showed no significant antiproliferative effects at 3 d of treatment but showed a marginal effect following a 6-d treatment (Figure 10).
Figure 10.
Antiproliferative activity of doxorubicin in solution and with Doxil in sensitive and resistant cells following (a) 3-d and (b) 6-d treatment. In 3-d treatment, cells were incubated with different doses of drug, whereas in 6-d treatment, cells were incubated with drug for 3 d and then in drug-free medium for another 3 d prior to MTS assay. Data as mean ± SEM (n = 6). p < 0.005 for IC50 of doxorubicin vs. Doxil in sensitive cells. p < 0.005 for IC50 of doxorubicin or Doxil in sensitive vs. resistant cells.
Discussion
In cancer chemotherapy, the major risk is that the cancer may develop resistance to the drug being used; this arises from multiple factors, including changes in cell membrane characteristics. Although it is known that subtherapeutic dosing of drugs is partly responsible for development of such drug resistance, the factors that influence the difference in drug uptake and efficacy in sensitive vs. resistant cells is still being debated.24 Several mechanisms have been proposed for the significantly reduced drug efficacy in resistant cells: these include genetic25 and cellular/molecular changes,26 as well as alterations in cell membrane and efflux mechanisms that prevent efficient drug transport and retention in resistant cells.27, 28 Our interest in this study was to understand the mechanisms of drug resistance through biophysical characterization of resistant vs. sensitive cell membrane lipids and the interaction of these lipids with drugs. We isolated the proteins from lipid extracts to specifically study the role of membrane lipids in drug interactions.
The results show that the cell membrane lipids of resistant cells have a significantly different composition than those of sensitive cells (Figure 2). Particularly noticeable was the higher concentration of SM, phosphatidylinositol, cholesterol, and cholesterol esters in the resistant cell membrane lipids than in the sensitive cell membrane lipids (Tables 1 and 2). We used Langmuir isotherm data to study the biophysical properties of the resistant and sensitive cell membrane lipids because this isotherm provides information about lipid condensation and compression modulus, which reflects lipid packing density and membrane fluidity of cell membrane, respectively. Our isotherm results show a higher condensation of the resistant cell membrane lipids, as evidenced by the isotherm at a low trough area compared to the isotherm of lipids from sensitive cells (Figure 3a). This finding could be attributed to the presence of cholesterol and SM lipids in the membrane of resistant cells; these are known to increase the acyl chain ordering in lipid monolayers, leading to condensation of the monolayer29, 30 and higher structural order of the lipid phases.31
The compression modulus of the Langmuir monolayer can be related to fluidity, i.e., the degree of motion of hydrocarbon chains in a lipid bilayer membrane of the cell membrane. Our study shows a difference in the compression modulus between the cell membrane lipids of sensitive (13 mN/m) vs. resistant cells (33 mN/m) at SP 30 mN/m (Figure 3b), suggesting that the resistant cell membrane lipids show low fluidity (Figure 3b). Lower fluidity of the resistant cell membrane lipid monolayer can be attributed to higher cholesterol content.
Both sensitive and resistant cell membrane lipids showed a reversible folding collapse, as evidenced by the reversible nature of their isotherms (Figure 3c); however, the morphological studies of their lipid membranes demonstrated significant differences. The membrane lipid morphology was seen to be dependent on the SP of compression (Figure 4a). The shape and size of the spherical structures in the AFM images (Figure 4b) indicate that these structures correspond to the lipid vesicles formed at the interface. The domains formed with the resistant cell membrane lipids were significantly more heterogeneous than those formed with the sensitive cell membrane lipids (Figure 5). The heterogeneous nature of domains formed with the resistant cell membrane lipids could be due to their composition (Table 1), particularly their high cholesterol and SM content, which are known to enhance the segregation resulting in increased formation of condensed domains.32, 33 Furthermore, FFT imaging of the resistant cell membrane lipids also indicates the condensed nature of these lipids in contrast to those of the sensitive cells (Figure 5). The vesicles are formed as the lipid mixture buckles with compression, resulting in protrusions that could extend several micrometers into the subphase (Figure 6). Others have also reported formation of lipid aggregates and have characterized them and investigated the mechanisms leading to their formation.34, 35 These results clearly show a difference in the biophysical characteristics of lipids from sensitive vs. resistant cells.
Two types of interactions have been established for doxorubicin with membrane lipids. One is an electrostatic interaction of the amino sugar of doxorubicin with the ionized phosphate of the acidic phospholipid or negatively charged phospholipids; another is the hydrophobic interaction arising from the intercalation of the drug’s dihydroxyanthraquinone ring with the phospholipid acyl chains.5, 28, 36–38 Both breast cancer cell lines used in this study contain lipids known to interact with doxorubicin, based on the change in SP over time. It seems that doxorubicin’s interactions with the lipids of sensitive cells are ionic; these interactions first lead to a transient increase in SP, but then the drug-lipid complex dissociates from the interface and moves into the bulk phase to cause a slight decrease in SP. In contrast, doxorubicin penetrates into the resistant cell lipid monolayer and is retained within the monolayers, causing SP to increase and remain significantly high above the baseline (Figure 7). These results are consistent with the AFM images of the LB films transferred before and after interaction with doxorubicin. The AMF images showed remarkably less phase separation following interaction of the drug with the resistant cell membrane lipids but not with the sensitive cell membrane lipids (Figure 8). Drug penetration into the lipid monolayer may have reduced the lipid-lipid interaction in resistant cell membrane lipids that is required for formation of large domain structures, such as is seen before the drug interaction. In the case of sensitive cell membrane lipids, although the drug interacts with lipids, it does not inhibit lipid-lipid interactions, and hence does not affect domain formation. This difference in the interactions can be explained on the basis of the lipid composition of resistant vs. sensitive cells. The resistant cell membrane is rich in lipids with saturated hydrophobic acyl chains,39 NL and SM lipids, which could favor greater hydrophobic interaction with doxorubicin.
The changes in the biophysical characteristics of the membrane, such as the lipid packing density and membrane fluidity, are known to influence the membrane’s transport properties.7, 40 The lower drug uptake seen in resistant cells than in sensitive cells (Figure 9) thus could, in part, be related to the relatively higher packing density and lower fluidity of the resistant cell membrane lipids than the sensitive cell membrane lipids. It is interesting to note that the intracellular drug concentration seen following 4 h incubation (40–60 ng/mg cell protein) (Figure 9a) that resulted in antiproliferative activity is the same for both cell lines; however, the extracellular drug concentration required to achieve that threshold initial drug level is significantly higher in resistant cells than in sensitive cells. This is evident from the significant difference in the IC50 of the drug either in solution or Doxil in sensitive cells vs. in resistant cell (Figure 10). Although intracellular drug retention could also be the factor in drug efficacy, these results do suggest the significance of achieving a certain initial therapeutic intracellular doxorubicin level for its effect in both sensitive and resistant cells.
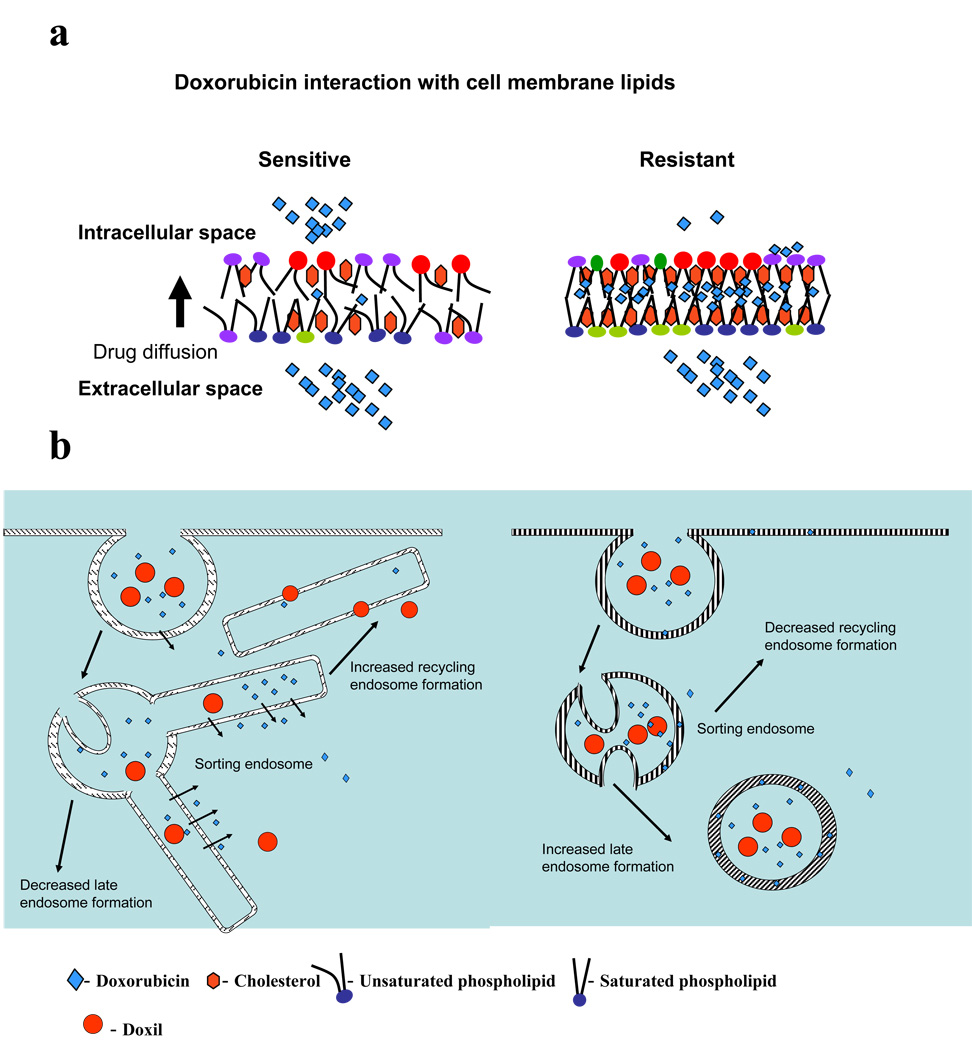
Lipid-drug interaction seen in resistant cells might also reduce the ability of the drug to diffuse across the cell membrane, as the drug is trapped in the bilayer (Figure 11). In addition, the drug present within the bilayer membrane could have easy access to the P-glycoprotein (P-gp) efflux transporter—as has been suggested in a “vacuum cleaner” model that indicates that the transporter expels drug directly from the bilayer—causing reduced drug accumulation inside cells.41
Figure 11.
Mechanism of drug uptake and transport in sensitive and resistant cells (a) Schematic representation of the probable effects of lipid packing density and fluidity of sensitive and resistant cell membrane lipids on drug diffusion across the lipid bilayer. Low lipid packing density and high fluidity arrangement of the lipids of sensitive cells allow the drug to diffuse freely across the bilayer without interaction. In contrast, high lipid packing density and low fluidity of resistant cells and the hydrophobic nature of resistant membrane lipids hinders free drug diffusion and favors drug-lipid interaction, trapping the drug in membrane lipids. (b) Suggested pathways of drug transport in resistant and sensitive cells. Drug or Doxil preferentially follow the pathway of sorting endosomes to recycling endosomes in sensitive cells as against sorting endosomes to late endosomes/lysosomes in resistant cells. This effect could be due to the low membrane fluidity of resistant cells vs. that of sensitive cells and also due the difference in drug interaction with resistant and sensitive cell membrane lipids. Doxorubicin interacts with the membrane lipids of resistant cells but not that of sensitive cells.
The surface of Doxil, which is a stealth liposomal formulation, is covered with the nonionic polymer polyethylene glycol, which minimizes its interactions with its surrounding environment. Since the drug is encapsulated, it is also not available for interaction with lipids. Hence we did not see any change in the SP of the lipid membrane with Doxil (Figure 7). In both sensitive and resistant cells, uptake of the drug with Doxil is probably accomplished via endocytosis as opposed to the diffusion of doxorubicin through the lipid membrane. Doxil showed a relatively higher drug uptake in resistant cells than did doxorubicin in solution; this difference could arise because Doxil, with its liposomal formulation, uses an endocytic pathway of uptake of drug rather than the diffusion method of doxorubicin in solution (Figure 9a). An interesting observation was that up to the 60-min point, drug uptake with Doxil was similar in both sensitive and resistant cells (Figure 9a). However, the uptake continued to increase with longer incubation time in sensitive cells but not in resistant cells. Since drug released from Doxil during the experimental time period is insignificant (5% in 240 min),42 the lower drug uptake with Doxil in resistant cells at 240 min cannot be entirely attributed to the efflux of the released drug following cellular uptake of Doxil, as the difference between the drug levels in sensitive and resistant cells is significantly high at 240 min (Figure 9a). Therefore, reduced drug uptake with Doxil in resistant cells could be due to reduced endocytosis, which is known to occur in resistant cells.43 It is also possible that the drug released from Doxil in the endosomal vesicles could bind to the endosomal membrane lipids, thus disrupting endosomal regulation.
One reason cited for reduced drug activity in resistant cells is that the drug remains trapped in acidic vesicles, which may primarily be caused by protonation of drugs in acidic endosomes; however, this account does not explain why there is lack of such drug entrapment in acidic vesicles in sensitive cells.44 The membrane characteristics of resistant vs. sensitive cells, particularly the rigid nature (low fluidity) of resistant cell membrane, and drug binding to the lipids of resistant cell membrane, could possibly explain the above effect. It is known that membrane characteristics influence the path of sorting endosomes; fluid membranes pinch off from sorting endosome tubules and follow the recycling endosomal pathway, whereas rigid membranes follow the late endosomal/lysosomal pathway.45 It is thus possible that the high membrane rigidity of resistant cells favors the formation of late endosomes in resistant cells rather than recycling endosomes in sensitive cells.46 Hence, the drug bound to the resistant cell membrane lipids is sorted to late endosomes and remains trapped.44
Disruption in the membrane function and/or endocytic process and sorting function may not occur in sensitive cells because doxorubicin does not integrate within the lipids of sensitive cell membrane (Figures 11a), hence it does not influence normal cell membrane functions. Therefore, drug continues to show increased drug diffusion across cell membrane or endocytic uptake of Doxil with longer incubation time in sensitive cells. In addition to transport across the cell membrane, doxorubicin uptake is also reported to occur via the endocytic process.47 Hence, in sensitive cells, the drug or its liposomal formulation, during their transit through cells via sorting and recycling endosomes,45 because of high membrane fluidity, can diffuse out (drug) or escape (Doxil) into cytoplasm (Figure 11b). Membranes of recycling endosomes, after releasing the endosomal content, recycle back to the cell wall, and thus the process of endocytosis continues in sensitive cells. In resistant cells, since the drug or Doxil is transported from sorting endosomes to late endosomes rather than to recycling endosomes, the process of continuous endocytosis does not occur. This mechanism may explain why, with longer incubation time, we see increased drug uptake in sensitive cells but not in resistant cells (Figure 9a). We can thus state that resistant and sensitive cells may process drug and nanocarriers in different ways, based on their membrane fluidity and drug-lipid interactions (Figure 11).
It has been suggested that verapamil, most commonly referred to as an inhibitor of P-gp, may modify lipid membrane and increase membrane fluidity to facilitate drug transport.48 Verapamil is also thought to inhibit drug binding to the membrane, hence its efflux may have been prevented, a process known to occur through the lipid bilayer.41 This example highlights the significance of membrane fluidity and the effects of drug binding to membrane lipids on the drug transport process.
Resistant cells showed increased cellular doxorubicin uptake (Figure 9b) at significantly higher drug concentrations (≥1,000 ng/mL doxorubicin). One possible mechanism for this increased drug uptake at high concentrations could be that the drug-lipid interaction reaches a saturation point, thereby not affecting the drug diffusion across the membrane. It is also possible that there could be changes in the membrane characteristics at higher drug concentrations because of drug binding to membrane lipids.
The antiproliferative effect of Doxil (even at higher concentrations) in resistant cells remained significantly lower than that seen with doxorubicin in solution at similar concentrations (Figure 10). This lessened effect could be due to the reduced uptake of drug with Doxil via the endocytic pathway (Figure 9a), or it could be due to a slower release of the loaded drug in resistant cells, thus not reaching the threshold level of free intracellular doxorubicin necessary for therapeutic efficacy.
It would be interesting to determine how this phenomenon of drug interaction with lipids applies to other drugs, how the lipids isolated from other drug-resistant cells behave and whether biophysical properties of membrane lipids play a dominant role in drug resistance, as resistance is developed not only to the drug exposed to the cells but also to structurally diverse molecules. However, since most anticancer drugs are hydrophobic, their partitioning into the lipid bilayer and inhibition of transport could be a common effect among many types of drugs. It is possible that in some resistant cell lines, other genetic and molecular changes play more significant roles in drug resistance than drug-lipid interactions. If drug-lipid interaction is the dominating factor in drug transport, one may develop a strategy to overcome drug resistance by drug design and/or drug delivery approaches. It is possible that the improved drug efficacy seen with certain block copolymers (such as pluronics49, 50), polymer-drug conjugates51 or nanocarriers52 is mediated by influencing the drug-lipid interactions or membrane fluidity.53 In this regard, biophysical parameters of lipids could prove to be an important tool by which to study drug-lipid interactions and develop effective nanocarrier or polymer conjugate systems that invade the membrane lipid barrier.
Conclusions
Our data show that differences in the lipid composition of resistant and sensitive cells influence their biophysical properties, particularly membrane lipid packing and fluidity. The lipids of resistant cells form more condensed and less fluid monolayers than the lipids of sensitive cells. This difference could be partly responsible for the reduced drug transport seen in resistant cells but not sensitive cells. In addition to the above factor, our data suggest that doxorubicin’s interaction with lipid influences its transport across the membrane. Furthermore, the rigid nature of resistant cell membrane seems to disrupt the increased drug uptake with Doxil. Hence, nanocarriers, which can evade the cell membrane barrier and/or escape rapidly and efficiently from the endosomal compartment, could be effective in enhancing the intracellular drug delivery and overcoming drug resistance. Furthermore, one could design drugs or pro-drugs that can diffuse across the membrane rather than interact and remain trapped in the resistant cell membrane. In this regard, the biophysical interactions studies with cell membrane lipids could be useful in drug discovery as well as to optimize properties of nanocarriers that facilitate intracellular delivery of anticancer therapeutics.
Acknowledgements
This study was funded by grant R01 CA149359-01 (to VL) from the National Cancer Institute of the National Institutes of Health.
Abbreviations
- AFM
Atomic force microscopy
- FFT
Fast Fourier Transformation
- FTIR
Fourier Transform Infrared spectroscopy
- HPTLC
High-performance thin-layer chromatography
- LB
Langmuir-Blodgett films
- NL
Neutral lipids
- PI
Phosphatidylinositol
- RIPA
Radioimmunoprecipitation assay
- SM
Sphingomyelin
- SP
Surface pressure of lipid membrane
- STE
Sodium chloride-Tris-EDTA buffer mixture
References
- 1.Peetla C, Stine A, Labhasetwar V. Biophysical interactions with model lipid membranes: applications in drug discovery and drug delivery. Mol. Pharmaceutics. 2009;6:1264–1276. doi: 10.1021/mp9000662. [DOI] [PMC free article] [PubMed] [Google Scholar]
- 2.Seddon AM, Casey D, Law RV, Gee A, Templer RH, Ces O. Drug interactions with lipid membranes. Chem. Soc. Rev. 2009;38:2509–2519. doi: 10.1039/b813853m. [DOI] [PubMed] [Google Scholar]
- 3.Hendrich AB, Michalak K. Lipids as a target for drugs modulating multidrug resistance of cancer cells. Curr. Drug Targets. 2003;4:23–30. doi: 10.2174/1389450033347172. [DOI] [PubMed] [Google Scholar]
- 4.Pallarés-Trujillo J, López-Soriano FJ, Argilés JM. Lipids: A key role in multidrug resistance? (Review) Int. J. Oncol. 2000;16:783–798. doi: 10.3892/ijo.16.4.783. [DOI] [PubMed] [Google Scholar]
- 5.Pajeva I, Todorov DK, Seydel J. Membrane effects of the antitumor drugs doxorubicin and thaliblastine: comparison to multidrug resistance modulators verapamil and trans-flupentixol. Eur. J. Pharm. Sci. 2004;21:243–250. doi: 10.1016/j.ejps.2003.10.013. [DOI] [PubMed] [Google Scholar]
- 6.Pajeva IK, Wiese M, Cordes HP, Seydel JK. Membrane interactions of some catamphiphilic drugs and relation to their multidrug-resistance-reversing ability. J. Cancer Res. Clin. Oncol. 1996;122:27–40. doi: 10.1007/BF01203070. [DOI] [PMC free article] [PubMed] [Google Scholar]
- 7.Pallarés-Trujillo J, Domènech C, Grau-Oliete MR, Rivera-Fillat MP. Role of cell cholesterol in modulating vincristine uptake and resistance. Int. J. Cancer. 1993;55:667–671. doi: 10.1002/ijc.2910550426. [DOI] [PubMed] [Google Scholar]
- 8.Escribá PV, González-Ros JM, Goñi FM, Kinnunen PK, Vigh L, Sánchez-Magraner L, Fernández AM, Busquets X, Horváth I, Barceló-Coblijn G. Membranes: a meeting point for lipids, proteins and therapies. J. Cell. Mol. Med. 2008;12:829–875. doi: 10.1111/j.1582-4934.2008.00281.x. [DOI] [PMC free article] [PubMed] [Google Scholar]
- 9.Vereb G, Szöllosi J, Matkó J, Nagy P, Farkas T, Vigh L, Mátyus L, Waldmann TA, Damjanovich S. Dynamic, yet structured: the cell membrane three decades after the Singer-Nicolson model. Proc. Natl. Acad. Sci. U. S. A. 2003;100:8053–8058. doi: 10.1073/pnas.1332550100. [DOI] [PMC free article] [PubMed] [Google Scholar]
- 10.Lingwood D, Kaiser HJ, Levental I, Simons K. Lipid rafts as functional heterogeneity in cell membranes. Biochem. Soc. Trans. 2009;37(Pt 5):955–960. doi: 10.1042/BST0370955. [DOI] [PubMed] [Google Scholar]
- 11.Escribá PV, Sánchez-Dominguez JM, Alemany R, Perona JS, Ruiz-Gutiérrez V. Alteration of lipids, G proteins, and PKC in cell membranes of elderly hypertensives. Hypertension. 2003;41:176–182. doi: 10.1161/01.hyp.0000047647.72162.a8. [DOI] [PubMed] [Google Scholar]
- 12.Shah FD, Shukla SN, Shah PM, Patel HR, Patel PS. Significance of alterations in plasma lipid profile levels in breast cancer. Integr. Cancer Ther. 2008;7:33–41. doi: 10.1177/1534735407313883. [DOI] [PubMed] [Google Scholar]
- 13.Patel PS, Shah MH, Jha FP, Raval GN, Rawal RM, Patel MM, Patel JB, Patel DD. Alterations in plasma lipid profile patterns in head and neck cancer and oral precancerous conditions. Indian J. Cancer. 2004;41:25–31. [PubMed] [Google Scholar]
- 14.Lúcio M, Lima JL, Reis S. Drug-membrane interactions: significance for medicinal chemistry. (Review) Curr Med Chem. 2010;17:1795–1809. doi: 10.2174/092986710791111233. [DOI] [PubMed] [Google Scholar]
- 15.Thakur G, Micic M, Leblanc RM. Surface chemistry of Alzheimer's disease: A Langmuir monolayer approach. Colloids Surf. B. Biointerfaces. 2009;74:436–456. doi: 10.1016/j.colsurfb.2009.07.043. [DOI] [PubMed] [Google Scholar]
- 16.Brockman H. Lipid monolayers: why use half a membrane to characterize protein-membrane interactions? Curr. Opin. Struct. Biol. 1999;9:438–443. doi: 10.1016/S0959-440X(99)80061-X. [DOI] [PubMed] [Google Scholar]
- 17.Peetla C, Labhasetwar V. Biophysical characterization of nanoparticle-endothelial model cell membrane interactions. Mol. Pharmaceutics. 2008;5:418–429. doi: 10.1021/mp700140a. [DOI] [PubMed] [Google Scholar]
- 18.Peetla C, Labhasetwar V. Effect of molecular structure of cationic surfactants on biophysical interactions of surfactant-modified nanoparticles with a model membrane and cellular uptake. Langmuir. 2009;25:2369–2377. doi: 10.1021/la803361y. [DOI] [PMC free article] [PubMed] [Google Scholar]
- 19.Peetla C, Rao KS, Labhasetwar V. Relevance of biophysical interactions of nanoparticles with a model membrane in predicting cellular uptake: study with TAT peptide-conjugated nanoparticles. Mol. Pharmaceutics. 2009;6:1311–1320. doi: 10.1021/mp900011h. [DOI] [PMC free article] [PubMed] [Google Scholar]
- 20.Bligh EG, Dyer WJ. A rapid method of total lipid extraction and purification. Can. J. Biochem. Physiol. 1959;37:911–917. doi: 10.1139/o59-099. [DOI] [PubMed] [Google Scholar]
- 21.Handloser D, Widmer V, Reich E. Separation of phospholipids by HPTLC - An investigation of important parameters. J. Liq. Chromatogr. Rel. Technol. 2008;31:1857–1870. [Google Scholar]
- 22.Clausell A, Busquets MA, Pujol M, Alsina A, Cajal Y. Polymyxin B-lipid interactions in Langmuir-Blodgett monolayers of Escherichia coli lipids: A thermodynamic and atomic force microscopy study. Biopolymers. 2004;75:480–490. doi: 10.1002/bip.20165. [DOI] [PubMed] [Google Scholar]
- 23.Davies JT, Rideal EK. Interfacial Phenomena. 2nd ed. New York: Academic Press; 1963. [Google Scholar]
- 24.Gottesman MM. Mechanisms of cancer drug resistance. Annu. Rev. Med. 2002;53:615–627. doi: 10.1146/annurev.med.53.082901.103929. [DOI] [PubMed] [Google Scholar]
- 25.Borst P, Evers R, Kool M, Wijnholds J. A family of drug transporters: the multidrug resistance-associated proteins. J. Natl. Cancer Inst. 2000;92:1295–1302. doi: 10.1093/jnci/92.16.1295. [DOI] [PubMed] [Google Scholar]
- 26.Ambudkar SV, Dey S, Hrycyna CA, Ramachandra M, Pastan I, Gottesman MM. Biochemical, cellular, and pharmacological aspects of the multidrug transporter. Annu. Rev. Pharmacol. Toxicol. 1999;39:361–398. doi: 10.1146/annurev.pharmtox.39.1.361. [DOI] [PubMed] [Google Scholar]
- 27.de Wolf FA, Staffhorst RW, Smits HP, Onwezen MF, de Kruijff B. Role of anionic phospholipids in the interaction of doxorubicin and plasma membrane vesicles: drug binding and structural consequences in bacterial systems. Biochemistry. 1993;32:6688–6695. doi: 10.1021/bi00077a023. [DOI] [PubMed] [Google Scholar]
- 28.Escribá PV, Ferrer-Montiel AV, Ferragut JA, González-Ros JM. Role of membrane lipids in the interaction of daunomycin with plasma membranes from tumor cells: implications in drug-resistance phenomena. Biochemistry. 1990;29:7275–7282. doi: 10.1021/bi00483a017. [DOI] [PubMed] [Google Scholar]
- 29.Hac-Wydro K, Wydro P, Dynarowicz-Łatka P, Paluch M. Cholesterol and phytosterols effect on sphingomyelin/phosphatidylcholine model membranes--thermodynamic analysis of the interactions in ternary monolayers. J. Colloid Interface Sci. 2009;329:265–272. doi: 10.1016/j.jcis.2008.09.057. [DOI] [PubMed] [Google Scholar]
- 30.Stottrup BL, Keller SL. Phase Behavior of lipid monolayers containing DPPC and cholesterol analogs. Biophys. J. 2006;90:3176–3183. doi: 10.1529/biophysj.105.072959. [DOI] [PMC free article] [PubMed] [Google Scholar]
- 31.Halling KK, Ramstedt B, Nyström JH, Slotte JP, Nyholm TK. Cholesterol interactions with fluid-phase phospholipids: effect on the lateral organization of the bilayer. Biophys. J. 2008;95:3861–3871. doi: 10.1529/biophysj.108.133744. [DOI] [PMC free article] [PubMed] [Google Scholar]
- 32.Brown RE. Sphingolipid organization in biomembranes: what physical studies of model membranes reveal. J. Cell Sci. 1998;111(Pt 1):1–9. doi: 10.1242/jcs.111.1.1. [DOI] [PMC free article] [PubMed] [Google Scholar]
- 33.Garcia-Sáez AJ, Chiantia S, Schwille P. Effect of line tension on the lateral organization of lipid membranes. J. Biol. Chem. 2007;282:33537–33544. doi: 10.1074/jbc.M706162200. [DOI] [PubMed] [Google Scholar]
- 34.Baoukina S, Monticelli L, Risselada HJ, Marrink SJ, Tieleman DP. The molecular mechanism of lipid monolayer collapse. Proc. Natl. Acad. Sci. U. S. A. 2008;105:10803–10808. doi: 10.1073/pnas.0711563105. [DOI] [PMC free article] [PubMed] [Google Scholar]
- 35.Lee KY. Collapse mechanisms of Langmuir monolayers. (Review) Annu. Rev. Phys. Chem. 2008;59:771–791. doi: 10.1146/annurev.physchem.58.032806.104619. [DOI] [PubMed] [Google Scholar]
- 36.Mazzoni A, Trave F. Cytoplasmic membrane cholesterol and doxorubicin cytotoxicity in drug-sensitive and multidrug-resistant human ovarian cancer cells. Oncol. Res. 1993;5:75–82. [PubMed] [Google Scholar]
- 37.Awasthi S, Sharma R, Awasthi YC, Belli JA, Frenkel EP. The relationship of doxorubicin binding to membrane lipids with drug resistance. Cancer Lett. 1992;63:109–116. doi: 10.1016/0304-3835(92)90060-9. [DOI] [PubMed] [Google Scholar]
- 38.Goormaghtigh E, Chatelain P, Caspers J, Ruysschaert JM. Evidence of a specific complex between adriamycin and negatively-charged phospholipids. Biochim. Biophys. Acta. 1980;597:1–14. doi: 10.1016/0005-2736(80)90145-5. [DOI] [PubMed] [Google Scholar]
- 39.Ramu A, Glaubiger D, Magrath IT, Joshi A. Plasma membrane lipid structural order in doxorubicin-sensitive and -resistant P388 cells. Cancer Res. 1983;43:5533–5537. [PubMed] [Google Scholar]
- 40.Preetha A, Huilgol N, Banerjee R. Comparison of paclitaxel penetration in normal and cancerous cervical model monolayer membranes. Colloids Surf. B. Biointerfaces. 2006;53:179–186. doi: 10.1016/j.colsurfb.2006.09.005. [DOI] [PubMed] [Google Scholar]
- 41.Lu P, Liu R, Sharom FJ. Drug transport by reconstituted P-glycoprotein in proteoliposomes. Effect of substrates and modulators, and dependence on bilayer phase state. Eur. J. Biochem. 2001;268:1687–1697. [PubMed] [Google Scholar]
- 42.Elbayoumi TA, Torchilin VP. Tumor-specific antibody-mediated targeted delivery of Doxil reduces the manifestation of auricular erythema side effect in mice. Int. J. Pharm. 2008;357:272–279. doi: 10.1016/j.ijpharm.2008.01.041. [DOI] [PMC free article] [PubMed] [Google Scholar]
- 43.Chauhan SS, Liang XJ, Su AW, Pai-Panandiker A, Shen DW, Hanover JA, Gottesman MM. Reduced endocytosis and altered lysosome function in cisplatin-resistant cell lines. Br. J. Cancer. 2003;88:1327–1334. doi: 10.1038/sj.bjc.6600861. [DOI] [PMC free article] [PubMed] [Google Scholar]
- 44.Sognier MA, Zhang Y, Eberle RL, Sweet KM, Altenberg GA, Belli JA. Sequestration of doxorubicin in vesicles in a multidrug-resistant cell line (LZ-100) Biochem. Pharmacol. 1994;48:391–401. doi: 10.1016/0006-2952(94)90112-0. [DOI] [PubMed] [Google Scholar]
- 45.Mukherjee S, Soe TT, Maxfield FR. Endocytic sorting of lipid analogues differing solely in the chemistry of their hydrophobic tails. J. Cell Biol. 1999;144:1271–1284. doi: 10.1083/jcb.144.6.1271. [DOI] [PMC free article] [PubMed] [Google Scholar]
- 46.Larsen AK, Escargueil AE, Skladanowski A. Resistance mechanisms associated with altered intracellular distribution of anticancer agents. Pharmacol. Ther. 2000;85:217–229. doi: 10.1016/s0163-7258(99)00073-x. [DOI] [PubMed] [Google Scholar]
- 47.Takahashi T, Furuchi T, Naganuma A. Endocytic Ark/Prk kinases play a critical role in adriamycin resistance in both yeast and mammalian cells. Cancer Res. 2006;66:11932–11937. doi: 10.1158/0008-5472.CAN-06-3220. [DOI] [PubMed] [Google Scholar]
- 48.GarciaSegura LM, Soto F, PlanellsCases R, Gonzalez-Ros JM, Ferragut JA. Verapamil reverses the ultrastructural alterations in the plasma membrane induced by drug resistance. FEBS Lett. 1992;314:404–408. doi: 10.1016/0014-5793(92)81515-n. [DOI] [PubMed] [Google Scholar]
- 49.Erukova VY, Krylova OO, Antonenko YN, Melik-Nubarov NS. Effect of ethylene oxide and propylene oxide block copolymers on the permeability of bilayer lipid membranes to small solutes including doxorubicin. Biochim. Biophys. Acta. 2000;1468:73–86. doi: 10.1016/s0005-2736(00)00244-3. [DOI] [PubMed] [Google Scholar]
- 50.Kabanov AV, Batrakova EV, Alakhov VY. Pluronic block copolymers for overcoming drug resistance in cancer. Adv. Drug Deliv. Rev. 2002;54:759–779. doi: 10.1016/s0169-409x(02)00047-9. [DOI] [PubMed] [Google Scholar]
- 51.Gurdag S, Khandare J, Stapels S, Matherly LH, Kannan RM. Activity of dendrimer-methotrexate conjugates on methotrexate-sensitive and -resistant cell lines. Bioconjug. Chem. 2006;17:275–283. doi: 10.1021/bc0501855. [DOI] [PubMed] [Google Scholar]
- 52.Kang KW, Chun MK, Kim O, Subedi RK, Ahn SG, Yoon JH, Choi HK. Doxorubicin-loaded solid lipid nanoparticles to overcome multidrug resistance in cancer therapy. Nanomedicine. 2010;6:210–213. doi: 10.1016/j.nano.2009.12.006. [DOI] [PubMed] [Google Scholar]
- 53.Demina T, Grozdova I, Krylova O, Zhirnov A, Istratov V, Frey H, Kautz H, Melik-Nubarov N. Relationship between the structure of amphiphilic copolymers and their ability to disturb lipid bilayers. Biochemistry. 2005;44:4042–4054. doi: 10.1021/bi048373q. [DOI] [PubMed] [Google Scholar]


