Abstract
The recently measured yeast transcriptional network is analyzed in terms of simplified Boolean network models, with the aim of determining feasible rule structures, given the requirement of stable solutions of the generated Boolean networks. We find that, for ensembles of generated models, those with canalyzing Boolean rules are remarkably stable, whereas those with random Boolean rules are only marginally stable. Furthermore, substantial parts of the generated networks are frozen, in the sense that they reach the same state, regardless of initial state. Thus, our ensemble approach suggests that the yeast network shows highly ordered dynamics.
Keywords: genetic networks, dynamical systems
The regulatory network for Saccharomyces cerevisiae was recently measured (1) for 106 of the 141 known transcription factors by determining the bindings of transcription factor proteins to promoter regions on the DNA. Associating the promoter regions with genes yields a network of directed gene–gene interactions. As described in refs. 1 and 2, the significance of measured bindings with regard to inferring putative interactions are quantified in terms of P values. Lee et al. (1) did not infer interactions having P values above a threshold value, Pth = 0.001, for most of their analysis. Small threshold values, Pth, correspond to a small number of inferred interactions with high quality, whereas larger values correspond to more inferred connections, but of lower quality. It was found that for the Pth = 0.001 network, the fan-out from each transcription factor to its regulated targets is substantial, on the average 38 (1). From the underlying data (http://web.wi.mit.edu/young/regulatory_network), one finds that fairly few signals feed into each of them; on the average 1.9. The experiments yield the regulatory network architecture but yield neither the interaction rules at the nodes, nor the dynamics of the system, nor its final states.
With no direct experimental results on the states of the system, there is, of course, no systematic method to pin down the interaction rules, not even within the framework of simplified and coarse-grained genetic network models; e.g., ones where the rules are Boolean. One can nevertheless attempt to investigate to what extent the measured architecture can, based on criteria of stability, select between classes of Boolean models (3).
We generate ensembles of different model networks on the given architecture and analyze their behavior with respect to stability. In a stable system, small initial perturbations should not grow in time. This aspect is investigated by monitoring how the Hamming distances between different initial states evolve in a Derrida plot (4). If small Hamming distances diverge in time, the system is unstable and vice versa. Based on this criterion, we find that synchronously updated random Boolean networks (with a flat rule distribution) are marginally stable on the transcriptional network of yeast.
By using a subset of Boolean rules, nested canalyzing functions (see Methods and Models), the ensemble of networks exhibits remarkable stability. The notion of nested canalyzing functions is introduced to provide a natural way of generating canalyzing rules, which are abundant in biology (5). Furthermore, it turns out that for these networks, there exists a fair amount of forcing structures (3), where nonnegligible parts of the networks are frozen to fixed final states regardless of the initial conditions. Also, we investigate the consequences of rewiring the network while retaining the local properties; the number of inputs and outputs for each node (6).
To accomplish the above, some tools and techniques were developed and used. To include more interactions besides those in the Pth = 0.001 network (1), we investigated how network properties, local and global, change as Pth is increased. We found a transition slightly above Pth = 0.005, indicating the onset of noise in the form of biologically irrelevant inferred connections. In ref. 5, extensive literature studies revealed that, for eukaryotes, the rules seem to be canalyzing. We developed a convenient method to generate a distribution of canalyzing rules, that fit well with the list of rules presented by Harris et al. (5).
Methods and Models
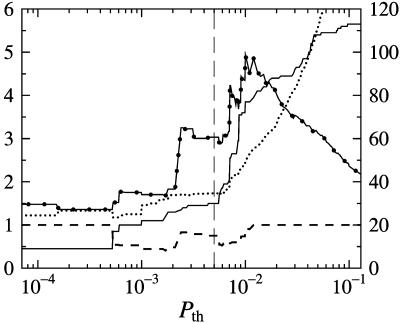
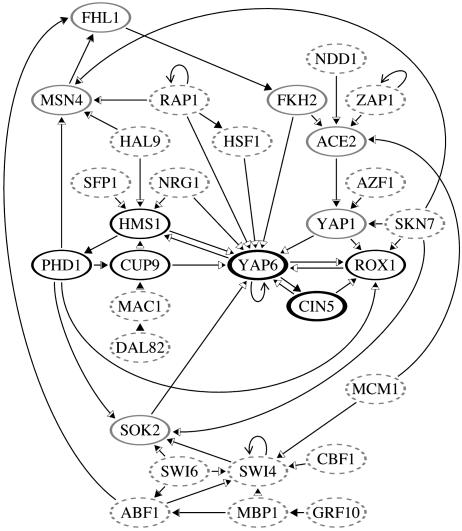
Choosing Network Architecture. Lee et al. (1) calculated P values as measures of confidence in the presence of an interaction. With further elucidation of noise levels, one might increase the threshold for P values from the value 0.001 used in Lee et al. (1). To this end, we computed various network properties, to investigate whether there is any value of Pth for which these properties exhibit a transition that can be interpreted as the onset of noise. In Fig. 1, the number of nodes, mean connectivity, mean pairwise distance (radius), and fraction of node pairs connected are shown. As can be seen, there appears to be a transition slightly above Pth = 0.005. In what follows, we therefore focus on the network defined by Pth = 0.005. Furthermore, we (recursively) remove genes that have no outputs to other genes, because these are not relevant for the network dynamics. The resulting network is shown in Fig. 2.
Fig. 1.
Topological properties of the yeast regulatory network described by Lee et al. (1) for different P value thresholds excluding nodes with no outputs: number of nodes (solid line), mean connectivity (dotted line), mean pairwise distance (radius) (dotted–solid line), and fraction of node pairs that are connected (dashed line). The right y axis corresponds to the number of nodes, whereas the other quantities are indicated on the left y axis. Self-couplings were excluded, but the figure looks similar when they are included. The dashed vertical line marks the threshold, Pth = 0.005.
Fig. 2.
The Pth = 0.005 network excluding nodes with no outputs to other nodes. The filled areas in the arrowheads are proportional to the probability of each coupling to be in a forcing structure when the nested canalyzing rules are used on the network without self-interactions. This probability ranges from approximately one-fourth, for the inputs to YAP6, to one, for the inputs to one-input nodes. Nodes that will reach a frozen state (on or off) in the absence of down-regulating self-interactions, regardless of the choice of rules, are shown as dashes. For the other nodes, the grayscale indicates the probability of being frozen in the absence of self-interactions, ranging from ≈97% (bold black) to >99.9% (light gray).
Generating Rules. Lee et al. (1) determined the architecture of the network but not the specific rules for the interactions. To investigate the dynamics on the measured architecture, we repeatedly assign a random Boolean rule to each node in the network. We use two rule distributions; one null hypothesis and one distribution that agrees with rules compiled from the literature (ref. 5; see also Supporting Text, which is published as supporting information on the PNAS web site). In both cases, we ensure that every rule depends on all of its inputs because the dependence should be consistent with the network architecture.
As a null hypothesis, we use a flat distribution among all Boolean functions that depend on all inputs. For rules with a few inputs, this will create rules that can be expressed with normal Boolean functions in a convenient way. In the case of many inputs, most rules are unstructured and the result of toggling one input value will appear random.
In biological systems, the distribution of rules is likely to be structured. Indeed, all of the rules compiled by Harris et al. (5) are canalyzing (3); a canalyzing Boolean function (3) has at least one input, such that for at least one input value, the output value is fixed. It is not straightforward to generate biologically relevant canalyzing functions. A canalyzing rule implies some structure, but the function of the noncanalyzing inputs (when the canalyzing inputs are clamped to their noncanalyzing values) could be as disordered as the full set of random Boolean rules. However, the canalyzing structure is repeated in a nested fashion for almost all rules in the study by Harris et al. (5). Hence, we introduce the concept of nested canalyzing functions (see Appendix), which can be used to generate distributions of canalyzing rules. Actually, of the 139 rules of Harris et al. (5), only 6 are not nested canalyzing functions (see Tables 1 and 2, which are published as supporting information on the PNAS web site).
A special case of nested canalyzing functions is the recently introduced notion of chain functions (ref. 7; see Appendix). Chain functions are the most abundant form of nested canalyzing functions, although 32 of the 139 rules in the study by Harris et al. (5) fall outside this class.
It turns out that the rule distribution of nested canalyzing functions in the study by Harris et al. (5) can be well described by a model with only one parameter (see Appendix). Hence, we use this model to mimic the compiled rule distribution. The free parameter determines the degree of asymmetry between active and inactive states and its value reflects the fact that most genes are inactive at any given time in a gene regulatory system.
Analyzing the Dynamics. A biological system is subject to a substantial amount of noise, making robustness a necessary feature of any model. We expect a transcriptional network to be stable, in that a random disturbance cannot be allowed to grow uncontrollably. Gene expression levels can be approximated as Boolean, because genes tend to be either active or inactive. This approximation for genetic networks is presumably easier to handle for stability issues than for general dynamical properties. Using synchronous updates is computationally and conceptually convenient, although it may at first sight appear unrealistic. However, in instances of strong stability, the update order should not be very important.
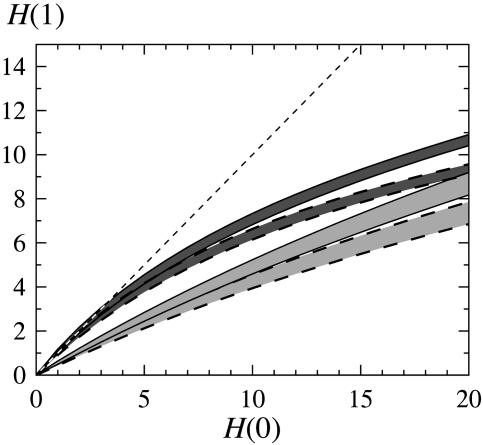
To study the time development of small fluctuations in this discrete model with synchronous updating, we investigate how the Hamming distance between two states evolves with time. In a Derrida plot (4), pairs of initial states are sampled at defined initial distances, H(0), from the entire state space, and their mean Hamming distance, H(t), after a fixed time, t, is plotted against the initial distance, H(0). The slope in the low H region indicates the fate of a small disturbance. If the curve is above/below the line, H(t) = H(0), it reflects instability/stability in the sense that a small disturbance tend to increase/decrease during the next, t, time steps (see Fig. 3).
Fig. 3.
Evolution of different Hamming distances, H(0) with one time step to H(1) [Derrida plots (4)] for random rules (dark gray) and nested canalyzing rules (light gray) with and without self-couplings (dashed borders), respectively. (Down-regulating self-couplings are allowed.) The bands correspond to 1σ variation among the different rule assignments generated on the architecture in Fig. 2. Statistics were gathered from 1,000 starts on each of 1,000 rule assignments.
It is not uncommon that transcription factors control their own expression. In some cases, genes up-regulate themselves, with the effect that their behavior becomes less linear and more switch-like. This action is readily mimicked in a Boolean network. However, in the other case, where a transcription factor down-regulates itself, the system will be stabilized in a model with continuous variables, provided that the time delay of the self-interaction is not too large. Boolean networks can only model the limit of large time delays, which gives rise to nodes that in a nonbiological manner repeatedly flip between no activity and full activity without requiring any external input. Thus, the self-interactions need to be treated as a special case in the Boolean approximation. To this end, we consider three different alternatives: (i) view the self-interactions as internal parts of the rules (all self-interactions are removed); (ii) remove the possibility for self-interactions to be down-regulating; and (iii) no special treatment of self-interactions.
It is natural to use alternative i as a reference point to understand the effect of the self-interactions in alternatives ii and iii.
We want to examine how the geometry of networks influence the dynamics. It is known (3) that the distributions of in- and out-connectivities of the nodes strongly affect the dynamics in Boolean networks, but how important is the overall architecture? If for each node, we preserve the connectivities, but otherwise rewire the network randomly (6), how is the dynamics affected? For a Derrida plot with t = 1, there is no change. If we only take a single time step from a random state, the outputs will not have time to be used as inputs. There will be correlations between nodes, but the measured quantity H(1) is a mean over all nodes, and this is not affected by these correlations. Hence, H(1) is not changed by the rewiring. To obtain a better picture of the dynamics, we need to increase t. However, if we go high enough in t to probe larger structures in the networks, we lose sight of the transient effects of a perturbation.
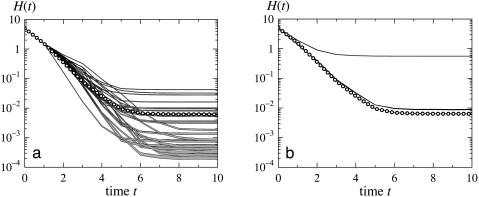
To remedy this situation, we opt to select a fixed initial Hamming distance, H(0), and examine the expectation value of the distance as a function of time, by using the nested canalyzing rules. As noise entering the biological network would act on the current state of the system rather than on an entirely random one, we select one of the states to be a fixed point of the dynamics, and let the probability of any given fixed point be proportional to the size of its attractor basin. A graph of H(t) shows the relaxation behavior of the perturbed system where the self-interactions have been removed (see Fig. 4a). We investigate the role of the self-interactions both in terms of relaxation of a perturbed fixed point (see Fig. 4b) and in terms of probabilities for random trajectories to arrive at distinct fixed points and cycles.
Fig. 4.
The average time evolution of perturbed fixed points for nested canalyzing rules, starting from Hamming distance, H(0) = 5; impact of the network architecture (a) and impact of the self-interactions (b). The lines marked with circles in both figures correspond to the network in Fig. 2 without self-interactions. The gray lines in a show the relaxation for 26 different rewired architectures with no self-interactions, with 1σ errors of the calculated means indicated by the line widths. The black lines in b correspond to the network in Fig. 2 with self-interactions. The upper line shows the case when it is allowed to toggle nodes with self-interactions as a state at H(0) = 5 is picked, whereas the lower line shows the relaxation if this toggling is not allowed. The widths of these lines show the difference between allowing self-interactions to be repressive or not repressive.
The assumption that the typical state of these networks is a fixed point can be motivated. A forcing connection (3) is a pair of connected nodes, such that control over a single input to one node is sufficient to force the output of the other node to one of the Boolean values. With canalyzing rules, this outcome is fulfilled when the canalyzed output of the first node is a canalyzing input to the second. The condition of forcing structures implies stability, because a (forcing) signal traveling through such a structure will block out other inputs and is thereby likely to cause information loss. Abundant forcing structures should tend to favor fixed points.
Results and Discussion
Despite the absence of knowledge about initial and final states, we have been able to get a hint about possible interaction rules within a Boolean network framework for the yeast transcriptional network. Our findings are as follows: (i) Canalyzing Boolean rules confer far more stability than rules drawn from a flat distribution as is clear from the Derrida plots in Fig. 3. Yet, even a flat distribution of Boolean functions yields marginal stability; (ii) The dynamical behavior around fixed points is more stable for the measured network than for the rewired ones, although only in the early time evolution (two to three time steps) of the systems (see Fig. 4a). The behavior at this time scale can be expected to depend largely on small network motifs, whose numbers are systematically changed by the rewiring (6); (iii) The removal of self-couplings increases the stability in these networks. However, the relaxation is only changed significantly if we allow the toggling of self-interacting nodes (see Fig. 4b). This finding means that a node with a switch-like self-interaction is not likely to be toggled by its inputs during the relaxation, nor do the down-regulating self-interactions alter the relaxation. This result means that the overall properties of relaxation to fixed points can be investigated regardless of how the self-interactions should be modeled; (iv) The number of attractors and their length distribution are strongly dependent on how the self-interactions are modeled. The average numbers of distinct fixed points per rule assignments found in 1,000 trials of different trajectories are 1.02, 4.33, and 3.79, respectively, for the three self-interaction models. The numbers of two-cycles are 0.02, 0.09, and 0.38, respectively. Longer cycles are less common; in total they sum up to 0.03, 0.11, and 0.11, respectively; and (v) Forcing structures (3) are prevalent for this architecture with canalyzing rules, as is evident from Fig. 2. On average, 56% of the couplings belong to forcing structures. As a consequence, most nodes will be forced to a fixed state regardless of the initial state of the network. Even the highly connected nodes (in the center of the network) will be forced to a fixed state for a vast majority of the random rule assignments. In most cases, the whole network will be forced to a specific fixed state. At first glance, this might seem nonbiological. However, in the real world, there are more inputs to the system than the measured transcription factors, and to study a process such as the cell cycle, one may need to consider additional components of the system. With more inputs, such a strong stability, of the measured part of the network, may be necessary for robustness of the entire system.
Future reverse engineering projects in transcriptional networks may be based on the restricted pool of nested canalyzing rules, which have been shown to generate very robust networks in this case. It should be pointed out that the notion of nested canalyzing functions is not intrinsically Boolean. For instance, the same concept can be applied to nested sigmoids.
Supplementary Material
Acknowledgments
We thank Stephen Harris for providing details underlying ref. 5. C.T. thanks the Swedish National Research School in Genomics and Bioinformatics for support. This work was initiated at the Kavli Institute for Theoretical Physics (Santa Barbara, CA) (C.P. and S.K.) and was supported in part by National Science Foundation Grant PHY99-07949.
Appendix: Nested Canalyzing Functions
The notion of nested canalyzing functions is a natural extension of canalyzing functions. Consider a K input Boolean rule, R, with inputs i1,..., iK and output o. R is canalyzing on the input im if there are Boolean values, Im and Om, such that im = Im • o = Om. Im is the canalyzing value, and Om is the canalyzed value for the output.
For each canalyzing rule, R, renumber the inputs in a way such that R is canalyzing on i1. Then, there are Boolean values, I1 and O1, such that i1 = I1 • o = O1. To investigate the case i1 = not I1, fix i1 to this value. This defines a new rule R1 with K –1 inputs; i2,..., iK. In most cases, when picking R from compiled data, R1 is also canalyzing. Then, renumber the inputs in order for R1 to be canalyzing on i2. Fixing i2 = not I2 renders a rule R2 with the inputs i3,..., iK. As long as the rules R, R1, R2,... are canalyzing, we can repeat this procedure until we find RK–1, which has only one input, iK, and, hence, is trivially canalyzing. Such a rule R is a nested canalyzing function and can be described by the canalyzing input values, I1,..., IK, together with their respective canalyzed output values, O1,..., OK, and an additional value, Odefault. The output is given by
 |
The notion of chain functions in Gat-Viks and Shamir (7) is equivalent to nested canalyzing functions that can be written on the form I1 = · · · = IK–1 = false.
We want to generate a distribution of rules with K inputs, such that all rules depend on every input. The dependency requirement is fulfilled if and only if Odefault = not OK. Then, it remains to choose values for I1,..., IK and O1,..., OK. These values are independently and randomly chosen with the probabilities
 |
for m = 1,..., K. For all generated distributions, we let α = 7.
The described scheme is sufficient to generate a well defined rule distribution, but each rule has more than one representation in I1,..., IK and O1,..., OK.In Supporting Text, we describe how to obtain a unique representation, which is applied to the rules compiled in Harris et al. (5). This result enables us to present a firm comparison between the generated distribution and the list of rules in Harris et al. (5). (See Fig. 5, which is published as supporting information on the PNAS web site.)
References
- 1.Lee, T. I., Rinaldi, N. J., Robert, F., Odom, D. T., Bar-Joseph, Z., Gerber, G. K., Hannett, N. M., Harbison, C. T., Thompson, C. M., Simon, I., et al. (2002) Science 298, 799–804. [DOI] [PubMed] [Google Scholar]
- 2.Hughes, T. R., Marton, M. J., Jones, A. R., Roberts, C. J., Stoughton, R., Armour, C. D., Bennett, H. A., Coffey, E., Dai, H., He, Y. D., et al. (2000) Cell 102, 109–126. [DOI] [PubMed] [Google Scholar]
- 3.Kauffman, S. A. (1993) Origins of Order: Self-Organization and Selection in Evolution (Oxford Univ. Press, Oxford).
- 4.Derrida, B. & Weisbuch, G. (1986) J. Physique 47, 1297–1303. [Google Scholar]
- 5.Harris, S. E., Sawhill, B. K., Wuensche, A. & Kauffman, S. (2002) Complexity 7, 23–40. [Google Scholar]
- 6.Maslov, S. & Sneppen, K. (2002) Science 296, 910–913. [DOI] [PubMed] [Google Scholar]
- 7.Gat-Viks, I. & Shamir, R. (2003) Bioinformatics 19, Suppl. 1, 1108–1117. [DOI] [PubMed] [Google Scholar]
Associated Data
This section collects any data citations, data availability statements, or supplementary materials included in this article.


