

Summary
Microfluidic technology is creating powerful tools for cell biologists to control the complete cellular microenvironment, leading to new questions and new discoveries. We review here the basic concepts and methodologies in designing microfluidic devices, and their diverse cell biological applications.
Keywords: Microfluidics, Cell biology
Introduction
Microfluidic is a well understood physic domain and can be now used to develop tools for cell biology. By simply miniaturizing macroscopic systems and taking advantage of the possibility of massive parallel processing, some microfluidic chips enable high-throughput biological experiments. Specific effects of laminar flow at the micron-scale also enable spatial control of liquid composition at subcellular resolution, fast media and temperature changes, and single cell handling and analysis. Microfluidic technology enables studies of cell behavior from single- to multi-cellular organism level with precise and localized application of experimental conditions unreachable using macroscopic tools.
In the 80s and 90s, microfluidic devices were mainly fabricated on silicon substrates. These technologies require cleanroom facility and strong know-how. In the late 90s, the introduction of soft-lithography using molding of polymer enables the fabrication of cheap microfluidic devices which have additional advantages due to the physical characteristics of those polymers. The current most popular technology for the fabrication of microfluidic devices for cell biological application is based on the soft-lithography of poly-di-methyl siloxane (PDMS). PDMS is an elastomer which through simple molding procedures can be made into microfluidic devices. Its wide use as a material of choice is due to its mechanical property, which is amenable to integration of fluidic valves, essential elements for major microfluidic applications. Further, PDMS is transparent, bio-compatible, and permeable to gas, which explains the strong interest of the scientific community in using this material to fabricate microfluidic devices for cell biological studies.
The development of soft-lithography gave a simple technology to fabricate devices that integrate channels at the scale of a cell. In most cases, the interest of biologists for microfluidics did not stem from an interest in new physical phenomena at the microscale, but instead from a practical experimental point of view and a favorable scaling of physical forces. At the microscale the laws of physics remain the same as in macroscopic systems, but the scale factor can give predominance to different forces. For example, in the case of fluid flow, the reduction in size reduces the influence of the inertial forces compared to frictional forces, leading to the formation of laminar flow in microfluidic channels. Further, the reduction of size has a direct influence on the characteristic time of the system, such as the time required for the diffusion of a molecule, which decreases as the square of the characteristic length. Microfluidic devices give several advantages for cell biology applications. Some advantages come from the fast response of microsystem. The fast diffusive heat and mass transfer at the microscale (microscale characteristic times are approximately 10−3 s—1 s, compared to macro-scale time of 102 s—104 s) enable fast media and environmental changes and fast temperature-control. Laminar flow properties are also useful since they enable the formation of static and dynamic gradients at subcellular resolution. Microfluidics also have a number of other positive practical aspects like low reagent consumption (nL), the opportunity to manipulate large number of cells simultaneously and independently, automatic generation of a large number of different individual conditions, and easy integration of numerous analytical standard operation and large-scale integration. From a technological point of view, soft-lithography enables the integration of subcellular scale physical and chemical patterns to study cell behavior under a large spectrum of parameters. In addition, electrode integration inside the microfluidics device can generate large localized electric fields using small voltages. Finally, the versatility of these devices partly enables the simulation of in vivo cellular microenvironment (vascularization, 3D, nutrient stress, etc…).
Microfluidics have some drawbacks. For example, laminar flows only produce relatively slow diffusive mixing, which can be a major limitation for some applications requiring fast homogenization of flow. This can be corrected using different types of integrated mixers [1], such as advective mixing in a microchannel [2]. In addition, the small reagent consumption theoretically reachable in microfluidic devices is generally not reached due to a current lack of methods for fluid handling. Changes in scaling can further give difficulties in adaptation of biological protocols to fit experiments in microsystem (i.e., media and cell concentrations). Further, PDMS has affinity for small hydrophobic molecules and thus could lead to biomolecule absorption/adsorption from the medium, thus biasing the experimental condition. The permeability of PDMS to water vapor can also lead to media drying and thus change its osmolarity. These differences require careful comparison between data obtained in macroscopic experiments and data obtained in microsystems.
In this review we will discuss on the use of microfluidics to fabricate research tools in cell biology with a particular focus on PDMS soft-lithography. We will first describe technologies used to fabricate PDMS microfluidic devices. Then, we will describe the existing microfluidic tools in different category: environmental composition control, mechanical deformation, force measurement, temperature control, and integration of electric fields. Finally, we will describe the main applications of these tools in cell biology and discuss the choices of PDMS for these applications.
Soft-lithography and microfluidics
PDMS casting and microcontact printing
We describe here the two major techniques, often referred to as soft-lithography of PDMS, for fabricating microfluidic devices dedicated to cell biological research and for printing molecular micropatterns on cell culture substrates: PDMS casting and microcontact printing.
Fig. 1 illustrates a typical procedure for making a microfluidic device. PDMS microfluidic devices are generally fabricated using molding methods [3,4]. A silicon master mold, containing photoresist pattern representing the channel design, is fabricated using photolithography. Once the master mold is fabricated, if carefully used and properly treated with an adhesive, it can be use hundreds of times to mold PDMS replica of the channels. Photolithography process for mold fabrication, which will not be detail here, requires a spincoater and a dedicated UV lamp. For most of the biological applications described in this review, including pattern feature as small as 1-micron, the photolithography equipments can be installed in a classical biological fumehood instead of a cleanroom, thus reducing significant cost.
Figure 1.
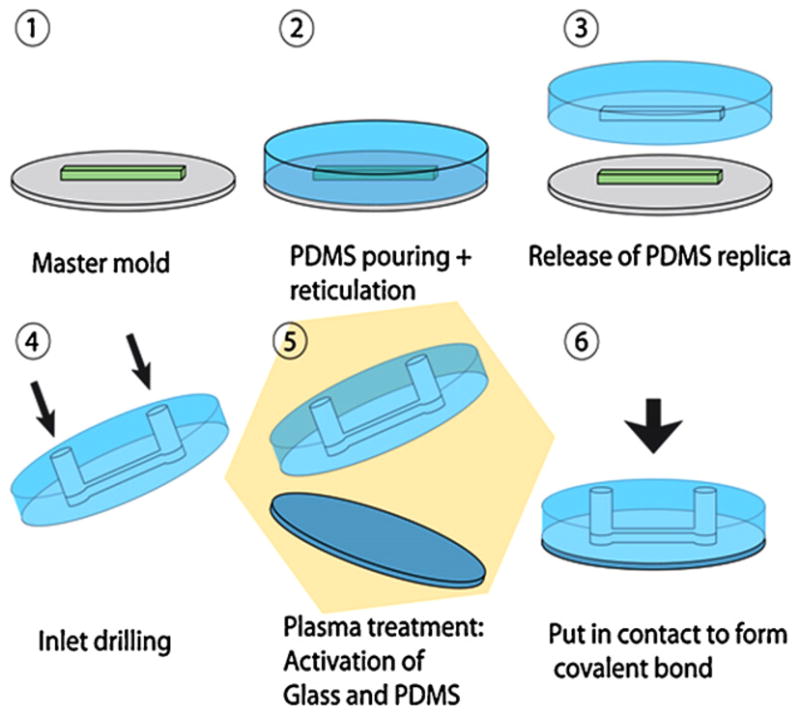
Fabrication procedure for a single layer microfluidic device. See text for details.
To fabricate a monolayer PDMS microfluidic device, liquid PDMS and curing agent are mixed and poured onto the master mold and cured at 60 °C for 2 h. Then the mold and PDMS replica are disassembled, cut to the desired dimension before drilling of injection holes using generally a syringe needle. The PDMS microfluidic device and glass cover slip are plasma treated for 30 s, and put into contact to produce a covalently bonded and sealed full microfluidic chip.
Since one PDMS layer can be bonded onto another using a similar plasma treatment, this technology enables the fabrication of multilayer microfluidic devices. The possibility to fabricate multilayer devices, coupled to the low Young’s modulus of PDMS, enable the integration of microvalves [5]. The integration of elements like valves gives active control of the liquid inside the chip, leading to fully automated microsystems.
Applications requiring integration of electrodes or resistors require the deposition of metal and dielectric layers inside the device. Integration of electrodes on a substrate is a common operation in microtechnology but requires clean-room facilities. Furthermore, due to the low surface energy and high softness of PDMS, metal deposition is difficult to achieve on PDMS surfaces. Nevertheless, since glass substrate is compatible with most of cleanroom techniques developed for silicon-based microelectronic industry, it is possible to coat metallic and dielectric layers directly on the glass substrate prior to plasma-bonding onto the PDMS device.
Microenvironmental control
The microenvironment of the cell is defined by chemical and mechanical parameters. Chemical environment is composed of soluble molecules around the cell which is related to the cell culture medium composition, and mechanical environment is composed of the extracellular matrix (ECM) which is related to the culture substrate composition. In conventional cell cultures, these environmental parameters are easily controlled for a population of cells, but cannot be addressed locally to individual cells. One of the major interests of microfluidics is environmental control at the scale of the cell. In addition to the ability to locally address parameters of the cell microenvironment, microfluidics also offers the ability of change these parameters dynamically and automatically due to the speed of the physical processes at the microscale and the different automation possibilities. Although an ideal comprehensive microenvironmental control device does not exist, individual environmental parameter can readily be controlled using soft-lithography and can in some cases be combined. We review in this part the different existing methods to control the chemical and the mechanical microenvironment of the cell.
Chemical microenvironment
One of the first applications of microfluidics in cell biology was to control the cell medium. There is a strong interest in producing chemical gradients to mimic natural stimuli which occur in biological processes such as cell migration, differentiation, or development. The study of cellular response to chemical gradients requires fine spatial control of local concentration because cells can response to concentration gradients localized to a region as small as 2% of their diameter [6]. The poor spatiotemporal resolution of macroscopic gradient generators (MGGs) led to an interest in fabricating microscale gradient generators (μGGs). Microfluidic devices can create multiple biochemical gradients with controlled spatiotemporal distribution and subcellular resolution. These microfluidic devices offer fast response time to study fast responsive system such as immune cells. μGGs have been successfully used to study neural stem cell grow and differentiation [7], neutrophil chemotaxis [8—10] or migration [11], bacteria chemotaxis [12], endothelial cell migration [13], cancer cell chemotaxis [14], cellular response to virus [15], and yeast gene expression under gradients of pheromone [16]. For more information, we refer the reader to the excellent review of Keenan and Folch [17].
Macroscopic methods to create concentration gradients are generally imprecise and unstable
MGGs have been traditionally developed using hydrogel made from fibrin, collagen or agars. Gradients are deposited on the hydrogel using an array of droplets containing biomolecules which then diffuse in the gel to form a gradient [18,19]. A second method uses micropipette to inject biomolecules into the gel at controlled rate to generate a gradient [19]. In general, hydrogel enables easy gradient production, but have poor reproducibility and spatiotemporal control over the gradient. In addition, the opaque optical properties of the gel can be a limitation for some applications. Other MGGs have been developed using chambers separated by membranes [20—22]. These methods cannot generate complex and stable gradients. An exception is the Dunn chamber [22] using modified micropipette technique, which were able to generate stable gradients for several hours. Although these MGGs have helped address numerous questions, they are not useful for studies requiring gradients with precise spatiotemporal control and reproducibility.
Microfluidics allow for precise spatiotemporal concentration gradients
Microfluidics enable the creation of a large spectrum of gradients: time invariant gradients, subcellular resolution gradients, continuous or discrete gradients, fast response dynamic gradients. Most of the μGGs described here use simple technologies (i.e., single layer PDMS), and have been applied to generate concentration gradient of diffusible molecules to study bacterial chemotaxis [12], and cell migration in response to chemokines [13], and to generate surface gradient of adsorbed ECM molecules to study the dependence of axon growth of neurons on the surrounding ECM composition [23].
Fig. 2 gives examples of gradient generation. One simple way to generate gradients in microfluidic systems is to use the properties of laminar flows. Laminar flow-based μGGs use diffusive mixing between two or more parallel laminar streams of different composition to generate molecular gradients. The shape of the gradient based on laminar flows depends on the flow rate and the time the streams are in contact. Gradients generated in these types of devices will maintain their shape at constant flow rate. The simplest μGGs of this type is the T-sensor [24], which is composed of two microchannels. These gradient generators have a small time constant and are theoretically able to establish or modify a gradient in 10−2 s—10 s. T-sensor devices are easy to fabricate and to describe mathematically. The constant perfusion permanently exchanges the medium and prevents accumulation of cell waste products, thus enabling long cell culturing time. In contrast, T-sensor devices are reagent-consuming. They remove the autocrine/paracrine or other secreted signals of cultured cells, and subject cells to shear stresses due to flow. Further, the useful region is limited to a short portion of the channel which generates only sigmoidal-shaped gradients in the direction perpendicular to the flow. To overcome this limitation, additional inlets can be added to generate more complex flow profiles. Yet, the addition of needed controls can rapidly make these experiments tedious. T-sensor devices have been used in studies of bacterial chemotaxis [12], or endothelial cell migration [13].
Figure 2.
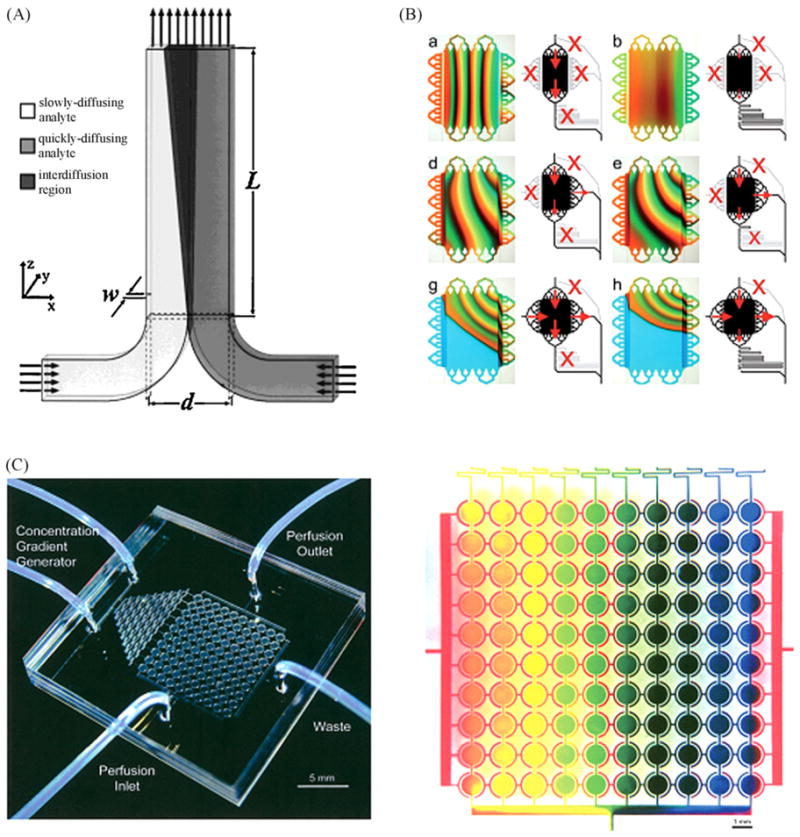
Microfluidic gradient generator. (A) Schematic representation of a T-sensor with two inputs. One can see the diffusion between the two laminar streams along the device [24]. (B) μGG composed of an array of 16 multiplexed inlets which allow 64 combinations of gradient generation. This figure shows gradient shape modification in the central chamber depending of valve state [28]. (C) A microfluidic cell culture array containing 100 cell culture chambers with integrated gradient generators [162]. (D) Zoom on the cell culture array with gradient generation demonstrated using red, blue and yellow dye [162].
An upgraded version of the T-sensor called premixer μGG [25] splits and recombines inlet fluids before merging them in the culture channel, and thus can generate more complex gradients (e.g., sawtooth and hill). By adjusting the inlet flows, premixer μGGs can generate smooth or step gradients. Dertinger et al. introduced the multiple premixer arrays which can generate overlapping gradients [26]. This type of devices have been used in studies of neutrophil chemotaxis [8,9], neural stem cell differentiation [7], and breast cancer cell chemotaxis [14]. Except for the wider range of gradient shapes, the premixer device shares the same inconveniences of the T-sensor.
Another upgraded version of the T-sensor called universal μGG [27] includes a series of walls to split the streams. This configuration can generate many profiles of concentrations, and can reduce dead volume compared to the T-shaped μGG, but also shares the same inconveniences as the T-sensor and is more challenging to describe mathematically. Cooksey et al. developed a μGG composed of an array of 16 multiplexed inlets, which give 64 combinations of chamber feeding [28]. This device integrates a mixer which can be turned on-off with a bypass valve, and can produce gradients or homogenized mixtures. This device enables simultaneous formation of complex gradients of different biomolecules, with sub-second temporal resolution.
Major drawbacks of all laminar flow μGGs are that they require precise control of the flow rate. The shear produce by the flow can change the migratory behavior of the cells [29], and produce undesired mechanical stress on the cell, and flush away important factors secreted by cells [17]. While possible, these μGGs are challenging for studies of nonadherent cells such as yeast or bacteria because of movements generate by the flow [30].
The second type of μGGs is not based on the properties of laminar flow. The flow resistive μGG uses flow resistive elements to eliminate convection around the cells. This kind of device allows passive diffusion of biomolecules through a flow barrier to generate gradients. The flow barrier can be a hydrogel [31—33], nanopore membrane [10], or microchannel [32]. Hydrogel completely eliminates convection, whereas microchannels (which are easier to integrate) only minimize convection. In both cases, these devices can generate steady-state gradients, eliminate shear stress generated by flow, and preserve the autocrine/paracrine signals secreted by cells. In addition, they use less reagents than laminar flow μGGs, are possible for experiments with non-adherent cells like yeast [16], and some are able to generate gradients in hydrogel for 3D cell culture. Major drawbacks of these μGGs are their inability to create complex profiles, their large time constant compared to laminar flow μGGs, and, for the hydrogel-based μGGs, more difficult to fabricate than single PDMS layer-based laminar μGGs.
A miniaturization of the micropipette technique used in MGGs, called microfluidic multi-injector (MMI), can generate overlapping gradients using integrated valves for flow injection. This method gives better reproducibility and quantification of gradients than its macroscopic analogue, but is quite slow compared to other μGGs since it requires ~10 min to achieve a steady-state gradient.
In general, μGGs are able to generate gradients with much better spatiotemporal resolution than MGGs. The choice of the types of μGGs depends on the constrains of the biological experiment. Flow μGGs are the best candidate for experiments requiring fast response and/or complex gradient shapes. On the other hand, hydrogel-or microchannel-based flow resistive μGGs are best suited for experiments where shear stress, cell drift, and/or the unwanted flushing of secreted cellular factors are of concern.
Laminar flows can address subcellular resolution and fast switching
Microfluidics, due to the small time constant and diffusion mixing, can be used to dynamically focus a drug stream on a given part of a cell. This ability allows dynamic observation of cell behavior immediately after drug treatment, or to study how local chemical stimuli propagate in the cell [34,35].
Fig. 3 gives examples of possibilities offer by laminar flow for cell treatments. Similar to μGGs, partial treatment of cells using laminar flows method (PARTCELL) can expose part of an adherent cell situated at the edge of two or more laminar streams of membrane permeable molecules [35,36], where the width of the laminar mixing region can be between 1 and 10 μm. This method is limited by molecular diffusion since small molecules can diffuse ~100 μm in less than 1 min, and thus can diffuse throughout the whole cell during PARTCELL treatment. This effect smooths the molecular distribution and create molecular gradient inside the cell instead of a straight molecular concentration step. Wheeler et al. showed that by controlling the inlet flow rate, displacement of the laminar mixing region can be achieved, and thus media switching can occur in less than 100 ms around a cell [37], which is 10 times faster than standard perfusion chambers. Hersen et al. have used these kinds of chemical oscillating signals to extract kinetic information on the HOG MAP kinase pathway [38].
Figure 3.
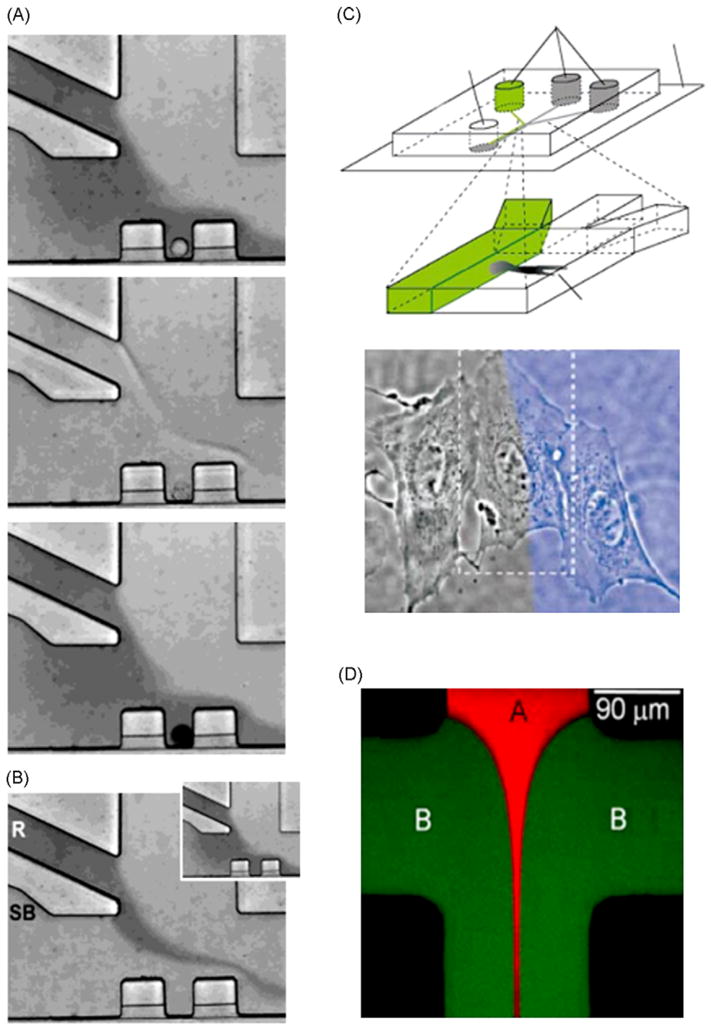
Spatiotemporal drug control. (A) Picture from 2 min movie showing successive perfusion with Trypan blue dye on live cell, and subsequent methanol and Trypan after cell death. (B) Picture showing the ability to change the stream in contact with a cell by changing inlet flow rate. This type of medium switching can be done in 130 ms [37]. (C) Schematic of PARTCELL principle [36]. Using laminar flow properties one is able to partially treat a cell. Picture shows treatment of a portion of a single cell with Latrunculin A and blue dye. (D) Picture showing hydrodynamic focusing. Flows B (green) arriving from both sides of flow A (red) focused and maintained flow in a fine stream configuration [40].
A second method to expose part of a cell, called “hydrodynamic focusing”, uses flows from two sides to squeeze a central flow to widths as small as 50 nm [39,40]. The position of the hydrodynamic focusing can be changed by simply adjusting the inlet flows; and stable focusing position and width are maintained by constant flow rate [41]. This method has low reagent consumption and good spatiotemporal resolution, but requires precise fluid handling system and is also limited by molecular diffusion on the cell cytoplasm.
Starting from T-sensors, more complex devices have been designed to automate condition variations. For example, King et al. designed a method called “flow encoded switching” [42], to simultaneously deliver different temporal profiles of chemical stimuli, such as pulsed train of different widths or frequencies. Sabounchi et al. subjected Hela cells to biochemical reagents in a pulsatile manner, using external solenoid valves [43]. They were able to apply and remove a reagent from the cells in 100 ms.
In addition, the high permeability of PDMS to gas enables control of gas composition in cell cultures. By flowing gas of controlled composition in microchannels adjacent to the cell culture, it is possible to locally control the gas composition of the medium [44,45]. This kind of device enables fast gas composition switching or gas gradient generation.
The devices presented above are adapted for fast changes in cellular microenvironment. However, in most of cases, speed may be of less importance than control flexibility, cell seeding practicality, low shear stress, long-term culture possibilities, and large-scale integration.
Substrate patterning
Substrate modification is required for adherent cells. In most devices described above, cells adhere on glass surfaces via incubation of the microchannels with ionic polypeptides like polylysine or proteins like fibronectin. In cases where cells have to adhere to PDMS surfaces, plasma curing promotes adhesion, but it is not stable over time [46]. To overcome this limitation, it is generally necessary to covalently bind the adherent molecules to the PDMS surface. We will describe techniques to control the chemical nature of the cell substrate.
In standard cultures of adherent cells, cells are randomly seeded on the surface of the culture substrate. This random organization, which is not representative of living tissues, does not interfere with the results of most of biological experiments. However, recent advances in cell biology highlight the needs to control patterns of cell adhesion to ask questions concerning tissue morphogenesis and cell communication. This leads to the development of three major modes of spatial controls of cell adhesive substrates: (1) mimicking signaling tracks which are naturally present in vivo on the ECM. For example, gradients of surface properties are used to study the chemotaxis behaviors of motile cells [47] or neuronal path findings [23]. (2) Forcing cells to follow a given adhesion pattern in order to study interplay between the geometrical constrains and cell behavior such as changes in cell polarity [48,49]. (3) Constraining the cell in a given location and shape to facilitate its analysis to produce “mean” cell maps of the position of cellular organelles [49,50].
We discuss next the existing methods to create patterned substrates of various chemical compositions to constrain cells, or to vary other physical properties of the substrate such as patterning of the substrate by molding [51] to study durotaxis behaviors [52].
Photolithography is efficient but not versatile
The oldest method to pattern biomolecules is photolithography using UV light to expose a mask containing the desired patterns onto photosensitive resists. It is then possible to transfer onto the resist patterns of biomolecules of interest by etching or lift-off. This method has been successfully applied to produce adhesion patterns for cell culture [53]. Nevertheless, it requires cleanroom facilities which are generally not easily accessible for biologists, and the chemicals used in the process may be harmful for some biomolecules. To avoid this last drawback, a water soluble sacrificial layer like agar of PVA can be inserted for protection [54].
An alternative to photoresist is the use of UV to directly degrade molecules [46]. By using deep UV to degrade a repellant molecule like PLL-PEG, it is then possible to reactivate the surface for adsorption of the biomolecules of interest afterward [55]. This method, which works on glass and PDMS substrates, is particularly robust and easy to process. Interestingly, variant of this method can also produce gradients of the surface concentration of certain molecules [56].
Photolithographic methods are probably the best methods in term of pattern quality and patterns with high resolution (down to 1 μm). However, these methods have to be modified for each new substrate, and are thus not versatile.
Microcontact printing is the simplest method
Fig. 4 gives examples of microcontact printing methods and applications. Microcontact printing (μCP) is a method which enables printing is patterns of molecules on a substrate using a microstructured stamp (generally fabricated in PDMS by molding). The stamp is coated with the molecule of interest by dipping it in solution which can contain a multitude of elements such as thiols, proteins, silanes or nanoparticles. Once the molecule of interest is adsorbed on the stamp, the stamp is temporary put in contact with the substrate to allow transfer. After printing on a surface, the nonprinted adjacent surface can be made passive with another molecule to prevent cell spreading beyond the printed areas. The PDMS stamp can be used ~100 times over a period of several months without noticeable degradation of the quality of the printing [57]. When using classical PDMS, this technique can achieve resolution below 500 nm [58]. μCP have been used extensively for substrate patterning of biomolecules for experiments such as axon guidance [59,60], or cell culture on defined geometry [46]. μCP was initially used to print self-assembled monolayer of alkanthiolate on gold surface to perform hydrophobic patterning. This very efficient technique was soon extended to patterning of peptides, proteins, and a wide range of biomolecules on different substrates. Nevertheless, all molecules cannot be stamped using μCP since the “ink” has to be dried on the PDMS stamp to be patterned. To avoid drying, agar stamps can be used [61], and has been shown to achieve 50 μm resolution.
Figure 4.

Substrate patterning using microcontact printing (μCP). (A) Schematic of μCP procedure [58]. (B) Bicolor μCP using successive stamping of molecules [58]. (C) Multicolor μCP using stamp pre-inked with molecular gradient [62]. (D) Influence of adhesive micropattern on cell cytoskeleton. This figure show vinculin and actin repartition for different fibronectin patterns [50].
If the printing of several different molecules is needed, it is possible to perform sequential functionalization of the substrate by using different stamps with different molecules. This method is easy to perform but requires an aligner to control the position of the successive printing. An alternative method load the stamp with different molecules simultaneously [58], but this method does not generally give precise spatial protein concentration. Crozatier et al. developed a method based on microaspiration to load multiple samples onto a stamp prior to transfer to substrate [62]. In contrast to single μCP methods, multi-molecules μCP requires strong technical know-how.
μCP also enables direct patterning of gradients onto a substrate. Stamps composed of arrays of high-resolution patterns with controlled spacing and density can generate gradients of biomolecules [59]. An original technique involving μCP directly patterned bacteria at cellular resolution on a substrate using structured PDMS stamp with bacteria as the ink [63].
In general, μCP enables high-resolution patterning with a large range of patterns. μCP can pattern planar or non-planar substrates and have been used on substrates such as glass, silicon, and polystyrene. μCP patterning is limited to molecules that are not altered when adsorbed on a substrate, and typically is limited to patterns containing only one or two types of molecules. During an experiment, the adsorbed biomolecules may also degrade or be replaced by other molecules in the medium.
Stencil patterning helps to pattern fragile components
An alternative method called “stencil patterning” enables patterning of any component without altering it. This method requires covering the substrate with a membrane (typically PDMS) containing microholes (the stencil). Deposition of molecules is applied to all surfaces, but only the microholes are exposed. Subsequent removal of the membrane stencil produces treated surfaces at the position of the microholes. This method is often used to locally apply a harmful treatment on a delicate surface [64], or to directly pattern cells onto a homogeneous substrate [65]. Stencil patterning is a convenient method but manipulation and fabrication of micromembrane remain tricky.
Patterning using liquid flow in channel can achieve complex functionalization
Fig. 5 gives examples of substrate patterning by flow and active elements. Liquid flow can also achieve patterned substrates. Patterns can be formed by restricting the flow area using microchannels directly on the substrate, or on an intermediary stencil. This method enables simultaneous deposition of a large number of ligands by circulating different streams in parallel or in a gradient [66]. Liquid flow enables successive treatments on the patterned area, but often the shape and resolution of this method are limited.
Figure 5.

Substrate patterning using flow or active elements. (A) Structured valve based microfluidic device for substrate patterning. A1—A2: schematics showing cross-sectional view of the device and deformation of structured membrane when applying a pressure on the top channel. Flow of passive agent recovers only the area unprotected by membrane structure, allowing future adhesion of ECM protein. A3: picture shows a scanning electron micrograph of the membrane structure. A4: fluorescence picture of actin stained endothelial cell following ECM matrix protein shape [71]. (B) Direct cell patterning using reversible device with two interconnected channel layers. Up: schematic representation of the method used to pattern different cell types on the same substrate. Down: fluorescence picture of two cell types deposited on a tissue culture dish in a concentric pattern using this device [72]. (C) Dynamic cell patterning. Picture showing BCE cells attached to a surface patterned with specific thiols. Application of a cathode voltage pulse allowed release of the cells from the micropattern (time in minutes) [79].
To pattern the substrate by liquid flow, one method consists of sticking a microfluidic channel on the substrate and flowing in a solution containing biomolecules. The microfluidic device can be permanently stuck if the biological experiment is performed in the same device [66], or temporarily stuck by simply putting down the device on the substrate [67], or by using vacuum aspiration [68]. Using this method, Delamarche et al. showed that it was possible to pattern biomolecules on various substrates like glass, gold or polystyrene with submicron resolution [67], and Folch et al. created protein templates of collagen and fibronectin allowing cells to adhere on selective surfaces [69].
By flowing different solutions of biomolecules on different channels in parallel, it is possible to create pattern of multiple compositions or to pattern molecular gradients on a substrate using a μGG [23,66]. A simpler but less versatile method is to use the depletion effect of the solution while it flows along the channel to generate a gradient [70].
Using PDMS multilayer devices, it is also possible to indirectly pattern cells at desired location on a substrate [71]. This device uses integrated structured valves to first restrict flows of blocking agents onto surfaces uncovered by the structured valves (Fig. 5). After releasing of the valves, flows containing ECM will adsorb ECM to the unblocked surfaces. This device produces adhesive islands on a microchannel for cell culture.
These described flow patterning techniques generally only pattern continuous shapes if no stencils are used. To overcome this limitation, Chiu et al. proposed a 3D microfluidic device to pattern discontinuous patterns [72]. This device has been used for classical chemical patterning and also for direct patterning of different mammalian cells on the same substrate. The major drawback of this device is the complexity of the fabrication process compared to the other flow patterning techniques.
Inkjet printing and microdroplet dispenser
To micropattern a substrate with chemicals and without contacting it, it is possible to use an inkjet printer or a microdroplet dispenser which can deposit a large number different molecules onto the substrate [73]. This technique is also applicable to directly pattern the cells themselves [74]. Nevertheless, the resolution is limited to several tens of micrometer and the shape of small patterns is generally limited to a disk.
Active molecules allow dynamic substrate patterning
Methods for reversible substrate patterning have been developed to expose cells to a dynamically reversible surface chemistry. In traditional studies, a highly invasive method uses scraping away of cell monolayer to investigate cellular response to the newly exposed ECM [75]. Now, for these kinds of studies, the thermo-responsive polymer PNIPAAm, which changes from hydrophobic to hydrophilic with temperature can be used [76]. Coupled with collagen this polymer enables control of cell attachment and detachment from the substrate. This polymer can be patterned on substrates using photolithography [77], and can also be coupled with grow factor and insulin to stimulate cell grow. Other promising method involves photosensitive molecules which enable easy switching of cell adhesion directly through the microscope. Nevertheless, sensitivity of photosensitive materials needs to be improved [78]. Electroactive polymers such as self-assembled monolayer (SAM), which can be switched by electrodes, can also be used to control the adhesion state of cells on surfaces [79,80].
Topological patterning can also play its role
Fig. 6 gives examples of topological patterning. In addition to substrate chemistry, substrate topology can also be patterned. The simplest method to integrate structures in PDMS devices consists in sticking a PDMS channel onto another PDMS layer structured with the desired pattern [81], or to directly mold a PDMS replica from a 3D mold containing both the channel and the structure [2]. These kinds of devices can be used to perform force measurement [82], or integrate microwells arrays which enable individual cell culture with easy cell docking by gravity sedimentation [81] or capillary force [83]. The capillary cell deposition technique is faster and more reproducible than sedimentation but expose cells to air for several seconds which could be a major drawback for cell viability.
Figure 6.
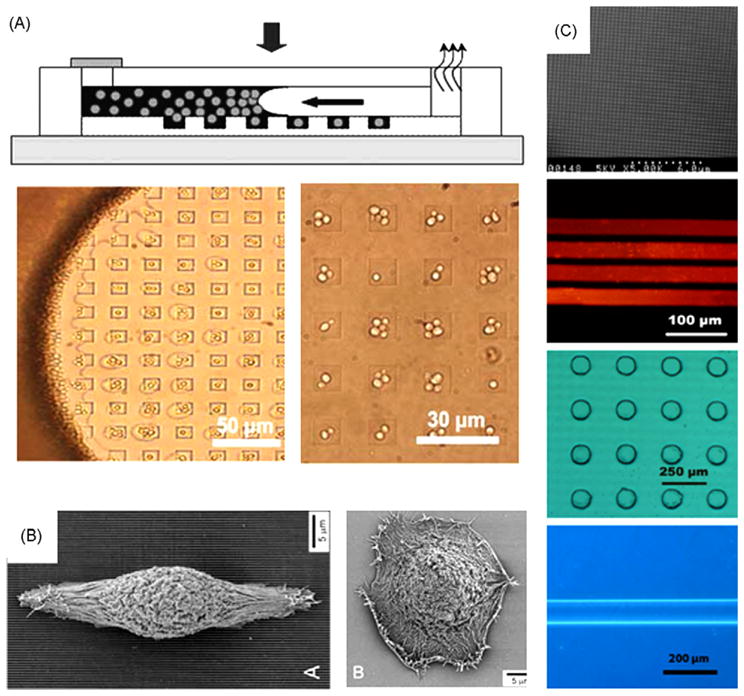
Substrate physical patterning. (A) Top: schematic of cell docking in microwells using capillary force. Down: picture of SG3 yeast docking in microwells [83]. (B) Cell guidance using physically modified substrate. Left: picture of corneal epithelial cells on SiO2 substrate with 70 nm wide ridges. Right: cell on a smooth SiO2 substrate [91]. (C) Example of pattern made by micromolding technique. From top to bottom: 150 nm diameter pillar, fluorescent image of 40 μm stripe of quantum dot, 100 μm hole in a 20 μm thick PDMS layer, optical image of 100 μm width and 20 μm height wall of agar gel [84].
It is also possible to structure the glass substrate before bonding to PDMS channels [83]. Traditional approaches to pattern glass used etching procedures but those techniques require strong know-how and facilities not easily accessible to small microfluidic labs. An alternative method to structure the glass substrate is micromolding in capillary (MIMIC), which enables fabrication of 3D structures on the substrate by injecting the material to be molded (sol—gel, salt, polymer bead, colloid, etc…) into a PDMS channel temporary in contact with the substrate [51]. This method sometimes gives rise to problems of insufficient air evacuation to prevent air bubble in the channel and incomplete molding. Folch et al. solved this problem through injection by aspiration, but this method does not guarantee a complete filling of the channel [65]. Le Berre et al. integrated microaspiration network around molding channels to completely release all remaining air bubble [84]. A useful application of MIMIC is substrate patterning using hydrogel, which solidifies inside the microchannel to generate compartments for passive feeding of cells. Lee et al. used microfluidic moldings to fabricate 3D ECM structures of aligned collagen fibers for cultures of endothelial cells [85].
Other major applications of substrate physical patterning are durotaxis, cell guidance and cell growth control. Durotaxis studies use the ability of cells to sense the surface topography and stiffness. Solon et al. showed that fibroblast tend to adapt their stiffness to the stiffness of substrate [86], and Engler et al. showed that stem cell differentiation is substrate stiffness dependent [87]. Soft-lithography can create PDMS substrate stiffness from 12 kPa to 1000 kPa depending on the ratio of elastomer to curing agent [88]. In addition, hydrogel can be created with a gradient of crosslinkers to produce a substrate with a gradient of different mechanical stiffness, which can be used to study cellular response to substrate rigidity [89]. Substrate physical patterning can also be used to control cell adhesion and growth on a surface with a defined topology inside a microfluidic channel. Depending of the cell type, microstructure integration enables control of cell morphology and motility without the need for chemical stimuli or contact guidance [90,91]. Such devices with integrated microstructures have been proposed to guide cell movements, cell separation [92], or guidance of neuronal axon growth [93].
Mechanical deformation and force measurements
Behaviors of cells are directly related to their mechanical environment, namely, their confinement or the applied stresses. These environmental constrains have been shown to affect fundamental biological processes such as cell growth, differentiation, ECM metabolism and gene expression. Microtechnology can integrate sensors and actuators at the size of the cell. Depending of the application, the geometry of a cell can be imposed or forces on cells can be applied and measured. The application of these constrains can be used to: (i) extract internal mechanisms involving geometrical dependences like cytoskeleton behavior [94] or reaction-diffusion mechanisms [95]; (ii) study or mimic mechanically induced behavior of mechanotransduction [96,97] or cell motility in confined environment [98]; (iii) Mimic tissue organization like the vasculature system [99]. In addition, diseased cells show different mechanical properties than healthy cells. For example, certain cancer cells are more deformable than healthy cells [100]. This deformability has implication in metastasis spreading over tissues and allows automatic sorting of cancer cells by mechanical properties. In this part, we will describe the different methods used to measure and apply strains and stresses on a cell using simple microdevices.
Applying forces
Confining cells in a defined geometry
Fig. 7 gives examples of microfluidic tools for cell deformation and force measurements. By forcing a cell to enter a small space, one imposes its geometry. For example, Takeuchi et al. used agarose and PDMS microchambers to force E. coli cells to grow in a circular or sinusoidal shape [101], and Terenna et al. used curve PDMS microchannels to constrain growing yeast cells, which are normally straight, to grow bent in order to study the reorganization of its cytoskeleton [94]. Minc et al. achieved similar results by pushing long yeast cells into PDMS microwells, which made the cells buckle and bent [102]. This method has been used to study yeast polarization and to determine elastic modulus of the cell wall and cell turgor pressure [103]. Beyond shape changes, artificial confinement can induce cell behavior which illuminates underlying mechanisms. For example, Faure-Andre et al. injected dendritic cells into microchannels and found that the cells recovered their integrin-independent motile behavior found in living tissues [98]. Chaw et al. used a PDMS/matrigel device to study cancer metastasis by following migration and deformation of cancer cells in microchannels [104]. In these kinds of static cell shape studies, the nature of the walls of the channels may affect cell behavior, and long-term media exchange is also a concern. In another example, channel geometry has also been used to confine microtubules movement on kinesin-coated substrate [105,106].
Figure 7.
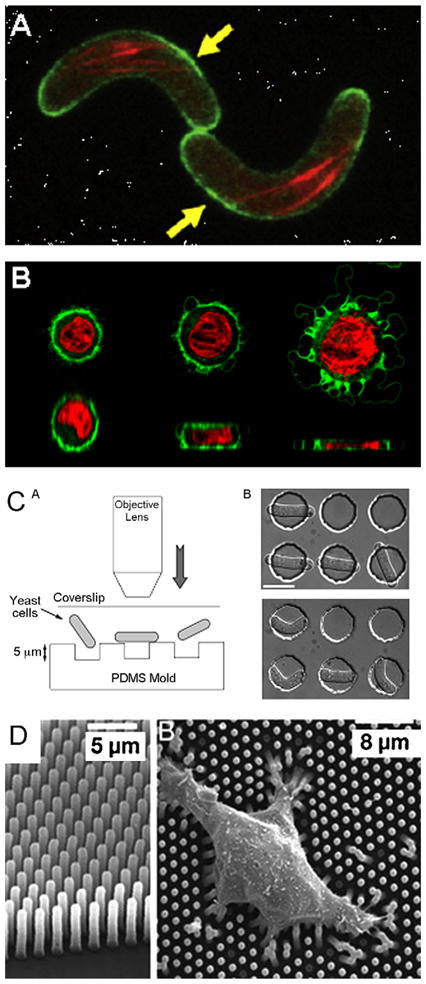
Applying and measuring forces on cell using microdevices. (A) Constraining cells using microchannel: picture of rod-shaped fission yeast cells in curved microchannel. Cells have to bend to conform to the channel shape [94]. (B) Using microfabricated membrane to deform cell: 3D reconstruction of confocal picture of a cell squeezed by a pressurized PDMS membrane. Increase in membrane pressure lead to cell deformation and cell blebbing. Top: horizontal cross-section, bottom: vertical cross-section (red: nucleus, green: membrane). (C) Microfabricated chambers for cell constrain. Left: schematic of the system showing how yeast cells are placed into the PDMS chambers using the pushing forces of the objective lens. Right: picture of the cell before (unconstrained) and after entering the microchamber (constrained) [102]. This kind of device can also be used for cell mechanical properties measurement using the deformation of the PDMS chamber due to cell turgor pressure [103]. (D) Measuring force using micropillars array: scanning EM picture of micropillars array allowing cell force measurement using pillars deformation [82].
To study dynamical changes in cell geometry, active elements such as deformable membranes are required. Kim et al. used a bilayer PDMS device with a membrane to deform cells as a function of the applied pressure [107]. They used this device to perform a mechanical lysis of cells. On the other hand, we used a similar squeezer to study the reconstruction of the cell cortex (Fig. 7B, our unpublished data).
Force measurement
Adherent cells cultured on a flat substrate can only exert forces tangentially to the surface [108]. Existing methods to measure these forces are generally called traction force microscopy, which uses engineered substrates to map the forces exerted on their surfaces. The first experiment of this kind used a substrate composed of a thin film of polymerized fluid silicon layer. The wrinkles of the film due to cell contraction on its surface viewed by phase contrast microscopy gave qualitative direction of forces exerted by the cell [108]. An improved method measured the deformation of a soft substrate by tracking displacement of embedded fluorescent beads [109]. This method enables measurement of the force field under a single cell, but requires heavy computation and image analysis due to propagation of deformation through the substrate. The sensitivity of the measurement depends on the stiffness of the substrate. For example, to measure forces exerted by mammalian motile cells, polyacrylamide hydrogel is generally used due to its low elastic modulus, which is of the order of the pressures applied by the cells (~1 kPa) [110]. The major limitations of these methods are the difficulty in keeping the beads in focus during the experiment, and the need of a reference image containing no cells to calculate bead displacements.
Microfabricated pillars, acting as cantilevers, can be used to measure forces. In this method, an array of micropillars shows local displacements due to the cell grown on top of the pillars. Since the sensitivity of this measurement depends on both the stiffness of the material, and the geometry of the micropillars, it is possible to tune the substrate apparent stiffness by modifying the pillar geometry. In addition, since the position of each pillar is known, there is no need for a reference image to calculate forces. And although the spatial resolution remains limited by the pitch of the pillar network, the calculation of forces is straightforward.
Soft-lithography molding of PDMS enables fabrication of high aspect ratio micropillars which are adapted to the range of the forces exerted by cells [88]. The deflection of such vertical PDMS pillars can measure forces from 50 pN to 100 nN per pillar [82,111]. In most of these studies, the pillars were in the range of 2—3 μm wide, 6—10 μm high and 4—9 μm spacing apart. The high aspect ratio required for mold fabrication of these pillars generally requires deep reactive ion etching (DRIE), which remains a technology not easily adapted to most biological labs.
In a confined environment, cells can also push or pull on the wall of the substrate. Methods previously mentioned cannot measure side forces. However, it is possible to measure side forces using pillars or thin walls. If the cells move between the pillars or walls, displacements can be converted into forces. This method has low precision and the confinement is not easily controlled. Another method uses PDMS devices with a deformable membrane that can measure and apply forces to cells by controlling the pressure on the membrane sitting on top of the cells while monitoring the membrane deflection. Using this method, Hohne et al. characterized the elastic modulus of objects in the range of 0.1—100 kPa. Hohne et al. and Bechinger et al. measured the force produced by a bacteria film and a single fungus appressoria using a PDMS membrane with optical deformation measurement [112,113]. More complicated apparatus have also been used such as atomic force microscope [114], magnetic beads [115], optical tweezers [116], or complex dedicated force machines [117]. Most of these apparatus measure global and local forces of cells. To our knowledge, no method exists to map normal forces applied by a cell in a confined environment with a sub-cellular spatial resolution.
Exerting a controlled force
If the precise geometry of the cell is not of concern, cells can be macroscopically subjected to stress. The stress can be compressive, for example, to study bone cell responses to mechanical stresses [118]; or the stress can be stretching, for example, stretching a flexible membrane on which cell are attached [119]. Microfluidics can be used in the application of a shear stress using a flow. Indeed, in a microchannel, cells can be easily submitted to laminar shear or extensional flow [120]. This situation is similar to vascular ducts, and can be used to produce artificial vessels to address questions such as vessel clogging by sickle blood cells [99]. Flow can be used to probe the adhesive strength of the cells [121], or lyse cells if coupled to nanoscale barbs [122].
Finally, other methods exist to exert forces on cells, such as embedding magnetic micropillars in an elastomeric substrate, and through a magnetic field, exert forces on cells [123], or using optical stretcher to produce cell surface stresses and thus determine cell deformability in microfluidic devices [100].
Temperature control
Temperature is a key parameter for cell biology studies. Biochemical reactions in cells can be temperature-dependant, such as polymerization of microtubules [124]. In addition, genetic model organisms have conditional temperature-sensitive mutations which can be switched on-off by changes in temperature. Due to their small time constant, microfluidics have strong potential for applications involving temperature changes faster than 1 min. In this part we will describe the different ways to control temperature during biological experiments involving imaging cells. First we will describe traditional temperature controls and then we will focus on microfluidic temperature controls applied to cell biology.
Macroscopic temperature controls are precise but slow
Microscope incubation box is the most common method used to control the temperature of a biological experiment. The box gives stable and precise (0.1 °C resolution) temperature control, but due to its size, requires several tens of minutes to achieve temperature changes. For faster temperature changes, a heated microscope stage, modified Petridish with integrated transparent heater, or a Peltier system with a drilled hole in the center to allow microscopic visualization have been developed [125]. These systems allow temperature changes of several degrees within minutes, but they generate strong temperature gradients (2—3 °C), particularly when used with immersion objective lenses, which act as a heat sink. These macroscopic methods are generally slow and do not produce homogeneous temperature fields. One current method for fast temperature changes in the seconds range uses microperfusion. However, perfusion introduces shear stresses on adherent cells, and is not adaptable to nonadherent cells.
Some biological applications require fast and precise temperature controls. For example, cytoskeletal dynamics are in the seconds range, and temperature-sensitive mutations can respond within a few minutes. Microfluidic devices reduce the volume needed for temperature control and thus allow faster temperature changes than macroscopic systems.
Microfluidics allow fast and precise temperature control
Fig. 8 gives an example of integrated temperature control. A simple microfluidic device using fluid flow can give fast and efficient temperature control. Indeed, laminar flow can generate a strong temperature gradient since heat transfer at the interface remains only diffusive. However, since the temperature diffusive coefficients of most of materials are ~100 times higher than the diffusion coefficients of small ions, it is much more difficult for temperature gradients to reach high spatial resolutions attainable by chemical gradients. Nevertheless, Lucchetta et al. used the laminar properties of microfluidic flow to generate a temperature step in a microchannel and submit the two sides of a Drosophilia embryo to different temperatures [126]. Pearce et al. used the ability of laminar flow to generate strong temperature gradients to culture neurons and recorded neuronal activities using an integrated electrode array [127]. Groisman et al. used a bilayer microfluidic device to control the temperature of a cell culture chamber by flowing temperature controlled water through the top layer [128]. Our group used a similar device to perform temperature changes of a cell culture in a range of 2—40 °C in less than 10 s (our unpublished data). We used this device to control cytoskeletal dynamic and to activate/deactivate temperature-sensitive gene products during mitosis [188].
Figure 8.
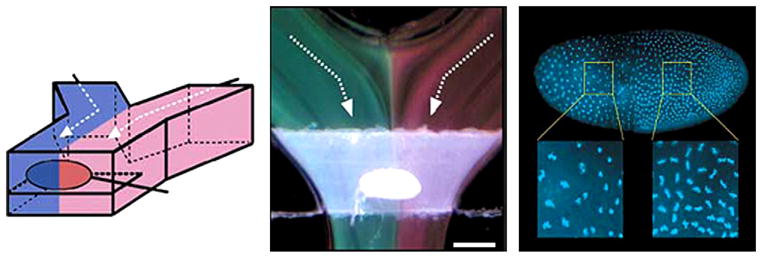
Integrated temperature control. Temperature step generator. Left: schematic of PDMS microfluidic device generating a temperature step around a Drosophila embryo. Middle: visualization of the temperature step with thermochromic liquid crystal (green: 21 °C—–red: 28 °C). Right: influence of the temperature step on the embryo nuclear density after 150 min [126].
To reach higher spatiotemporal resolution with temperature it is possible to use integrated electrodes which enable temperature changes of several tens of degrees in less than a few seconds. These kinds of devices have been extensively used for integrated PCR [129]. However, they are not transparent, and thus not usable for experiments requiring microscopic viewing of cells. For cell cultures, transparent heater electrodes can be made of a transparent conductive material such as ITO [130]. However, these kinds of devices cannot cool actively, and require cleanroom facility, making them limited for general biological usage.
Electric field integration
Electric field is widely used in biological research: (i) for characterization purposes, such as cell counting or cell sorting; (ii) for manipulation purposes, such as dielectrophoresis, electroporation, or cell lysis; and (iii) for chemical and electrical measurement, such as electrochemical detection of consumption/release of chemicals, or ion channel characterization. Depending on the application, electrodes can be integrated or externalized. The characteristic length of microsystems leads to a favorable scaling of electric fields. It is possible to generate high electric fields with very small voltages.
Compared to optical detection, electronic measurements provide a more convenient form of information recording, and are easier to integrate into a small volume. In addition, most electrical detections do not require specific protein labeling of tagging necessary for optical methods. The main drawback for applications with integrated electrodes is that their fabrication requires cleanroom facility. In this part, we will discuss the potential of integrating electrochemical and electrical elements into microfluidic devices for cell biology. We will first focus on the use of electric fields for cell handling and electroporation. Then we will discuss about the integration of electrochemical sensors. Other excellent reviews already exist concerning electrical forces for microscale cell handling [131], and electrical analysis of cell in microfluidic systems [132].
Cell manipulation
Forces applied by electric fields can be used for the handling or the separation of cells
Two electrical phenomena can be used to displace cells: electrophoresis (EP) and dielectrophoresis (DEP). EP interacts with the charges of cells, while DEP interacts with cell polarisability. In both cases, the applied force depends on the cell type, and thus can be used for cell separation.
In contrast to EP for separation of biological molecules, EP to separate cells is seldom miniaturized. Indeed, the main advantage of miniaturizing an EP system is to in reduce the dispersion of samples being separated. Cells diffuse slowly enough that macroscopic EP devices are already able to generate the highest separation precision. Nevertheless, microscopic EP can be integrated to transport cells in a chip or to integrate an EP step in a more complex lab-on-chip. For example, Li et al. used full glass EP chip to transport different cell types like yeast, erythrocyte, and E. coli in a microchannel [133].
DEP is generally considered better than EP for cell separation in microsystems. DEP forces increase when size is reduced, and DEP has few adverse effects on cells [134]. Different cell types have different protein expression patterns which produce different cell polarisability. This phenomenon enables DEP to separate different cells types, even dead cells. DEP can also be used to spatially position cells using stationary field traps which can be dynamically inactivated or move. This method can potentially create long-term patterns of nonadherant cells with the ability to move them independently. Depending on the type of manipulation, different electrode size and configuration can be fabricated, such as an interdigitating electrode array for cell trapping [135], or quadripole electrode array [136].
Microelectroporation is integrative and can improve the poration yield
When a pulse of electric field higher than 1 kV/cm is applied to mammalian cells the cell membrane is temporary compromised and generate pores which allow exchange between the intracellular and extracellular medium. This reversible phenomenon is known as electroporation. Electroporation allows molecules which are normally not able to cross the plasma membrane, such as DNA, drugs, proteins, amino acids or dyes to enter or leave the cell. When far higher voltages are used, the pores do not reseal, resulting in cell inactivation or cell lysis. Macroscopic devices for electroporation currently exist, but microsystems have numerous advantages.
Microsystems enable precise positioning of the electrode in the vicinity of a cell, resulting in high and localized electric fields for electroporation at low voltages. The cell can be immobilized during electroporation [137], or flowing through a channel, or electroporated/lysed during passage through a constricted zone [138]. Cells can be massively electroporated in parallel arrays, with a voltage as low as 1 V [139]. Using microchannel, the electrodes can be placed externally, and the electric field can be focused on to the cell by constricting the channel. Cells passing through a constricted channel (200 cells/s) can be electroporated in this manner [140].
Another advantage of microfluidic electroporation is better efficiency of poration due to a better homogeneity and reproducibility of the electric field, and a weaker effect of joule heating induced by the applied voltage [141].
At higher voltage, the cell is lysed
Cell lysis enables the study of cell biochemical content. The main advantages of miniaturization of cell lysis are single-cell operation, and coupling of lysis with other operations such as electrophoresis [142]. Many microfluidic devices miniaturize existing macroscopic techniques of cell lysis. Mechanical lyses using chemical detergent [143] is a simple method, but it remains an invasive method for subsequent chemical analysis. Electrical field can lyse cells faster, and without the addition of chemicals. Similar to electroporation, microscale lysing devices have the additional advantage of using small voltages [138], and can couple subsequent analysis of single cells. For example, McClain et al. integrated cell lysis and electrophoresis in the same device to perform fast sequential analyses at rate of 10 cells/min [144]. El-Ali et al. presented a similar device, and included a stimulus area to study fast cell response processes [145].
Toward combinatory cell fusions
If two cells are put into contact, the application of a high intensity electric pulse can lead to membrane rupture and subsequent fusion of cells [146,147]. Improvement on cell fusion can be achieved using microfluidics. By pairing two kinds of cells on an array using microfluidics, it is possible to perform large-scale heterofusion with a high yield (>50%) [148]. This tool can be used for production of hybrid cells, cloning, or for studying gene expression.
Electrical measurement
Current or voltage detection, patch clamp and impedance measurements are often used to determine electrical characteristics of cells. These techniques have been integrated into microfluidic devices and will be briefly reviewed here.
Patch clamp become widely miniaturized
Fig. 9 gives examples of microfluidic devices for patch clamping and cell fusion. Patch clamp is a method to measure the activity of a single ion channel on the cell membrane. Traditionally, patch clamp is performed by clamping a glass pipette onto the cell surface using micromanipulators and vibration-free equipments. Several commercial solutions currently exist for patch clamping. However, new techniques coupling patch clamp to microfluidics are being developed. PDMS microchannels can be used for patch clamping. Since microfluidic patch clamping is integrated in the bulk of the microfluidic device there is no need for vibration control and the cell can stay in place for longer time periods.
Figure 9.
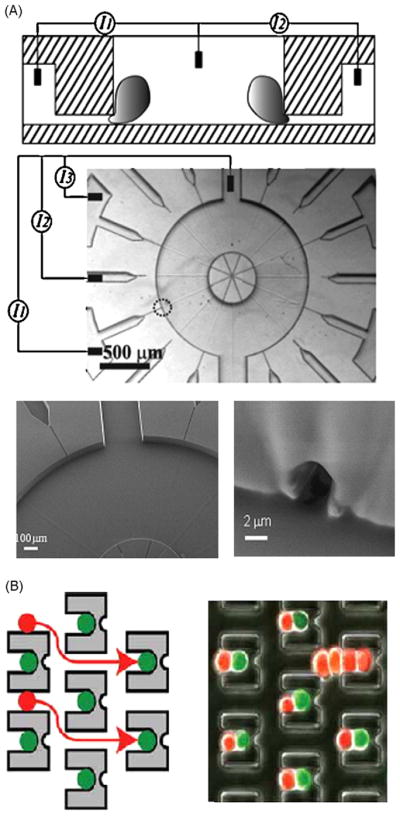
Patch clamp and cell fusion. (A) PDMS micro patch clamp. Top: schematic of the patch clamp device. Middle: picture of the patch clamp array. The small circle indicates one of the patch sites. Bottom: zoom on the patch site [149]. (B) Cell pairing and fusion device: schematic and picture show two different cell types pairing before fusion [148].
The main difficulty for microfluidic patch clamp is to reach a seal resistance in the GΩ range. Seo et al. proposed a multi-patch clamp array able to automatically place mammalian cells into the clamp sites by hydrodynamic forces, but obtain a seal resistance of only 140 MΩ [149]. Chen et al. designed microchannels for patch clamp with 1-μm aperture, which could reach 1 GΩ seal resistance on 67% of the cells, similar to results obtained with micropipettes [150].
Amperometry allows detection of exocytose events of electroactive molecules
Amperometric methods can detect small amounts of chemical compounds by measuring electron transfer across an electrode. Amperometry is generally used for the detection of electroactive species released by the cell [151]. Confinement of microelectrodes in thin microchannels can enhance system sensitivity while collecting larger amount of information. For example, Hafez et al. used four electrode arrays to map exocytosis with subcellular spatial resolution [152]. Sun et al. used fully transparent chip integrated ITO electrodes to detect exocytosis events of catecholamine [153]. Amatore et al. used integrated platinum electrodes to measure chemical response of macrophage to oxidative stress [154]. Amperometric measurement can be coupled with other microfluidic functionality. Werdich et al. measured extracellular potentials from single adult murine cardiac myocytes with local application of drug [155]. Son et al. integrated cell lysis of red blood cells upstream of amperometric detection of hemoglobin using an interdigitating electrode array [156].
Impedance measurement
Impedimetric methods measure the electrical conductivity (inverse of impedence) of the sample, which depends on size, shape, and other characteristics. Integration of microfluidics and electrodes enables impedance measurements of individual cells [157], to detect morphological changes, to follow metabolic activity, to count and sort cells, and to perform density measurements, or even exotic phenomena like germination of spores [158], and detection of bacteria in food samples [159]. Impedance measurement of single cell gives information about cell pathology, and therefore can be used to study pharmaceutical effects on cells. Drawbacks include low specificity and long measurement time, making impedametric less useful for applications such as cell sorting.
Application of microfluidic to cell culture
Fig. 10 gives examples of microfluidic cell culturing systems. Cell culture methods are essential for cell biology experiments. Traditional macroscopic culture methods such as ECM-coated Petridish poorly mimics in vivo conditions such as growth factor concentration, chemical and mechanical stimuli. In addition, large-scale experiments, which consist of doing a large number of experiments at the same time in different conditions, are often not feasible. For example, evaporation of the culture medium strongly limits the passage from 384-well plate to 1536-well plate. Microfluidics offer several advantages and open numerous new opportunities for research using cell cultures: (i) decreasing cell culture volume, and thus enabling large-scale parallelization, and limit cell colony mutation; (ii) integration of parameters such as medium exchange and substrate patterning; (iii) integration of stimuli and measurement elements (mechanical, electrical, etc…). We review here general applications of microfluidics to cell culture. For more details on specific cell types and microfluidics, see Li et al. [133].
Figure 10.
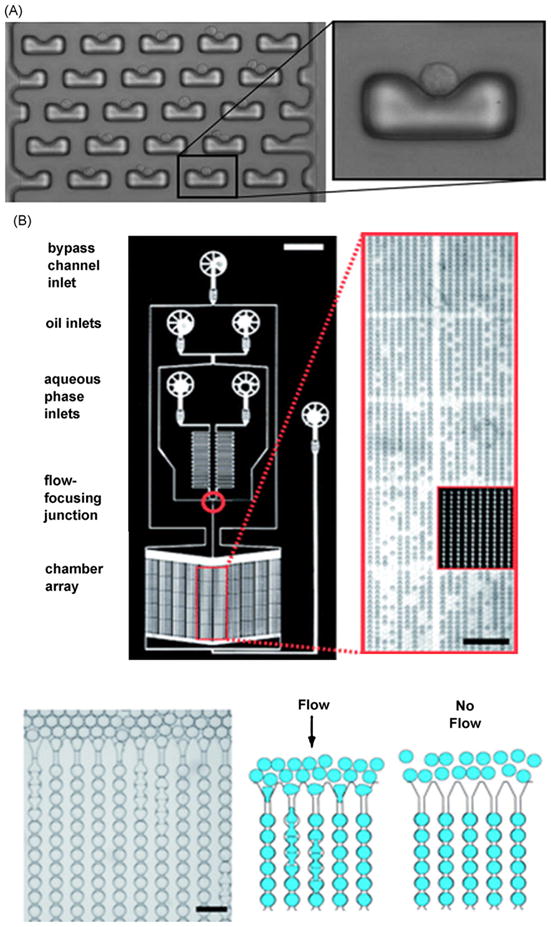
Integrated cell culture system. (A) Single cell trapping array. Picture of a cell trapping array using hydrodynamic trap and zoom on a single cell trap [168]. (B) Droplet based yeast culture system. Top: this device can generate and store 8000 droplets within a 7 mm2 area. Bottom: picture and schematic illustrating droplet loading (scale 100 μm) [177].
Microfluidic systems produce smaller cell culture chamber volume (nL), and enables parallelization of chambers. Groisman et al. and Balagadde et al. designed nL chambers for bacteria culture with integrated chemostat and media renewal for long-term colony culture in controlled condition [128,160]. Thompson et al. designed a cell culture array with integrated gradient generators to monitor fluorescence gene expression in several independent bacteria colonies in different conditions [161]. Hung et al. developed a cell culture array of 100 microperfusion chambers for Hela cells [162]. Gomez-Sjoberg et al. developed an array of 96 chambers with independent culture conditions that can maintain cell viability for many weeks [163]. Yamada et al. designed a simple microfluidic device which mixes two inlets and redistribute them in stepwise concentration downstream [164].
It is possible to integrate both hydrogel and PDMS into a hybrid technology mimicking the 3D cellular environment [165]. This approach has been applied by Lee et al. to fabricate 3D ECM matrixes with aligned collagen fibers for endothelial cell culture [85], and by Tan and Desai to create layers upon layers of cells co-cultured with different type of cells [166].
System biology, which focuses on the complete understanding of cellular signaling pathways, could also benefit from microfluidic devices. The ability to perform high-resolution spatiotemporal gradients, partial treatment of cell with different chemicals, coupled with the possibility of highly parallel and automated operation at the single cell level will be of particular interest for this field. The potential of microfluidics for system biology is reviewed by Breslauer et al. [167].
Medium renewal
Medium renewal is a key parameter for long-term cell experiment. Traditional usage of a sealed glass slide is convenient but not good beyond a few hours. The use of Petridishes or well plates, when coupled to a perfusion system, extend the experimental time. However, this is only useful for adherent cells, and for cells where factors secreted can be flushed away. Microfluidics may provide promising solutions to medium renewal.
For experiments lasting several days or even weeks, the most common microfluidic devices use active pumping of media. Media can be renewed by diffusion between the feeding channel and the channel containing cells. For nonadherent cells, cells can be trapped using hydrodynamic trap [168], or by geometrically constraining cells [169]. Media can thus flow around the trapped cells. Recently, Charvin et al. proposed a microfluidic device for long-term yeast and bacteria cultures using two layers of PDMS channel separated by a cellulose membrane [170]. Flowing medium through the upper channel allowed nutriments to diffuse through the cellulose membrane to the lower channel containing cell cultures, without disturbing cells with flows. This cell culture system is now commercialized by Warner instrument.
Single cell culture
The ability to monitor single cell can decouple the noise coming from population heterogeneity [171]. There are several ways to study individual cells using microfluidic devices. The most straight forward method is to pattern adhesive patches on the substrate as described in the previous section. For nonadherent cells, individual hydrodynamic trap, combined with continuous flow [172] and fast media switching [37], is an elegant way to perform single cell experiment. Using this approach, Di Carlo et al. developed a device to automatically position single Hela cells inside a microfluidic device [168]. Lee et al. designed an array of traps to study cell-cell interaction between two different cell types [173].
Single cell culture devices can also be combined with other microfluidic operations. Zhong et al. developed a device which extracts total mRNA from a single human stem cell to perform gene expression profiling [174]. mRNA studies using single cell microfluidic systems seem to give better results than macroscopic experiment [175].
Another convenient way to perform single cell handling and culture is the use of microfluidic droplet generators. Microfluidics are well fitted for automation and handling of a large number of droplets with controlled volume and composition [176]. Schmitz et al. developed a microfluidic device which was able to generate array of thousands of droplets with embedded yeast cells [177], and Chabert and Vivoy used droplet generator to isolate and encapsulate cancer lymphocyte cells from whole blood sample [178]. Microfluidic droplets have the advantage of complete separation of cells, but cell media cannot be exchanged inside the droplets. This method can also be adapted for encapsulation of single cell, and then measure the small amount of molecules generated by the cell [179].
Critiques of PDMS soft-lithography for cell biological studies
A large number of technologies and materials such as silicon, PMMA, parylene, and even gelatin [180] currently exist to fabricate microfluidic devices [181]. However, because of the simplicity of the technology and the physical and chemical characteristic of PDMS, soft-lithography of PDMS has become the most popular technology. From a technological view point, the ability to fabricate microfluidic devices in a period of hours, without the need for an expensive cleanroom, is very attractive for cell biologists starting microfluidics.
In addition, PDMS has numerous advantages due to its intrinsic properties. PDMS is a biocompatible [182], cheap, transparent (240—1100 nm) with low autofluorescence [183], and can be molded with submicron resolution [184]. PDMS replica can be covalently bonded to a glass coverslip using simple plasma treatment to form a sealed microfluidic device. The deformability of PDMS enables leak-proof fluidic connection and easy integration of fluidic valves. PDMS deformability also enables fabrication of mechanical sensors scaled to study cell mechanics [82]. Further, this elastomer is permeable to gas [185], enough to allow O2 exchange on chip for mammalian cell cultures [186].
There are drawbacks of using PDMS in cell biology. PDMS can absorb/adsorb small hydrophobic biomolecules and drugs away from the media [187]. Indeed, the absorption property of PDMS has been exploited as an extraction matrix to remove traces of organic compounds from solution. Researchers have noticed adsorption of proteins on the PDMS surface, which can be a major problem for cell biological studies. For experiments on cell signaling and determination of drug dosage response, the use of PDMS can strongly bias the final result. To overcome this adsorption problem, a number of PDMS surface treatments have been developed.
A second major problem of PDMS is its permeability to water vapor, leading to evaporation inside the device. This effect can lead to changes in the medium osmolarity, or complete drying over time. It is generally possible to overcome this problem using hydration channel network, medium renewal system, or hygrometry controlled environment. Ideally, PDMS device should be conditioned several hours before usage to stabilize device hygrometry.
Despite these limitations, PDMS microfluidic devices are widely use in cell biological studies. Therefore, it is necessary to understand the effects of the microscale environment to properly interpret and compare results obtain in microfluidic devices with ones using traditional methods. There are significant differences in cell proliferation, glucose consumption, gene expression pattern, and mitosis defect between traditional well plates and PDMS micro cultures [187].
Conclusion and perspectives
For many years, microfluidic devices were mostly developed first in physic/chemistry labs, then with eventual collaboration with biologists. Those researchers developed important technological advancements (e.g., multilayer molds or 3D microfluidic structures), enhanced the capabilities of microfluidics by integrating various active elements (e.g., valves and electrodes), and created efficient and precise setups for fluid handling (e.g., hydrodynamic focusing, droplet formation). Nevertheless, these technologies and setups seldom take into account the needs of routine biological experiments or technical limitations of most biological labs. In the last few years, we begin to see the setups of basic microfluidic equipments and facilities directly in cell biology labs, leading to the development and application of microfluidic devices more attuned to biological requirements and limitations. In addition, this strong interdisciplinary interaction creates a feedback loop, where limitations in microfluidics discovered by biologists will spur new research in microfluidics, which in turns will spur new research in biology.
Acknowledgments
Guilhem Velve-Casquillas is supported by a postdoctoral fellowship from ARC. The Piel Lab is supported by grants from ANR and HFSP. The Tran Lab is supported by grants from NIH, ACS, ANR, and HFSP.
Biographies
Guilhem Velve-Casquillas received his BS in Microelectronics and MS in Micro- and Nanotechnology at the University of Orsay, Paris in 2005. He received his PhD in Physics under the co-direction of Yong Chen and Jean-Jacques Greffet at LPN-CNRS/ECP/ENS Paris in 2008. His thesis focused on microfluidics and thermal management at the microscale. He is currently the ARC Postdoctoral Fellow with Phong Tran at the Institut Curie, Paris, where he develops microfluidic devices and integrated temperature control for studies in cell polarity and cell shape.

Maël Le Berre received his MS in Microelectronic from Ecole Supérieure d’Ingénieur en Electronique et Electrotechnique in 2004. He received his PhD in Physical Chemistry under the direction of Yong Chen at the Ecole Normale Supérieure in 2009. He is currently a Postdoctoral Fellow with Matthieu Piel at the Institut Curie, Paris, where he studies cell motility and proliferation in confined and non-adhesive microenvironments.
Matthieu Piel received his BS in Mathematics and Physics and his MS in Physics of Liquids and Soft Matter at the Ecole Polytechnique, Paris. He received his PhD in Biophysics under the direction of Michel Bornens at the Institut Curie, Paris, in 2002. He was the HFSP Postdoctoral Fellow with Andrew Murray at Harvard University where he developed quantitative microscopy and microfluidics to study signaling pathways in yeast mating. Since 2007, he is Group Leader of the “Systems Biology of Cell Polarity and Cell Division” laboratory at the Institut Curie, Paris. His lab develops microfabricated tools to control cellular microenvironment to quantitatively address questions in cell polarity and cell division.

Phong Tran received his BA in Biophysics at UC Berkeley in 1991. He received his PhD in Cell Biology under the direction of Ted Salmon at UNC-Chapel Hill in 1998. He was a Postdoctoral Fellow with Fred Chang at Columbia University, and then with Michel Bornens at the Institut Curie. He is currently Associate Professor of Cell and Developmental Biology at the University of Pennsylvania, Philadelphia and Adjunct Group Leader of the “Cytoskeleton Architecture and Cell Morphogenesis” laboratory at the Institut Curie, Paris. His lab addresses mechanisms of cell polarity and cell division.
References
- 1.Campbell CJ, Grzybowski BA. Philos Trans A Math Phys Eng Sci. 2004;362:1069. doi: 10.1098/rsta.2003.1363. [DOI] [PubMed] [Google Scholar]
- 2.Stroock AD, Dertinger SK, Ajdari A, Mezic I, Stone HA, Whitesides GM. Science. 2002;295:647. doi: 10.1126/science.1066238. [DOI] [PubMed] [Google Scholar]
- 3.Duffy DC, McDonald JC, Schueller OJA, Whitesides GM. Anal Chem. 1998;70:4974. doi: 10.1021/ac980656z. [DOI] [PubMed] [Google Scholar]
- 4.McDonald JC, Whitesides GM. Acc Chem Res. 2002;35:491. doi: 10.1021/ar010110q. [DOI] [PubMed] [Google Scholar]
- 5.Unger MA, Chou HP, Thorsen T, Scherer A, Quake SR. Science. 2000;288:113. doi: 10.1126/science.288.5463.113. [DOI] [PubMed] [Google Scholar]
- 6.Parent CA, Devreotes PN. Science. 1999;284:765. doi: 10.1126/science.284.5415.765. [DOI] [PubMed] [Google Scholar]
- 7.Chung BG, Flanagan LA, Rhee SW, Schwartz PH, Lee AP, Monuki ES, et al. Lab Chip. 2005;5:401. doi: 10.1039/b417651k. [DOI] [PubMed] [Google Scholar]
- 8.Jeon NL, Baskaran H, Dertinger SKW, Whitesides GM, Van De Water L, Toner M. Nat Biotechnol. 2002;20:826. doi: 10.1038/nbt712. [DOI] [PubMed] [Google Scholar]
- 9.Lin F, Nguyen CMC, Wang SJ, Saadi W, Gross SP, Jeon NL. Ann Biomed Eng. 2005;33:475. doi: 10.1007/s10439-005-2503-6. [DOI] [PubMed] [Google Scholar]
- 10.Abhyankar VV, Lokuta MA, Huttenlocher A, Beebe DJ. Lab Chip. 2006;6:389. doi: 10.1039/b514133h. [DOI] [PubMed] [Google Scholar]
- 11.Irimia D, Liu SY, Tharp WG, Samadani A, Toner M, Poznansky MC. Lab Chip. 2006;6:191. doi: 10.1039/b511877h. [DOI] [PMC free article] [PubMed] [Google Scholar]
- 12.Mao H, Cremer PS, Manson MD. Proc Natl Acad Sci USA. 2003;100:5449. doi: 10.1073/pnas.0931258100. [DOI] [PMC free article] [PubMed] [Google Scholar]
- 13.Barkefors I, Le Jan S, Jakobsson L, Hejll E, Carlson G, Johansson H, et al. J Biol Chem. 2008;283:13905. doi: 10.1074/jbc.M704917200. [DOI] [PubMed] [Google Scholar]
- 14.Wang SJ, Saadi W, Lin F, Minh-Canh Nguyen C, Li Jeon N. Exp Cell Res. 2004;300:180. doi: 10.1016/j.yexcr.2004.06.030. [DOI] [PubMed] [Google Scholar]
- 15.Walker GM, Ozers MS, Beebe DJ. Sens Actuators: B Chem. 2004;98:347. [Google Scholar]
- 16.Paliwal S, Iglesias PA, Campbell K, Hilioti Z, Groisman A, Levchenko A. Nature. 2007;446:46. doi: 10.1038/nature05561. [DOI] [PubMed] [Google Scholar]
- 17.Keenan TM, Folch A. Lab Chip. 2008;8:34. doi: 10.1039/b711887b. [DOI] [PMC free article] [PubMed] [Google Scholar]
- 18.Rosoff WJ, McAllister R, Esrick MA, Goodhill GJ, Urbach JS. Biotechnol Bioeng. 2005;91:754. doi: 10.1002/bit.20564. [DOI] [PubMed] [Google Scholar]
- 19.Gundersen RW, Barrett JN. Science. 1979;206:1079. doi: 10.1126/science.493992. [DOI] [PubMed] [Google Scholar]
- 20.Boyden S. J Exp Med. 1962;115:453. doi: 10.1084/jem.115.3.453. [DOI] [PMC free article] [PubMed] [Google Scholar]
- 21.Zigmond SH. J Cell Biol. 1977;75:606. doi: 10.1083/jcb.75.2.606. [DOI] [PMC free article] [PubMed] [Google Scholar]
- 22.Zicha D. Methods Mol Biol. 1997;75:449. doi: 10.1385/0-89603-441-0:449. [DOI] [PubMed] [Google Scholar]
- 23.Dertinger SK, Jiang X, Li Z, Murthy VN, Whitesides GM. Proc Natl Acad Sci USA. 2002;99:12542. doi: 10.1073/pnas.192457199. [DOI] [PMC free article] [PubMed] [Google Scholar]
- 24.Kamholz AE, Weigl BH, Finlayson BA, Yager P. Anal Chem. 1999;71:5340. doi: 10.1021/ac990504j. [DOI] [PubMed] [Google Scholar]
- 25.Jeon NL, Dertinger SKW, Chiu DT, Choi IS, Stroock AD, Whitesides GM. Langmuir. 2000;16:8311. [Google Scholar]
- 26.Dertinger SKW, Chiu DT, Li Jeon N, Whitesides GM. Anal Chem. 2001;73:1240. [Google Scholar]
- 27.Irimia D, Geba DA, Toner M. Anal Chem. 2006;78:3472. doi: 10.1021/ac0518710. [DOI] [PMC free article] [PubMed] [Google Scholar]
- 28.Cooksey GA, Sip CG, Folch A. Lab Chip. 2009;9:417. doi: 10.1039/b806803h. [DOI] [PMC free article] [PubMed] [Google Scholar]
- 29.Diao J, Young L, Kim S, Fogarty EA, Heilman SM, Zhou P, et al. Lab Chip. 2006;6:381. doi: 10.1039/b511958h. [DOI] [PubMed] [Google Scholar]
- 30.Moore TI, Chou CS, Nie Q, Jeon NL, Yi TM. PLoS One. 2008;3:e3865. doi: 10.1371/journal.pone.0003865. [DOI] [PMC free article] [PubMed] [Google Scholar]
- 31.Wu H, Huang B, Zare RN. J Am Chem Soc. 2006;128:4194. doi: 10.1021/ja058530o. [DOI] [PubMed] [Google Scholar]
- 32.Saadi W, Rhee SW, Lin F, Vahidi B, Chung BG, Jeon NL. Biomed Microdev. 2007;9:627. doi: 10.1007/s10544-007-9051-9. [DOI] [PubMed] [Google Scholar]
- 33.Mosadegh B, Huang C, Park JW, Shin HS, Chung BG, Hwang SK, et al. Langmuir. 2007;23:10910. doi: 10.1021/la7026835. [DOI] [PubMed] [Google Scholar]
- 34.Sawano A, Takayama S, Matsuda M, Miyawaki A. Dev Cell. 2002;3:245. doi: 10.1016/s1534-5807(02)00224-1. [DOI] [PubMed] [Google Scholar]
- 35.Takayama S, Ostuni E, LeDuc P, Naruse K, Ingber DE, Whitesides GM. Chem Biol. 2003;10:123. doi: 10.1016/s1074-5521(03)00019-x. [DOI] [PubMed] [Google Scholar]
- 36.Takayama S, Ostuni E, LeDuc P, Naruse K, Ingber DE, Whitesides GM. Nature. 2001;411:1016. doi: 10.1038/35082637. [DOI] [PubMed] [Google Scholar]
- 37.Wheeler AR, Throndset WR, Whelan RJ, Leach AM, Zare RN, Liao YH, et al. Anal Chem. 2003;75:3581. doi: 10.1021/ac0340758. [DOI] [PubMed] [Google Scholar]
- 38.Hersen P, McClean MN, Mahadevan L, Ramanathan S. Proc Natl Acad Sci USA. 2008;105:7165. doi: 10.1073/pnas.0710770105. [DOI] [PMC free article] [PubMed] [Google Scholar]
- 39.Knight JB, Vishwanath A, Brody JP, Austin RH. Phys Rev Lett. 1998;80:3863. [Google Scholar]
- 40.Wang HW, Bao N, Le TL, Lu C, Cheng JX. Opt Express. 2008;16:5782. doi: 10.1364/oe.16.005782. [DOI] [PMC free article] [PubMed] [Google Scholar]
- 41.Wang F, Wang H, Wang J, Wang HY, Rummel PL, Garimella SV, et al. Biotech Bioeng. 2008;100:150. doi: 10.1002/bit.21737. [DOI] [PubMed] [Google Scholar]
- 42.King KR, Wang S, Jayaraman A, Yarmush ML, Toner M. Lab Chip. 2008;8:107. doi: 10.1039/b716962k. [DOI] [PubMed] [Google Scholar]
- 43.Sabounchi P, Ionescu-Zanetti C, Chen R, Karandikar M, Seo J, Lee LP. Appl Phys Lett. 2006;88:183901. [Google Scholar]
- 44.Polinkovsky M, Gutierrez E, Levchenko A, Groisman A. Lab Chip. 2009;9:1073. doi: 10.1039/b816191g. [DOI] [PubMed] [Google Scholar]
- 45.Gray JM, Karow DS, Lu H, Chang AJ, Chang JS, Ellis RE, et al. Nature. 2004;430:317. doi: 10.1038/nature02714. [DOI] [PubMed] [Google Scholar]
- 46.Fink J, Thery M, Azioune A, Dupont R, Chatelain F, Bornens M, et al. Lab Chip. 2007;7:672. doi: 10.1039/b618545b. [DOI] [PubMed] [Google Scholar]
- 47.Gunawan RC, Choban ER, Conour JE, Silvestre J, Schook LB, Gaskins HR, et al. Langmuir. 2005;21:3061. doi: 10.1021/la048303k. [DOI] [PubMed] [Google Scholar]
- 48.Brock A, Chang E, Ho CC, LeDuc P, Jiang X, Whitesides GM, et al. Langmuir. 2003;19:1611. doi: 10.1021/la026394k. [DOI] [PubMed] [Google Scholar]
- 49.Thery M, Racine V, Piel M, Pepin A, Dimitrov A, Chen Y, et al. Proc Natl Acad Sci USA. 2006;103:19771. doi: 10.1073/pnas.0609267103. [DOI] [PMC free article] [PubMed] [Google Scholar]
- 50.Thery M, Pepin A, Dressaire E, Chen Y, Bornens M. Cell Motil Cytoskeleton. 2006;63:341. doi: 10.1002/cm.20126. [DOI] [PubMed] [Google Scholar]
- 51.Kim E, Xia Y, Whitesides GM. J Am Chem Soc. 1996;118:5722. [Google Scholar]
- 52.Lo CM, Wang HB, Dembo M, Wang Y. Biophys J. 2000;79:144. doi: 10.1016/S0006-3495(00)76279-5. [DOI] [PMC free article] [PubMed] [Google Scholar]
- 53.Wyart C, Ybert C, Bourdieu L, Herr C, Prinz C, Chatenay D. J Neurosci Methods. 2002;117:123. doi: 10.1016/s0165-0270(02)00077-8. [DOI] [PubMed] [Google Scholar]
- 54.Shi J, Ni XF, Chen Y. Langmuir. 2007;23:11377. doi: 10.1021/la702076u. [DOI] [PubMed] [Google Scholar]
- 55.Azioune A, Storch M, Bornens M, Théry M, Piel M. Lab Chip. 2009;9:1640. doi: 10.1039/b821581m. [DOI] [PubMed] [Google Scholar]
- 56.Blondiaux N, Zurcher S, Liley M, Spencer ND. Langmuir. 2007;23:3489. doi: 10.1021/la063186+. [DOI] [PubMed] [Google Scholar]
- 57.Kane RS, Takayama S, Ostuni E, Ingberb DE, Whitesides GM. Biomaterials. 2006;20:161. doi: 10.1016/s0142-9612(99)00165-9. (the Biomaterials Silver Jubilee Compendium the best papers published in Biomaterials, 1980—2004) [DOI] [PubMed] [Google Scholar]
- 58.Bernard A, Renault JP, Michel B, Bosshard HR, Delamarche E. Adv Mater. 2000;12:1067. [Google Scholar]
- 59.von Philipsborn AC, Lang S, Bernard A, Loeschinger J, David C, Lehnert D, et al. Nat Protoc. 2006;1:1322. doi: 10.1038/nprot.2006.251. [DOI] [PubMed] [Google Scholar]
- 60.von Philipsborn AC, Lang S, Loeschinger J, Bernard A, David C, Lehnert D, et al. Development. 2006;133:2487. doi: 10.1242/dev.02412. [DOI] [PubMed] [Google Scholar]
- 61.Mayer M, Yang J, Gitlin I, Gracias DH, Whitesides GM. Proteomics. 2004;4:2366. doi: 10.1002/pmic.200300748. [DOI] [PubMed] [Google Scholar]
- 62.Crozatier C, Berre ML, Chen Y. Microelec Eng. 2006;83:910. [Google Scholar]
- 63.Xu L, Robert L, Ouyang Q, Taddei F, Chen Y, Lindner AB, et al. Nano Lett. 2007;7:2068. doi: 10.1021/nl070983z. [DOI] [PubMed] [Google Scholar]
- 64.Tourovskaia A, Barber T, Wickes BT, Hirdes D, Grin B, Castner DG, et al. Langmuir. 2003;19:4754. [Google Scholar]
- 65.Folch A, Jo BH, Hurtado O, Beebe DJ, Toner M. J Biomed Mater Res. 2000;52:346. doi: 10.1002/1097-4636(200011)52:2<346::aid-jbm14>3.0.co;2-h. [DOI] [PubMed] [Google Scholar]
- 66.Jiang X, Xu Q, Dertinger SKW, Stroock AD, Fu T, Whitesides GM. Anal Chem. 2005;77:2338. doi: 10.1021/ac048440m. [DOI] [PubMed] [Google Scholar]
- 67.Delamarche E, Bernard A, Schmid H, Michel B, Biebuyck H. Science. 1997;276:779. doi: 10.1126/science.276.5313.779. [DOI] [PubMed] [Google Scholar]
- 68.Le Berre M, Crozatier C, Velve-Casquillas G, Chen Y. Microelec Eng. 2006;83:1284. [Google Scholar]
- 69.Folch A, Toner M. Biotechnol Prog. 1998;14:388. doi: 10.1021/bp980037b. [DOI] [PubMed] [Google Scholar]
- 70.Fosser KA, Nuzzo RG. Anal Chem. 2003;75:5775. doi: 10.1021/ac034634a. [DOI] [PubMed] [Google Scholar]
- 71.Vanapalli SA, Duits MHG, Mugele F. Biomicrofluidics. 2009;3:12006. doi: 10.1063/1.3067820. [DOI] [PMC free article] [PubMed] [Google Scholar]
- 72.Chiu DT, Jeon NL, Huang S, Kane RS, Wargo CJ, Choi IS, et al. Proc Natl Acad Sci USA. 2000;97:2408. doi: 10.1073/pnas.040562297. [DOI] [PMC free article] [PubMed] [Google Scholar]
- 73.Xu T, Petridou S, Lee EH, Roth EA, Vyavahare NR, Hickman JJ, et al. Biotechnol Bioeng. 2004;85:29. doi: 10.1002/bit.10768. [DOI] [PubMed] [Google Scholar]
- 74.Pardo L, Wilson WC, Jr, Boland T. Langmuir. 2003;19:1462. [Google Scholar]
- 75.Gotlieb AI, May LM, Subrahmanyan L, Kalnins VI. J Cell Biol. 1981;91:589. doi: 10.1083/jcb.91.2.589. [DOI] [PMC free article] [PubMed] [Google Scholar]
- 76.Takezawa T, Mori Y, Yoshizato K. Nat Biotech. 1990;8:854. doi: 10.1038/nbt0990-854. [DOI] [PubMed] [Google Scholar]
- 77.Ito Y, Chen G, Guan Y, Imanishi Y. Langmuir. 1997;13:2756. [Google Scholar]
- 78.Liu D, Xie Y, Shao H, Jiang X. Angew Chem Int Ed Engl. 2009;48:4406. doi: 10.1002/anie.200901130. [DOI] [PubMed] [Google Scholar]
- 79.Jiang X, Ferrigno R, Mrksich M, Whitesides GM. J Am Chem Soc. 2003;125:2366. doi: 10.1021/ja029485c. [DOI] [PubMed] [Google Scholar]
- 80.Yousaf MN, Houseman BT, Mrksich M. Proc Natl Acad Sci USA. 2001;98:5992. doi: 10.1073/pnas.101112898. [DOI] [PMC free article] [PubMed] [Google Scholar]
- 81.Khademhosseini A, Yeh J, Eng G, Karp J, Kaji H, Borenstein J, et al. Lab Chip. 2005;5:1380. doi: 10.1039/b508096g. [DOI] [PubMed] [Google Scholar]
- 82.du Roure O, Saez A, Buguin A, Austin RH, Chavrier P, Silberzan P, et al. Proc Natl Acad Sci USA. 2005;102:2390. doi: 10.1073/pnas.0408482102. [DOI] [PMC free article] [PubMed] [Google Scholar]
- 83.Park MC, Hur JY, Kwon KW, Park SH, Suh KY. Lab Chip. 2006;6:988. doi: 10.1039/b602961b. [DOI] [PubMed] [Google Scholar]
- 84.Le Berre M, Shi J, Crozatier C, Velve-Casquillas G, Chen Y. Microelec Eng. 2007;84:864. [Google Scholar]
- 85.Lee P, Lin R, Moon J, Lee LP. Biomed Microdev. 2006;8:35. doi: 10.1007/s10544-006-6380-z. [DOI] [PubMed] [Google Scholar]
- 86.Solon J, Levental I, Sengupta K, Georges PC, Janmey PA. Biophys J. 2007;93:4453. doi: 10.1529/biophysj.106.101386. [DOI] [PMC free article] [PubMed] [Google Scholar]
- 87.Engler AJ, Sen S, Sweeney HL, Discher DE. Cell. 2006;126:677. doi: 10.1016/j.cell.2006.06.044. [DOI] [PubMed] [Google Scholar]
- 88.Balaban NQ, Schwarz US, Riveline D, Goichberg P, Tzur G, Sabanay I, et al. Nat Cell Biol. 2001;3:466. doi: 10.1038/35074532. [DOI] [PubMed] [Google Scholar]
- 89.Zaari N, Rajagopalan P, Kim SK, Engler AJ, Wong JY. Adv Mater. 2004;16:2133. [Google Scholar]
- 90.Rajnicek A, Britland S, McCaig C. J Cell Sci. 1997;110:2905. doi: 10.1242/jcs.110.23.2905. [DOI] [PubMed] [Google Scholar]
- 91.Teixeira AI, Abrams GA, Bertics PJ, Murphy CJ, Nealey PF. J Cell Sci. 2003;116:1881. doi: 10.1242/jcs.00383. [DOI] [PMC free article] [PubMed] [Google Scholar]
- 92.Kwon KW, Choi SS, Lee SH, Kim B, Lee SN, Park MC, et al. Lab Chip. 2007;7:1461. doi: 10.1039/b710054j. [DOI] [PubMed] [Google Scholar]
- 93.Dowell-Mesfin NM, Abdul-Karim MA, Turner AMP, Schanz S, Craighead HG, Roysam B, et al. J Neural Eng. 2004;1:78. doi: 10.1088/1741-2560/1/2/003. [DOI] [PubMed] [Google Scholar]
- 94.Terenna CR, Makushok T, Velve-Casquillas G, Baigl D, Chen Y, Bornens M, et al. Curr Biol. 2008;18:1748. doi: 10.1016/j.cub.2008.09.047. [DOI] [PMC free article] [PubMed] [Google Scholar]
- 95.Meyers J, Craig J, Odde DJ. Curr Biol. 2006;16:1685. doi: 10.1016/j.cub.2006.07.056. [DOI] [PubMed] [Google Scholar]
- 96.Katsumi A, Orr AW, Tzima E, Schwartz MA. J Biol Chem. 2004;279:12001. doi: 10.1074/jbc.R300038200. [DOI] [PubMed] [Google Scholar]
- 97.Chrzanowska-Wodnicka M, Burridge K. J Cell Biol. 1996;133:1403. doi: 10.1083/jcb.133.6.1403. [DOI] [PMC free article] [PubMed] [Google Scholar]
- 98.Faure-Andre G, Vargas P, Yuseff MI, Heuze M, Diaz J, Lankar D, et al. Science. 2008;322:1705. doi: 10.1126/science.1159894. [DOI] [PubMed] [Google Scholar]
- 99.Higgins JM, Eddington DT, Bhatia SN, Mahadevan L. Proc Natl Acad Sci USA. 2007;104:20496. doi: 10.1073/pnas.0707122105. [DOI] [PMC free article] [PubMed] [Google Scholar]
- 100.Guck J, Schinkinger S, Lincoln B, Wottawah F, Ebert S, Romeyke M, et al. Biophys J. 2005;88:3689. doi: 10.1529/biophysj.104.045476. [DOI] [PMC free article] [PubMed] [Google Scholar]
- 101.Takeuchi S, DiLuzio WR, Weibel DB, Whitesides GM. Nano Lett. 2005;5:1819. doi: 10.1021/nl0507360. [DOI] [PMC free article] [PubMed] [Google Scholar]
- 102.Minc N, Bratman SV, Basu R, Chang F. Curr Biol. 2009;19:83. doi: 10.1016/j.cub.2008.12.008. [DOI] [PMC free article] [PubMed] [Google Scholar]
- 103.Minc N, Boudaoud A, Chang F. Curr Biol. 2009;19:1096. doi: 10.1016/j.cub.2009.05.031. [DOI] [PMC free article] [PubMed] [Google Scholar]
- 104.Chaw KC, Manimaran M, Tay EH, Swaminathan S. Lab Chip. 2007;7:1041. doi: 10.1039/b707399m. [DOI] [PubMed] [Google Scholar]
- 105.Moorjani SG, Jia L, Jackson TN, Hancock WO. Nano Lett. 2003;3:633. [Google Scholar]
- 106.Huang YM, Uppalapati M, Hancock WO, Jackson TN. IEEE Trans Adv Pack. 2005;28:564. [Google Scholar]
- 107.Kim YC, Kang JH, Park SJ, Yoon ES, Park JK. Sens Actuators: B Chem. 2007;128:108. [Google Scholar]
- 108.Harris AK, Wild P, Stopak D. Science. 1980;208:177. doi: 10.1126/science.6987736. [DOI] [PubMed] [Google Scholar]
- 109.Lee J, Leonard M, Oliver T, Ishihara A, Jacobson K. J Cell Biol. 1994;127:1957. doi: 10.1083/jcb.127.6.1957. [DOI] [PMC free article] [PubMed] [Google Scholar]
- 110.Dembo M, Wang YL. Biophys J. 1999;76:2307. doi: 10.1016/S0006-3495(99)77386-8. [DOI] [PMC free article] [PubMed] [Google Scholar]
- 111.Tan JL, Tien J, Pirone DM, Gray DS, Bhadriraju K, Chen CS. Proc Natl Acad Sci USA. 2003;100:1484. doi: 10.1073/pnas.0235407100. [DOI] [PMC free article] [PubMed] [Google Scholar]
- 112.Hohne DN, Younger JG, Solomon MJ. Langmuir. 2009:7743. doi: 10.1021/la803413x. [DOI] [PMC free article] [PubMed] [Google Scholar]
- 113.Bechinger C, Giebel KF, Schnell M, Leiderer P, Deising HB, Bastmeyer M. Science. 1999;285:1896. doi: 10.1126/science.285.5435.1896. [DOI] [PubMed] [Google Scholar]
- 114.Alcaraz J, Buscemi L, Grabulosa M, Trepat X, Fabry B, Farré R, et al. Biophys J. 2003;84:2071. doi: 10.1016/S0006-3495(03)75014-0. [DOI] [PMC free article] [PubMed] [Google Scholar]
- 115.Deng L, Trepat X, Butler JP, Millet E, Morgan KG, Weitz DA, et al. Nat Mater. 2006;5:636. doi: 10.1038/nmat1685. [DOI] [PubMed] [Google Scholar]
- 116.Hénon S, Lenormand G, Richert A, Gallet F. Biophys J. 1999;76:1145. doi: 10.1016/S0006-3495(99)77279-6. [DOI] [PMC free article] [PubMed] [Google Scholar]
- 117.Desprat N, Guiroy A, Asnacios A. Rev Sci Instrum. 2006;77:055111. [Google Scholar]
- 118.Carvalho RS, Bumann A, Schwarzer C, Scott E, Yen HK. Eur J Orthodontics. 1996;18:227. doi: 10.1093/ejo/18.3.227. [DOI] [PubMed] [Google Scholar]
- 119.Zhuang J, Yamada KA, Saffitz JE, Kleber AG. Circ Res. 2000;87:316. doi: 10.1161/01.res.87.4.316. [DOI] [PubMed] [Google Scholar]
- 120.Hudson SD, Phelan FR, Jr, Handler MD, Cabral JT, Migler KB, Amis EJ. Appl Phys Lett. 2004;85:335. [Google Scholar]
- 121.Song JW, Cavnar SP, Walker AC, Luker KE, Gupta M, Tung YC, et al. PLoS One. 2009;4:e5756. doi: 10.1371/journal.pone.0005756. [DOI] [PMC free article] [PubMed] [Google Scholar]
- 122.Di Carlo D, Jeong KH, Lee LP. Lab Chip. 2003;3:287. doi: 10.1039/b305162e. [DOI] [PubMed] [Google Scholar]
- 123.Sniadecki NJ, Anguelouch A, Yang MT, Lamb CM, Liu Z, Kirschner SB, et al. Proc Natl Acad Sci USA. 2007;104:14553. doi: 10.1073/pnas.0611613104. [DOI] [PMC free article] [PubMed] [Google Scholar]
- 124.Fygenson DK, Braun E, Libchaber A. Phys Rev E Stat Phys. 1994;50:1579. doi: 10.1103/physreve.50.1579. [DOI] [PubMed] [Google Scholar]
- 125.Gorjanacz M, Mattaj IW, Rietdorf J. Imag Microscop. 2007;9:28. [Google Scholar]
- 126.Lucchetta EM, Lee JH, Fu LA, Patel NH, Ismagilov RF. Nature. 2005;434:1134. doi: 10.1038/nature03509. [DOI] [PMC free article] [PubMed] [Google Scholar]
- 127.Pearce TM, Wilson JA, Oakes SG, Chiu SY, Williams JC. Lab Chip. 2005;5:97. doi: 10.1039/b407871c. [DOI] [PubMed] [Google Scholar]
- 128.Groisman A, Lobo C, Cho H, Campbell JK, Dufour YS, Stevens AM, et al. Nat Methods. 2005;2:685. doi: 10.1038/nmeth784. [DOI] [PubMed] [Google Scholar]
- 129.Zhang C, Xu J, Ma W, Zheng W. Biotechnol Adv. 2006;24:243. doi: 10.1016/j.biotechadv.2005.10.002. [DOI] [PubMed] [Google Scholar]
- 130.Stangegaard M, Petronis S, Jørgensen AM, Christensen CBV, Dufva M. Lab Chip. 2006;6:1045. doi: 10.1039/b603379b. [DOI] [PubMed] [Google Scholar]
- 131.Voldman J. Annu Rev Biomed Eng. 2006;8:425. doi: 10.1146/annurev.bioeng.8.061505.095739. [DOI] [PubMed] [Google Scholar]
- 132.Bao N, Wang J, Lu C. Anal Bioanal Chem. 2008;391:933. doi: 10.1007/s00216-008-1899-x. [DOI] [PubMed] [Google Scholar]
- 133.Li N, Tourovskaia A, Folch A. Crit Rev Biomed Eng. 2003;31:423. doi: 10.1615/critrevbiomedeng.v31.i56.20. [DOI] [PMC free article] [PubMed] [Google Scholar]
- 134.Archer S, Li TT, Evans AT, Britland ST, Morgan H. Biochem Biophys Res Comm. 1999;257:687. doi: 10.1006/bbrc.1999.0445. [DOI] [PubMed] [Google Scholar]
- 135.Matsue T, Matsumoto N, Uchida I. Electrochim Acta. 1997;42:3251. [Google Scholar]
- 136.Fuhr G, Arnold WM, Hagedorn R, Müller T, Benecke W, Wagner B, et al. Biochim Biophys Acta. 1992;1108:215. doi: 10.1016/0005-2736(92)90028-k. [DOI] [PubMed] [Google Scholar]
- 137.Khine M, Lau A, Ionescu-Zanetti C, Seo J, Lee LP. Lab Chip. 2005;5:38. doi: 10.1039/b408352k. [DOI] [PubMed] [Google Scholar]
- 138.Wang HY, Bhunia AK, Lu C. Biosens Bioelectron. 2006;22:582. doi: 10.1016/j.bios.2006.01.032. [DOI] [PubMed] [Google Scholar]
- 139.Khine M, Ionescu-Zanetti C, Blatz A, Wang LP, Lee LP. Lab Chip. 2007;7:457. doi: 10.1039/b614356c. [DOI] [PubMed] [Google Scholar]
- 140.Bao N, Wang J, Lu C. Electrophoresis. 2008;9:2939. doi: 10.1002/elps.200700856. [DOI] [PubMed] [Google Scholar]
- 141.Lee WG, Demirci U, Khademhosseini A. Integ Biol. 2009;1:242. doi: 10.1039/b819201d. [DOI] [PMC free article] [PubMed] [Google Scholar]
- 142.Gao J, Yin XF, Fang ZL. Lab Chip. 2004;4:47. doi: 10.1039/b310552k. [DOI] [PubMed] [Google Scholar]
- 143.Brown RB, Audet J. J Royal Soc Interface. 2008;2(5 Suppl):131. doi: 10.1098/rsif.2008.0009.focus. [DOI] [PMC free article] [PubMed] [Google Scholar]
- 144.McClain MA, Culbertson CT, Jacobson SC, Allbritton NL, Sims CE, Ramsey JM. Anal Chem. 2003;75:5646. doi: 10.1021/ac0346510. [DOI] [PubMed] [Google Scholar]
- 145.El-Ali J, Gaudet S, Gunther A, Sorger PK, Jensen KF. Anal Chem. 2005;77:3629. doi: 10.1021/ac050008x. [DOI] [PubMed] [Google Scholar]
- 146.Chiu DT. Curr Opin Chem Biol. 2001;5:609. doi: 10.1016/s1367-5931(00)00242-8. [DOI] [PubMed] [Google Scholar]
- 147.Wang J, Lu C. Appl Phys Lett. 2006;89:234102. [Google Scholar]
- 148.Skelley AM, Kirak O, Suh H, Jaenisch R, Voldman J. Nat Methods. 2009;6:147. doi: 10.1038/nmeth.1290. [DOI] [PMC free article] [PubMed] [Google Scholar]
- 149.Seo J, Ionescu-Zanetti C, Diamond J, Lal R, Lee LP. Appl Phys Lett. 2004;84:1973. [Google Scholar]
- 150.Chen C, Folch A. Lab Chip. 2006;6:1338. doi: 10.1039/b607913j. [DOI] [PubMed] [Google Scholar]
- 151.Amatore C, Arbault S, Guille M, Lemaitre F. Chem Rev. 2008;108:2585. doi: 10.1021/cr068062g. [DOI] [PubMed] [Google Scholar]
- 152.Hafez I, Kisler K, Berberian K, Dernick G, Valero V, Yong MG, et al. Proc Natl Acad Sci USA. 2005;102:13879. doi: 10.1073/pnas.0504098102. [DOI] [PMC free article] [PubMed] [Google Scholar]
- 153.Sun X, Gillis KD. Anal Chem. 2006;78:2521. doi: 10.1021/ac052037d. [DOI] [PubMed] [Google Scholar]
- 154.Amatore C, Arbault S, Chen Y, Crozatier C, Tapsoba I. Lab Chip. 2007;7:233. doi: 10.1039/b611569a. [DOI] [PubMed] [Google Scholar]
- 155.Werdich AA, Lima EA, Ivanov B, Ges I, Anderson ME, Wikswo JP, et al. Lab Chip. 2004;4:357. doi: 10.1039/b315648f. [DOI] [PubMed] [Google Scholar]
- 156.Son SU, Seo JH, Choi YH, Lee SS. Sens Actuators: A Phys. 2006;130:267. [Google Scholar]
- 157.Jang LS, Wang MH. Biomed Microdev. 2007;9:737. doi: 10.1007/s10544-007-9084-0. [DOI] [PubMed] [Google Scholar]
- 158.Liu YS, Walter TM, Chang WJ, Lim KS, Yang L, Lee SW, et al. Lab Chip. 2007;7:603. doi: 10.1039/b702408h. [DOI] [PubMed] [Google Scholar]
- 159.Varshney M, Li Y, Srinivasan B, Tung S. Sens Actuators: B Chem. 2007;128:99. [Google Scholar]
- 160.Balagadde FK, You L, Hansen CL, Arnold FH, Quake SR. Science. 2005;309:137. doi: 10.1126/science.1109173. [DOI] [PubMed] [Google Scholar]
- 161.Thompson DM, King KR, Wieder KJ, Toner M, Yarmush ML, Jayaraman A. Anal Chem. 2004;76:4098. doi: 10.1021/ac0354241. [DOI] [PubMed] [Google Scholar]
- 162.Hung PJ, Lee PJ, Sabounchi P, Lin R, Lee LP. Biotechnol Bioeng. 2005;89:1. doi: 10.1002/bit.20289. [DOI] [PubMed] [Google Scholar]
- 163.Gomez-Sjoberg R, Leyrat AA, Pirone DM, Chen CS, Quake SR. Anal Chem. 2007;79:8557. doi: 10.1021/ac071311w. [DOI] [PubMed] [Google Scholar]
- 164.Yamada M, Hirano T, Yasuda M, Seki M. Lab Chip. 2006;6:179. doi: 10.1039/b514054d. [DOI] [PubMed] [Google Scholar]
- 165.Toh YC, Zhang C, Zhang J, Khong YM, Chang S, Samper VD, et al. Lab Chip. 2007;7:302. doi: 10.1039/b614872g. [DOI] [PubMed] [Google Scholar]
- 166.Tan W, Desai TA. Biomaterials. 2004;25:1355. doi: 10.1016/j.biomaterials.2003.08.021. [DOI] [PubMed] [Google Scholar]
- 167.Breslauer DN, Lee PJ, Lee LP. Mol BioSys. 2006;2:97. doi: 10.1039/b515632g. [DOI] [PubMed] [Google Scholar]
- 168.Di Carlo D, Wu LY, Lee LP. Lab Chip. 2006;6:1445. doi: 10.1039/b605937f. [DOI] [PubMed] [Google Scholar]
- 169.Volfson D, Cookson S, Hasty J, Tsimring LS. Proc Natl Acad Sci USA. 2008;105:15346. doi: 10.1073/pnas.0706805105. [DOI] [PMC free article] [PubMed] [Google Scholar]
- 170.Charvin G, Cross FR, Siggia ED. PLoS One. 2008;3:e1468. doi: 10.1371/journal.pone.0001468. [DOI] [PMC free article] [PubMed] [Google Scholar]
- 171.Cluzel P, Surette M, Leibler S. Science. 2000;287:1652. doi: 10.1126/science.287.5458.1652. [DOI] [PubMed] [Google Scholar]
- 172.Yamaguchi Y, Arakawa T, Takeda N, Edagawa Y, Shoji S. Sens Actuators: B Chem. 2009;136:555. [Google Scholar]
- 173.Lee PJ, Hung PJ, Shaw R, Jan L, Lee LP. Appl Phys Lett. 2005;86:223902. [Google Scholar]
- 174.Zhong JF, Chen Y, Marcus JS, Scherer A, Quake SR, Taylor CR, et al. Lab Chip. 2008;8:68. doi: 10.1039/b712116d. [DOI] [PMC free article] [PubMed] [Google Scholar]
- 175.Bontoux N, Dauphinot L, Vitalis T, Studer V, Chen Y, Rossier J, et al. Lab Chip. 2008;8:443. doi: 10.1039/b716543a. [DOI] [PubMed] [Google Scholar]
- 176.Teh SY, Lin R, Hung LH, Lee AP. Lab Chip. 2008;8:198. doi: 10.1039/b715524g. [DOI] [PubMed] [Google Scholar]
- 177.Schmitz CH, Rowat AC, Koster S, Weitz DA. Lab Chip. 2009;9:44. doi: 10.1039/b809670h. [DOI] [PubMed] [Google Scholar]
- 178.Chabert M, Viovy JL. Proc Natl Acad Sci USA. 2008;105:3191. doi: 10.1073/pnas.0708321105. [DOI] [PMC free article] [PubMed] [Google Scholar]
- 179.Koster S, Angile FE, Duan H, Agresti JJ, Wintner A, Schmitz C, et al. Lab Chip. 2008;8:1110. doi: 10.1039/b802941e. [DOI] [PubMed] [Google Scholar]
- 180.Paguirigan A, Beebe DJ. Lab Chip. 2006;6:407. doi: 10.1039/b517524k. [DOI] [PubMed] [Google Scholar]
- 181.Zhang X, Haswell SJ. MRS Bull. 2006;31:95. [Google Scholar]
- 182.Belanger MC, Marois Y. J Biomed Mater Res. 2001;58:467. doi: 10.1002/jbm.1043. [DOI] [PubMed] [Google Scholar]
- 183.Piruska A, Nikcevic I, Lee SH, Ahn C, Heineman WR, Limbach PA, et al. Lab Chip. 2005;5:1348. doi: 10.1039/b508288a. [DOI] [PubMed] [Google Scholar]
- 184.Hua F, Sun Y, Gaur A, Meitl MA, Bilhaut L, Rotkina L, et al. Nano Lett. 2004;4:2467. [Google Scholar]
- 185.Charati SG, Stern SA. Macromolecules. 1998;31:5529. [Google Scholar]
- 186.Leclerc E, Sakai Y, Fujii T. Biomed Microdev. 2003;5:109. [Google Scholar]
- 187.Paguirigan AL, Beebe DJ. Integ Biol. 2009;1:182. doi: 10.1039/b814565b. [DOI] [PMC free article] [PubMed] [Google Scholar]
- 188.Fu C, Ward JJ, Loiodice I, Velve-Casquillas G, Nedelec FJ, Tran PT. Dev Cell. 2009:257. doi: 10.1016/j.devcel.2009.06.012. [DOI] [PMC free article] [PubMed] [Google Scholar]