

Abstract
Gene targeting in ES cells was used to substitute control of angiotensin converting enzyme (ACE) expression from the endogenous promoter to the mouse c-fms promoter. The result is an animal model called ACE 10/10 in which ACE is overexpressed by monocytes, macrophages, and other myelomonocytic lineage cells. To study the immune response of these mice to bacterial infection, we challenged them with Listeria monocytogenes or methicillin-resistant Staphylococcus aureus (MRSA). ACE 10/10 mice have a significantly enhanced immune response to both bacteria in vivo and in vitro. For example, 5 days after Listeria infection, the spleen and liver of ACE 10/10 mice had 8.0- and 5.2-fold less bacteria than wild type mice (WT). In a model of MRSA skin infection, ACE 10/10 mice had 50-fold less bacteria than WT mice. Histologic examination showed a prominent infiltrate of ACE-positive mononuclear cells in the skin lesions from ACE 10/10. Increased bacterial resistance in ACE 10/10 is directly due to overexpression of ACE, as it is eliminated by an ACE inhibitor. Critical to increased immunity in ACE 10/10 is the overexpression of iNOS and reactive nitrogen intermediates, as inhibition of iNOS by the inhibitor 1400W eliminated all in vitro and in vivo differences in innate bacterial resistance between ACE 10/10 and WT mice. Increased resistance to MRSA was transferable by bone marrow transplantation. The overexpression of ACE and iNOS by myelomonocytic cells substantially boosts innate immunity and may represent a new means to address serious bacterial infections.
Keywords: Bacteria, Immunology, Innate Immunity, Macrophage, Nitric-oxide Synthase, Angiotensin Converting Enzyme, Bacterial Infection, Mrsa
Introduction
The classical renin-angiotensin system (RAS)2 is a complex cascade of enzymes and peptides associated with the regulation of blood pressure (1). RAS regulates production of the vasoconstrictor angiotensin II from angiotensinogen via sequential catalysis by renin and angiotensin-converting enzyme (ACE). Although renin is precise in substrate specificity, ACE is a somewhat promiscuous peptidase that cleaves angiotensin I, substance P, AcSDKP, β-endorphins, and several other physiologic peptides. Because ACE has a variety of substrates, it may affect several physiologic and pathologic processes such as hematopoiesis, fertility, atherosclerosis, multiple sclerosis, and inflammation (2–5).
Several groups have presented evidence highlighting diverse roles for ACE and RAS in the immune response, including production of reactive oxygen species by angiotensin II (6–8). Recently, Platten et al. (9) showed that RAS plays a major role in autoimmunity, as indicated by their analysis of multiple sclerosis and experimental autoimmune encephalitis. Studies have also found a role for RAS in the recruitment of inflammatory cells into tissues through the regulation of adhesion molecules and chemokines by resident inflammatory cells (7). ACE regulates bradykinin, which is critical for dendritic cell maturation and TH1 cell development during Trypanosoma cruzi infection (10). Clinically, ACE is a useful marker for several cytokine-mediated inflammatory diseases (11).
Our group has recently described a mouse model called ACE 10/10 in which gene targeting in ES cells was used to substitute control of ACE expression from the endogenous promoter to the mouse c-fms promoter (12). The result is an animal model in which ACE is overexpressed by monocytes, macrophages, and other myelomonocytic lineage cells. These mice demonstrated a robust immunological response when challenged with mouse models of melanoma and lymphoma. Specifically, ACE 10/10 mice resisted tumor growth far better than WT mice. This was correlated with increased numbers of anti-tumor CD8+ T cells. Furthermore, when compared with WT cells, ACE 10/10 macrophages showed an increased proinflammatory phenotype, characterized by increased infiltration of the tumors, increased production of proinflammatory cytokines, and superior processing of tumor antigens (13). Although this phenotype was eliminated by ACE inhibitors, the production of angiotensin II was probably not crucial in tumor resistance. Rather, ACE overexpression in myelomonocytic cells seemed to trigger a more profound immune response in which the animals responded more vigorously than WT mice to immunologic challenge.
Although the finding that ACE 10/10 mice resist the growth of tumors better than WT mice is exciting, tumor growth models in mice are somewhat artificial. This led us to ask whether the enhanced immune response observed in ACE 10/10 mice would also be present when these animals were exposed to two models of bacterial infection: Listeria monocytogenes (Listeria), a Gram-positive rod-shaped bacterium that is a much studied intracellular pathogen, and methicillin-resistant Staphylococcus aureus (MRSA), an aggressive extracellular micro-organism that is increasing in prevalence and incidence (14, 15). The spread of community-associated MRSA is an important public health concern because these bacteria can be particularly virulent. Here, we report that ACE 10/10 mice have a substantially enhanced innate immune response to both these organisms in vivo and in vitro, and this is associated with overexpression of iNOS. Our data show that the manipulation of ACE in myelomonocytic cells markedly increases the immune response, not only to mouse models of tumor, but to aggressive forms of bacterial infection.
EXPERIMENTAL PROCEDURES
Ethics
All experimental procedures were preapproved by the Cedars-Sinai Institutional Animal Care & Use Committee and were performed according to the guidelines of the Cedars-Sinai Division of Comparative Medicine and the Cedars-Sinai Institutional Animal Care & Use Committee.
Materials
LPS (Escherichia coli 055:B5) was from Sigma-Aldrich. Murine IL-6, IFN-γ, TNF-α, and IL-12/p40 ELISA kits were purchased from eBioscience (San Diego, CA). Griess assay reagents were from Promega (Madison, WI). ACE activity was measured using the ACE-REA kit from American Laboratory Products Company, Ltd. (ALPCO, Windham, NH) as described previously (16).
Mice
ACE 10/10 mice have been described previously (12). These mice were back-crossed at least 10 generations to C57BL/6 mice (The Jackson Laboratory, Bar Harbor, ME). All mice were maintained in microisolator cages.
Bacterial Infection
L. monocytogenes strain EGD was a gift from Dr. Rafi Ahmed (Emory University). Bacteria were propagated overnight on brain heart infusions. This was then diluted 1:100 in fresh medium and incubated at 37 °C with shaking at 250 rpm until an A540 of ∼2.5. The bacteria were then washed in PBS and stored in PBS with 30% glycerol at −80 °C at a concentration of 1 × 10⁸/ml. For each experiment, a fresh vial was thawed, and bacteria were washed in PBS and diluted appropriately. Mice were injected intravenously with 100 μl of bacteria in PBS. Livers and spleens from infected mice were harvested at different time points after infection, and cfus were calculated by plating serial dilutions of tissue homogenates on brain heart infusion plates (Hardy Diagnostics, CA).
S. aureus USA 300, strain SF8300, was obtained from Dr. Binh Diep (University of California, San Diego). Bacteria were routinely cultured in Todd-Hewitt broth at 37 °C with shaking at 250 rpm. An overnight bacterial culture was diluted 1:1000 in pre-warmed media and incubated at 37 °C with shaking at 250 rpm until an A540 of ∼2.5. Bacteria were immediately pelleted by centrifugation at 4000 rpm for 10 min at 4 °C, washed twice with equal volume of PBS, and resuspended in PBS at a concentration of 2 × 10¹⁰ cfu/ml. This was mixed with an equal volume of PBS containing dextran microbead (Cytodex) suspension at 50 mg/100 ml. 100 μl of this suspension was injected subcutaneously into each flank of mice. Skin lesions were defined by darkened areas of necrosis, and lesion size was quantified over the course of 4 days by a protocol described previously (17). Briefly, the length and width of the lesion was multiplied, and irregularly shaped lesions were broken down into smaller symmetrical pieces and measured. On day four, mice were euthanized; skin lesion was measured, excised, weighed and homogenized in 1 ml of PBS for cfu determination by serial dilutions.
Inhibitors
ALZET osmotic minipumps (Cupertino, CA) were placed subcutaneously, following the manufacturer's instructions. ACE inhibitors ramipril (Roxane Laboratories) or lisinopril (Merck) were dosed at 16 mg/kg/day, losartan (LKT Laboratories) was dosed at 30 mg/kg/day, and hydralazine (Sigma) was administered at 40 mg/kg/day for 1 week in drinking water. Tail cuff blood pressure measurements were performed as described previously to verify effectiveness of the drugs in reducing blood pressure (16). The iNOS-specific inhibitor 1400W (Cayman Chemical) was administered at 50 μg/ml in drinking water. Treatment was initiated on the day of infection and maintained until the termination of the experiment.
Bone Marrow Transplantation
Enhanced green fluorescent protein transgenic mice (TgN(β-act-EGFP)04Obs) (18), which have been back-bred at least 10 generations to a C57BL/6 background (Jackson Laboratory) were a gift from Dr. David Archer (Emory University). Homozygous ACE 10/10 mice expressing GFP (ACE 10/10-GFP) were obtained by a classical breeding scheme. For bone marrow transplantation, donor mice were 8-week-old ACE 10/10-GFP or littermate WT/WT-GFP; recipients were 8-week-old WT C57BL/6 that did not express GFP. Bone marrow was obtained from donor mice by flushing femurs and tibias with RPMI 1640 medium. Nucleated cells were counted, and the bone marrow was resuspended at a concentration of 2 × 10⁷/ml. Recipient mice were irradiated with 1100 radians and immediately reconstituted with either 2 × 10⁶ ACE 10/10-GFP or WT/WT-GFP bone marrow cells, as described previously (12). After 8 weeks, the recipient mice were analyzed by FACS for blood leukocyte expression of GFP, ACE, and CD45.
Macrophage Isolation and in Vitro Bacterial Infection
To collect thioglycollate elicited peritoneal macrophages (TPMs), 6–8-week-old mice were injected intraperitoneally with 2 ml of aged thioglycollate broth. Four days later, macrophages were harvested from the peritoneal cavity by lavaging with sterile Hank's phosphate-buffered saline. The cells were centrifuged at 400 × g for 10 min at 4 °C and resuspended in complete media: RPMI 1640 (Invitrogen) supplemented with 5% heat-inactivated fetal calf serum, 100 units/ml penicillin, and 100 μg/ml streptomycin (Mediatech). 105 macrophages were distributed into wells of 96-well plates. After 2 h of incubation at 37 °C, nonadherent cells were washed away, leaving wells with confluent adherent macrophages. After 18 h of culture in complete media with or without 10 ng/ml IFN-γ, cells were infected with 106 bacteria (multiplicity of infection of 10) in 100 μl of antibiotic-free media. After 1 h of phagocytosis, nonincorporated bacteria were removed by washing, and complete media was supplemented with 5 μg/ml gentamicin to kill any residual extracellular bacteria. In some experiments, macrophages were treated with 10 μm of the specific iNOS inhibitor 1400W at the time of the priming with IFN-γ. At different time points, cells were washed and then lysed with 0.01% Triton in PBS, and viable bacteria ascertained by dilution and plating on brain heart infusion plates.
Nitrite Accumulation
Nitrite anion production by macrophages was determined with Griess assay using the manufacturer's instructions (Promega). Briefly, macrophage monolayers were stimulated with 10 ng/ml IFN-γ for 18 h, and supernatants were harvested. In some experiments, the macrophage monolayers were stimulated with 10 ng/ml IFN-γ and then infected with L. monocytogenes at a multiplicity of 10 or 50 bacteria per cell. A total of 50 μl of culture supernatant was combined with an equal volume of Griess reagent, and the samples were incubated at room temperature for 10 min before quantifying the absorbance at 540 nm. The nitrite production was determined using a standard curve and normalized to total cell number in each sample.
Western Blotting
107 thioglycollate-elicited peritoneal macrophages were stimulated with 1 μg/ml LPS overnight. Cells were washed with ice-cold PBS and lysed in a buffer containing 10 mm HEPES-NaOH (pH 7.5), 150 mm NaCl, 1 mm EGTA, 1 mm Na3VO4, 10 mm NaF, 10 μg/ml aprotinin, 10 μg/ml leupeptin, 1 mm PMSF, and 1% Nonidet P-40 for 20 min. The lysates were centrifuged at 15,000 rpm for 20 min at 4 °C, and the supernatants were collected. After protein quantification using the Pierce protein assay, 40 mg of protein were separated by 8% SDS-PAGE and transferred onto nitrocellulose membranes. The blots were then washed in Tris-Tween-buffered saline (TTBS, 20 mm Tris-HCl buffer, pH 7.6, 137 mm NaCl, and 0.05% (v/v) Tween 20), and blocked overnight with 5% (w/v) nonfat dry milk solution in TTBS. Subsequently, the membrane was probed with a 1:600 dilution of polyclonal iNOS antibody (a kind gift of Dr David Harrison, Emory University) or a 1:1000 dilution of anti-arginase 1 antibody (BD Transduction) in 5% (w/v) nonfat milk in TTBS. The blot was revealed by enhanced chemiluminescence (GE Healthcare). The membranes were probed with β-actin (Cell Signaling, Danvers, MA) to verify loading.
Immunohistochemistry
Tissue was embedded in paraffin using standard techniques. 5-μm sections were cut and steamed for 30 min in buffer, pH 6.1 (Dako, catalog no. S1699). They were then stained in a Dako automated stainer with a 1:200 dilution of rabbit anti-ACE antibody (19). Secondary antibody (Dako, catalog no. K4003) and DAB chromogen (Dako, catalog no. 3468) were performed according to the manufacturer's instructions.
Statistics
All data are expressed as the arithmetic means ± S.E. Comparisons between two groups of animals or treatments were made by one-way ANOVA or Student's t test. Values of p < 0.05 were considered statistically significant.
RESULTS
Increased Resistance to L. monocytogenes Infection in ACE 10/10 Mice
We tested the response of ACE 10/10 mice to Listeria infection in vivo and in vitro. To test in vivo bacterial burden, WT and ACE 10/10 mice were injected i.v. with 4 × 10³ cfu of Listeria, strain EGD. The mice were sacrificed 3 or 5 days after infection, and bacterial counts were determined in spleen and liver. In both spleen and liver, the ACE 10/10 mice consistently had substantially fewer bacteria (Fig. 1A). At day 3 after infection, the bacteria burden in the spleen and liver of WT mice was 6.5- and 5.5-fold more than that of the equivalent ACE 10/10 tissues (n = at least 9, p < 0.01). At day 5, the spleen and liver of WT mice had an 8.0- and 5.2-fold greater bacterial load than those of the ACE 10/10 mice (n = at least 9; liver, p < 0.002; spleen, p < 0.003).
FIGURE 1.

In vivo challenge with L. monocytogenes. A, WT and ACE 10/10 (10/10) mice were inoculated i.v. with 4 × 10³ L. monocytogenes, strain EGD. Groups of mice were sacrificed 3 or 5 days after inoculation, and the number of cfu in the spleen and liver was determined. Values for individual WT (circles) and ACE 10/10 (triangles) mice are shown, as well as the group means and S.E. *, p < 0.05; **, p < 0.005; ***, p < 0.0005. ACE 10/10 have a significantly lower bacterial burden than WT. B, WT (gray bars) and ACE 10/10 (10, black bars) were implanted with an osmotic mini-pump and treated with either saline, the ACE inhibitor ramipril or the AT1 receptor antagonist losartan. After 7 days, the mice were challenged with 4 × 10³ Listeria i.v. Three days later, the number of bacteria in the spleen and in the liver was determined. Ramipril eliminated the difference between WT and ACE 10/10, whereas losartan had no significant effect (n = 6). C, WT and ACE 10/10 (10) were implanted with osmotic mini-pumps and treated with either ramipril or hydralazine. Mice then received 3 × 10⁴ Listeria i.v. Five days after inoculation, the bacterial counts in the spleen and liver were determined. Ramipril eliminated differences between ACE 10/10 and WT mice, but no such effect was found with hydralazine (n = 6). NS is not significant.
To understand the increased resistance to infection in ACE 10/10, we also tested additional groups of WT and ACE 10/10 mice that were treated with either the specific ACE inhibitor ramipril or the angiotensin II AT1 receptor antagonist losartan delivered via osmotic minipump. Three days after infection, mice were sacrificed, and bacterial burden was determined in the spleen and liver (Fig. 1B). These data showed that the treatment of ACE 10/10 mice with ramipril consistently eliminated significant differences between ACE 10/10 and WT, indicating that the catalytic activity of ACE is directly responsible for the reduced bacterial burden in ACE 10/10 mice. In contrast, treatment of mice with the AT1 antagonist did not alter the bacterial resistance noted in ACE 10/10 mice. For example, in spleen, ACE 10/10 and WT mice treated with losartan averaged 4.3 × 10⁴ and 3.0 × 10⁵ cfu, respectively (n = 6, p < 0.0005), which was essentially identical to the results in the absence of losartan.
Using a higher inoculum of Listeria (3 × 10⁴), similar differences were observed between ACE 10/10 and WT mice. Following a 5-day i.v. challenge, we recovered just less than a log lower colony count in both spleen and liver compared with WT (Fig. 1C). For example, in the spleen, ACE 10/10 averaged 9.3 × 10⁴ cfu, whereas WT averaged 7.4 × 10⁵ (n = 7, p < 0.003). Similar to the previous experiment, this effect was negated by addition of an ACE inhibitor, but nonspecific lowering of blood pressure by hydralazine, which works independently of RAS, had no such effect.
ACE 10/10 Macrophages Have Enhanced Listeriocidal Activity
Macrophages are a well characterized cell host for Listeria replication. To directly assess the ability of ACE 10/10 macrophages to kill Listeria, an in vitro killing assay was performed using TPMs, in the presence or absence of IFN-γ. Listeria was added at a multiplicity of infection of 10, and phagocytosis was allowed to proceed for 1 h. Nonincorporated bacteria were then removed, and the media was supplemented with gentamicin to kill residual extracellular bacteria. After further incubation such that the total time since first exposure to bacteria was 2 to 8 h, cfus were determined by standard methods. In the absence of IFN-γ priming, there was no significant difference between the ability of ACE 10/10 and WT macrophages to kill Listeria (Fig. 2, top two lines). ACE 10/10 macrophages express abundant surface ACE (13), and thus, these data demonstrated that ACE has no direct bactericidal effect (Fig. 2). Neither is there a difference in phagocytosis because flow cytometric analysis of engulfed FITC-labeled Listeria by IFN-γ primed TPMs from WT and ACE 10/10 was similar (supplemental Fig. S1). However, once primed with IFN-γ, there was substantially better killing of Listeria by the ACE 10/10 cells. The data are significant by 4 h (p < 0.005); by 8 h, ACE 10/10 macrophages have 11.6-fold less bacteria than WT macrophages (n = 8, p < 0.001). We also performed an identical experiment but now mice were treated with an ACE inhibitor for 1 week prior to isolating TPM. Macrophages were then treated with IFN-γ overnight in media also containing ACE inhibitor. ACE inhibition eliminated all differences in Listeria killing between ACE 10/10 and WT macrophages after 4 or 8 h of incubation (4 h, ACE 10/10 = 1.4 × 10⁵ CFU/105 macrophages; WT = 1.2 × 10⁵ CFU/105 macrophages; 8 h, ACE10/10 = 4.1 × 10⁴ CFU/105 macrophages; WT = 7.2 × 10⁴ CFU/105 macrophages; n = at least 5, p < 0.6). Thus, both in vivo and in vitro data show significantly better killing of Listeria in ACE 10/10 mice as compared with WT. This is dependent on the increased ACE activity in the ACE 10/10 model.
FIGURE 2.
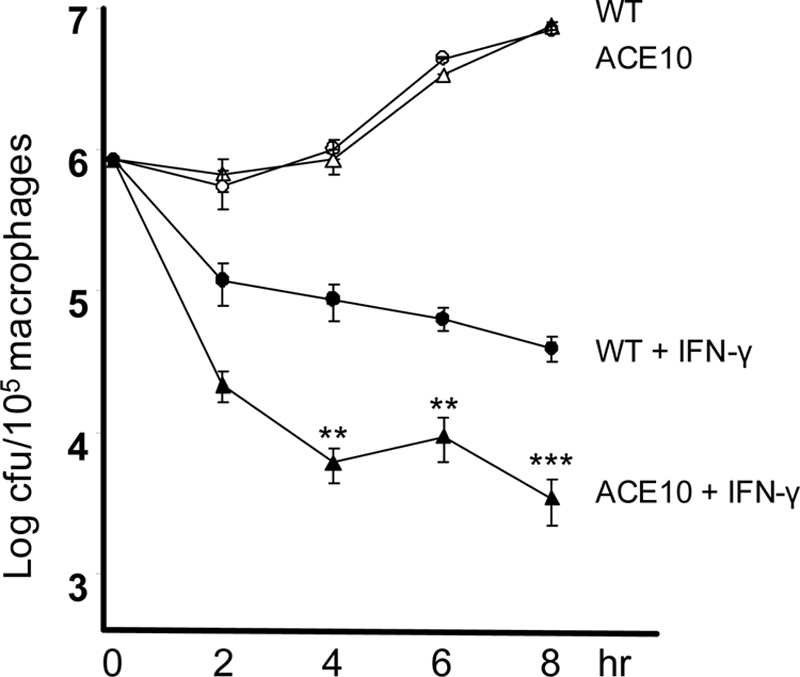
In vitro killing of Listeria by macrophages. TPMs were cultured overnight with either IFN-γ (filled triangle, ACE 10/10; filled circle, WT) or without IFN-γ priming (open triangle, ACE 10/10; open circle, WT). At time 0, cells were infected with Listeria at a multiplicity of 10 for 1 h. Then, after washing, medium containing gentamicin was added to kill the remaining extracellular bacteria. After further incubation, such that the total time since first exposure to bacteria was 2 to 8 h, the antibiotic was removed, the cells were lysed, and cfus were determined. In the presence of IFN-γ priming, there is substantially better killing of Listeria by ACE 10/10 macrophages than by WT cells (n = 8 mice). **, p < 0.005; ***, p < 0.001.
Increased Nitrite Production Is Essential to ACE 10/10 Phenotype
Substantial previous work has demonstrated that the killing of Listeria is dependent upon the generation of reactive oxygen species by NADPH oxidase (Nox2) and by the generation of reactive nitrogen intermediaries, predominantly nitric oxide (NO) by inducible nitric oxide synthase (iNOS) (20). Our group has investigated each of these systems in ACE 10/10 mice.
To study burst reactive oxygen species generation, TPM from ACE 10/10 and WT mice were isolated and cultured overnight with or without 10 ng/ml of IFN-γ. Listeria was then added, and reactive oxygen species were quantified over 80 min using a standard luminescence assay (21). Although more than 10 mice per group were examined, there was no consistent difference between ACE 10/10 and WT mice. Representative data are shown in supplemental Fig. 2.
To investigate the role of nitrites, TPM were isolated and then primed overnight with or without 10 ng/ml IFN-γ. Some groups of cells were also exposed to Listeria at an multiplicity of infection of either 10 or 50 (Fig. 3A). In the absence of IFN-γ priming, there was no difference in nitrite production between macrophages from ACE 10/10 or WT. In contrast, TPM from ACE 10/10 consistently showed a 2.2- to 2.9-fold increased production of nitrite, as compared with identically treated cells from WT mice. Even in the absence of stimulation with Listeria, IFN-γ primed cells from ACE 10/10 made 2.4-fold more nitrite than WT cells (ACE 10/10, 16.3 μm; WT, 6.8 μm; n = 6, p < 0.005).
FIGURE 3.

Macrophage production of nitrites and iNOS. A, TPMs from WT (light gray) or ACE 10/10 (black) mice were cultured overnight with or without IFN-γ. After 18 h, groups of cells were treated with Listeria at a multiplicity of either 10 or 50. Separate groups of cells were left untreated. Four hours later, the culture supernatant was collected, and nitrite levels were measured. In the absence of IFN-γ priming, there was no significant difference in nitrite levels between cells from WT and ACE 10/10. However, with IFN-γ treatment, ACE 10/10 macrophages made from 2.2- to 2.9-fold more nitrites than identically treated cells from WT mice (n = 6, p < 0.005 for all groups of IFN-γ-treated cells comparing ACE 10/10 with WT). B, TPMs from WT and ACE 10/10 (10) were cultured for 18 h with or without 1 μg/ml of LPS. Cell lysates were then probed for iNOS, arginase I, and β-actin by Western blot. C, densitometry was used to quantitate the average density ratio of iNOS relative to the expression of β-actin. There is increased expression of iNOS by ACE 10/10 macrophages (n = 5). *, p < 0.05. D, WT (gray bars) and ACE 10/10 (black bars) mice were treated with lisinopril for 7 days. TPMs from these mice and from untreated mice were then stimulated with either LPS or IFN-γ for 18 h. Nitrite accumulation in the supernatant was then determined by Griess assay. ACE inhibition abrogates the elevated nitrite production by ACE 10/10 macrophages (n = 5 mice per group with or without inhibitor). *, p = 0.05; **, p < 0.01. ns is not significant.
Macrophages make NO via the up-regulation of iNOS (22). To evaluate this, TPMs were cultured for 18 h in the presence of lipopolysaccharide (1 μg/ml). Culture supernatants were removed, and cell lysates were analyzed for iNOS expression by Western blot analysis (Fig. 3B). Samples were also probed for l-arginase expression, as this competes with iNOS for arginine. To control for loading, samples were probed for β-actin levels, and after band density analysis, iNOS levels were normalized for the levels of the housekeeping gene (Fig. 3C). This study showed a 2-fold increase in iNOS protein expression in macrophages from ACE 10/10 mice as compared with WT (ACE 10/10, 0.95 ± 0.2; WT, 0.47 ± 0.14; n = 5 mice, p < 0.005). In contrast, we saw no difference in l-arginase expression between the two groups.
We showed that the increased in vivo resistance of ACE 10/10 mice to Listeria is eliminated by treatment with an ACE inhibitor. If, in fact, increased bacterial killing is also due to increased activity of iNOS, then ACE inhibitor treatment should be associated with reduced nitrite production. To study this, WT and ACE 10/10 mice were treated with the ACE inhibitor lisinopril for 1 week. TPMs were then collected, primed with LPS or IFN-γ, and assessed for nitrite production. Indeed, treatment of the mice with lisinopril resulted in a marked diminution of nitrite levels in the ACE 10/10 cells such that there was no significant difference in nitrite production between IFN-γ- or LPS-stimulated WT and ACE 10/10 cells (Fig. 3D).
Given both the increased production of iNOS and nitrites by ACE 10/10 cells, we directly investigated the role of iNOS in the killing of Listeria by performing an in vitro killing assay (Fig. 4A). TPMs were incubated overnight with or without IFN-γ. In this experiment, we also included groups of IFN-γ primed macrophages that were incubated with the compound 1400W, a specific inhibitor of iNOS (23). Although 1400W had virtually no effect on WT cells, there was a marked effect on cells from ACE 10/10 mice; in the presence of 1400W, these cells killed Listeria equivalent to either WT cells with or without 1400W. The combination of data showing enhanced in vitro production of nitrites by ACE 10/10 cells, and the effects of the iNOS inhibitor 1400W in eliminating in vitro differences in killing between ACE 10/10 and WT, implies that a critical part of the enhanced immune response observed in ACE 10/10 mice is IFN-γ-stimulated production of iNOS.
FIGURE 4.

In vitro and in vivo killing of Listeria is inhibited by the iNOS inhibitor 1400W. A, TPMs from ACE 10/10 (triangles) or WT (circles) mice were cultured overnight. Some cells were cultured with IFN-γ or the combination of IFN-γ plus 1400W, as indicated in the figure. After 18 h, cells were mixed with Listeria at a multiplicity of 10 for 1 h. After washing, media containing gentamicin was added to kill the remaining extracellular bacteria. At the indicated times after the first addition of Listeria, gentamicin was removed, the cells were lysed, and cfus were determined. Although inhibition of iNOS has no significant effect on the WT cells, treatment of ACE 10/10 cells renders these cells equivalent to WT in the killing of Listeria (n = 5 mice). ACE 10/10:IFN-γ + 1400W versus WT:IFN-γ + 1400W, p > 0.4 at all time points). B, WT (gray bars) and ACE 10/10 mice (10, black bars) were inoculated i.v. with 3 × 10⁴ Listeria. On the day of infection, some mice were treated with the iNOS inhibitor 1400W in the drinking water. The mice were sacrificed on day 5, and the bacterial burden in the spleen and liver was determined. Inhibition of iNOS with 1400W increased the bacterial burden in all groups. In the presence of 1400W, the difference between WT and ACE 10/10 mice was eliminated (n = 6). *, p < 0.05; **, p < 0.005. NS is not significant.
To investigate the role of iNOS in vivo, WT and ACE 10/10 mice were inoculated i.v. with 3 × 10⁴ cfu of Listeria, strain EGD. Beginning on the day of infection, a group of mice were treated with water containing 50 μg/ml 1400W and were maintained on the drug throughout the duration of the experiment (Fig. 4B). Five days after infection, mice were sacrificed, and the burden of Listeria in the spleen and liver was determined. In the absence of the iNOS inhibitor, ACE 10/10 mice showed significantly less bacteria in the spleen and liver, similar to data presented in Fig. 1. With the administration of the iNOS inhibitor, all groups of mice showed a significant increase in the burden of Listeria. This is consistent with published data showing an important role for iNOS in the control of Listeria infection (20, 24). In addition, the administration of 1400W to ACE 10/10 mice rendered these mice functionally equivalent to WT in that there was no longer any significant difference in bacterial burden.
ACE 10/10 Mice Demonstrate Increased Immunity to MRSA
Although Listeria is a traditional model for understanding the innate immune response to bacteria, we also wanted to study the response of ACE 10/10 mice to the challenging clinical problem of MRSA. Utilizing a necrotizing fasciitis model, ACE 10/10 and WT mice were inoculated subcutaneously with 1 × 10⁹ CFU MRSA USA 300, strain SF8300 (25, 26). On days 2, 3, and 4 after bacterial inoculation, the size of the indurated and inflamed skin lesion was measured (Fig. 5, A and B). ACE 10/10 mice developed substantially smaller lesions compared with WT mice. At 4 days, WT mice had an average lesion of 60 mm2, whereas ACE 10/10 averaged only 13 mm2 (n = 8, p < 0.005). The mice were sacrificed on day 4, the lesional skin was excised, and the bacterial load of S. aureus was determined by serial dilution. Data from four separate experiments showed that there was a marked difference in the skin burden of bacteria (Fig. 5C). Whereas WT mice averaged 6.2 × 10⁷ cfu, ACE 10/10 animals had only 1.2 × 10⁶ (n = at least 14, p < 0.001).
FIGURE 5.

Skin infection with MRSA. Mice were infected subcutaneously with 1 × 10⁹ MRSA, clone USA 300, in the hind flanks. A, a representative comparison of skin lesions present in ACE 10/10 and WT mice 4 days after MRSA infection. B, lesion size of WT (circles) and ACE 10/10 (10, triangles) were measured on days 2, 3, and 4 after infection (n ≥ 14 mice per group). **, p < 0.005; ***, p < 0.0005. C, four days after skin infection, WT (circles) and ACE10/10 (triangles) were sacrificed, and bacterial counts in the lesion were determined. ACE 10/10 mice averaged >50-fold less bacteria within lesions (n ≥ 14, p < 0.001). These differences were eliminated when mice were treated with either the ACE inhibitor lisinopril or the iNOS inhibitor 1400W.
To determine whether the increased resistance of ACE 10/10 mice to MRSA was dependent upon ACE catalytic activity, mice were treated with an ACE inhibitor for 1 week before inoculation of bacteria. The mice were then infected with MRSA and sacrificed on day 4, and the skin bacterial burden determined (Fig. 5C). Similar to what we saw with Listeria, inhibition of ACE activity rendered the ACE 10/10 mice as sensitive to MRSA as WT.
Previously, we showed that the enhanced resistance of ACE 10/10 mice to Listeria was very dependent on the functional activity of iNOS. To investigate whether this was true for resistance to MRSA, groups of WT and ACE 10/10 mice were treated with the iNOS inhibitor 1400W during the course of infection with S. aureus (Fig. 5C). Treatment of ACE 10/10 mice with 1400W increased their bacterial burden and eliminated any differences seen between these mice and similarly treated WT mice (WT, 2.8 × 10⁸; ACE 10/10, 1.45 × 10⁸, n = 6, p = 0.16).
Four days after infecting mice with MRSA, skin lesions from both WT and ACE 10/10 mice were histologically examined. As anticipated, WT mice showed skin ulceration with a marked neutrophilic infiltrate and abscess formation (Fig. 6A). Occasional clumps of bacteria were observed. There was also extension of the lesion into the underlying muscle with focal muscle necrosis. ACE 10/10 mice also showed a neutrophilic infiltrate with abscess formation. Distinguishing the lesion in the ACE 10/10 was the increased presence of mononuclear cells, particularly at the periphery of the necrosis. A particularly marked example of this is shown in Fig. 6, B–D, where a central region of necrosis is surrounded by a cuff of mononuclear cells. These cells were positive for ACE expression by immunohistochemical straining with an anti-ACE antibody.
FIGURE 6.

Histology of skin after MRSA infection. Four days after subcutaneous infection with MRSA, mice were sacrificed, and histologic sections of the lesions were prepared. A, WT mice show extensive acute inflammation within the superficial and deep dermis. There is abundant polymorphonuclear leukocytes with karyorrhexis, tissue necrosis, and pus formation. Occasional masses of bacteria are present (arrow). B, ACE 10/10 mice also had areas of necrosis and pus formation. However, at the periphery of the necrosis, there was a mononuclear cell infiltrate. Pictured in B is a marked example where a central region of necrosis (indicated by an asterisk) is surrounded by a cuff of mononuclear cells (indicated by arrows). C, a higher power of the mononuclear infiltrate (arrows) is shown. D, immunohistochemical staining of the tissue sections with an anti-ACE antibody showed that these cells were positive for ACE expression.
If the enhanced resistance of ACE 10/10 mice is due to their altered myelomonocytic cells, then this should be transferable by bone marrow transplantation. Thus, we lethally irradiated WT C57BL/6 mice and then immediately transplanted bone marrow from either ACE 10/10 or littermate WT mice following a previously published protocol (12). Donor mice were on a C57BL/6 background and also carried a transgene for GFP expression. After 8 weeks, successful bone marrow engraftment was verified by FACS analysis of GFP expression. Mice were then challenged with a subcutaneous dose of 4 × 10⁸ MRSA. Four days after infection, the mice were sacrificed, and the number of bacteria within the skin was determined (Fig. 7). These data show that WT mice, transplanted with bone marrow from ACE 10/10 mice, have a significantly better ability to resist MRSA growth than WT mice transplanted with WT bone marrow (WT, 1.5 × 10⁷; ACE 10/10, 2.4 × 10⁶, n = 5, p < 0.05).
FIGURE 7.
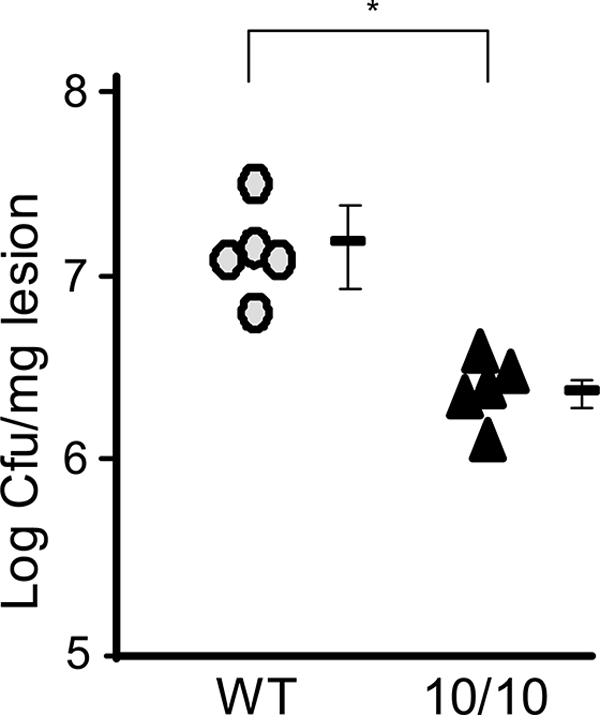
Transplantation of ACE10/10 bone marrow into WT mice confers increased resistance to MRSA. Recipient C57BL/6 mice were lethally irradiated and then immediately transplanted with bone marrow from either ACE 10/10 (10/10) or littermate WT mice. After engraftment, the mice were challenged subcutaneously with 1 × 10⁹ MRSA. Four days later, mice were sacrificed, and bacterial burden in the skin lesion was determined. WT mice receiving bone marrow from ACE 10/10 mice (triangles) showed a significantly reduced bacteria burden in the skin lesion, compared with WT mice receiving WT bone marrow (circles) (n = 5). *, p < 0.05.
DISCUSSION
In the ACE 10/10 model, the endogenous ACE promoter has been supplanted such that the control of ACE gene expression is now regulated by the c-fms promoter. The result is that tissues that normally express c-fms, such as monocytes, macrophages, and other myelomonocytic cells now overexpress ACE. Phenotypically, ACE 10/10 mice have a normal basal blood pressure. As was found in several different models, the expression of any appreciable quantity of ACE, irrespective of tissue location, is sufficient to allow homeostatic regulation of the renin-angiotensin system with resulting normal blood pressure (27). Thus, any phenotype identified in this model cannot be attributed to the many secondary effects of low or high blood pressure. ACE 10/10 mice resist growth of tumor models far better than WT mice, and this increased resistance is associated with changes in adaptive immunity, such as increased numbers of tumor specific CD8+ T cells. However, tumor models suffer from the intrinsic problem that such models in mice are somewhat artificial. These considerations led us to investigate how ACE 10/10 mice respond to infection with L. monocytogenes, a traditional model to study innate immunity, and with MRSA. Both models examined the behavior of the mice within only a few days of infection, during which the innate immune response plays a dominant role. With both infections, ACE 10/10 mice showed a significantly enhanced ability to resist bacterial growth. This was particularly so with resistance to skin infection with MRSA; not only was there 50-fold less bacteria in the lesions, but the reduction in the amount of tissue necrosis and abscess formation in ACE 10/10 mice is strong proof of the differences between these animals and WT.
Similar to what was found with tumor resistance, the inhibition of ACE enzymatic activity eliminated the enhanced immune response of the ACE 10/10 mice to bacterial infection. Thus, the catalytic activity of ACE, and not just the expression of ACE protein, is the critical feature explaining the enhanced innate response to bacteria. Furthermore, the in vitro killing data presented indicates that ACE catalytic activity is not what is directly killing bacteria. Rather, in vitro, macrophages need to be primed by IFN-γ to observe the ACE 10/10 effect. Most likely, such priming also occurs in vivo as part of the infectious process. We previously demonstrated that ACE is catalytically active and able to cleave peptides within the endoplasmic reticulum compartment of ACE 10/10 macrophages (13). Thus, it is unclear whether it is ACE action here or whether the ACE present on the cell surface creates a unique local environment that is critical for explaining the enhanced response of the ACE 10/10 mice. However, we presume that it is the enhanced production or degradation of one or even several peptides that is the ultimate explanation for the differences between ACE 10/10 and WT mice. Angiotensin II, though, does not appear to be a critical factor in the ACE 10/10 model. This is strongly suggested by our finding that an AT1 receptor antagonist had no apparent effect on resistance to Listeria. Although we did not study a genetic model in which the production of angiotensin II was impossible due to a genetic change, these experiments were performed in the study of tumor resistance and confirmed the lack of apparent involvement of angiotensin II (12).
In considering mechanisms for how ACE may enhance immunity, several studies have shown that host peptidases can participate in antibacterial defense mechanisms. For example, macrophage-derived metallopeptidase MMP12 has recently been identified as having antimicrobial effects (28). This may be because bacteria, and in particular MRSA, secrete a wide variety of pathogenic peptides, including phenol soluble modulins, leukocidins, cytolysins, and complement inhibitors (29–31). Conceivably, ACE may cleave these or other pathogenic peptides as part of its mode of action.
Previous analysis established that two of the major mechanisms responsible for innate immunity to bacteria are the generation of reactive oxygen intermediates, as a result of NADPH oxidase activation, and the generation of reactive nitrogen intermediates as a result of iNOS expression and activity (20, 32, 33). We found no consistent difference in reactive oxygen intermediates generation between ACE 10/10 macrophages and WT. In contrast, several lines of data showed significant differences in reactive nitrogen intermediate generation between ACE 10/10 and WT mice, suggesting that this plays a major role in the increased immune response of the ACE 10/10 model. These include the increased nitrite and iNOS protein synthesized in response to LPS, the increase in nitrite production in response to IFN-γ priming and perhaps most importantly, the finding that the specific iNOS inhibitor 1400W eliminates all differences in bacterial killing between ACE 10/10 and WT.
Richardson et al. (34) have discussed that NO is a proinflammatory molecule critical for clearance of a wide variety of pathogens including viral, fungal, bacterial, and parasitic microorganisms. It is an important effector of host innate immunity because of its immunomodulatory roles as well as its direct antimicrobial activity. NO can also be oxidized into potent nitrogen species, such as peroxynitrite, which have bacteriostatic or bacteriocidal effects (35–37). Mice deficient in iNOS show increased susceptibility to L. monocytogenes (20, 38). iNOS deficiency is also associated with increased mortality from S. aureus infection (39, 40). However, the biology of NO is complicated. S. aureus species can actually generate NO with an inducible NO synthase gene. This appears to have an antioxidant function (41). Other studies suggest that the aggressiveness of MRSA is partly due to the ability to neutralize host NO generation via several inducible genes that increase the efficiency of MRSA to detoxify nitrites (34, 42). Here, our studies are different in emphasis in that we show that, not only does NO play a role in host defenses under natural circumstances, but that the overexpression of ACE further augments iNOS and nitrite expression by myelomonocytic cells and that this improves the immune response to MRSA.
Recently, others have stressed (43–45) the phenotypic behaviors of different subgroups of activated macrophages. Specifically, “classically activated macrophages” have been implicated to have antibacterial and anti-tumor properties, whereas “alternatively activated macrophages” are postulated to promote tumor growth and suppress the extent of inflammation. We previously published that the overexpression of ACE in the ACE 10/10 model appears to tilt macrophage toward a classically activated phenotype. Our data here are consistent with this idea in that iNOS expression is one of the phenotypes of a classically activated macrophage. Further work will be necessary to investigate precisely how many of the phenotypic differences in ACE 10/10 mice can be explained as secondary to iNOS induction. Thus, our data support a central role of iNOS in bacterial resistance; whether iNOS plays a similar central role in other immune changes found in the ACE 10/10 mouse, such as resistance to tumor and adaptive immunity, remain to be explored.
Chambers and DeLeo (14) have recently described the history of antibiotic resistance in S. aureus as a series of waves beginning in the 1940s with penicillin-resistant S. aureus in hospitals. The introduction of methicillin and the 1961 report of S. aureus-resistant strains, marked the second wave. By the late 1970s, new strains of MRSA became endemic, but were usually found in immunocompromised patients or in a hospital setting. In 1997, the emergence of new aggressive strains marked a new wave of infection that has continued to increase in incidence (46), infecting healthy adults and sensitive to very few antibiotics (31, 47). Given the history of MRSA evolution, the implication for the future is that new approaches are needed to address MRSA and other forms of aggressive infection. Several groups have published attempts to regulate iNOS expression as a means of enhancing resistance to bacteria. In particular, the use of microspheres containing iNOS has been investigated as a therapeutic approach to decrease subcutaneous abscess area, reduce bacterial burden in lesions, and induce cytokine expression by the host in the face of S. aureus infection (48, 49). Our work lends credence to the idea that ACE manipulation is a potential new approach to increase innate resistance in the face of a serious bacterial infection.
Supplementary Material
Acknowledgments
We thank Drs. Rafi Ahmed, Ifor William, and David Archer (Emory University, Atlanta, GA) for reagents and advice. We also thank Fai Chung for help with immunohistochemistry and Dr. Xu Chen for help with mouse husbandry.
The work was supported, in whole or in part, by National Institutes of Health Grants R01 K039777 (to K. E. B.), R01 DK051445 (to K. E. B.), R01 AI074832 (to G. Y. L.), and R00 HL088000 (to S. F.).

The on-line version of this article (available at http://www.jbc.org) contains supplemental Figs. 1 and 2.
- RAS
- renin angiotensin system
- ACE
- angiotensin-converting enzyme
- TPM
- thioglycollate-elicited peritoneal macrophage
- MRSA
- methicillin resistant S. aureus
- iNOS
- inducible NO synthase
- Ac
- acetyl.
REFERENCES
- 1.Corvol P., Williams T. A., Soubrier F. (1995) Methods Enzymol. 248, 283–305 [DOI] [PubMed] [Google Scholar]
- 2.Bernstein K. E., Xiao H. D., Frenzel K., Li P., Shen X. Z., Adams J. W., Fuchs S. (2005) Circ. Res. 96, 1135–1144 [DOI] [PubMed] [Google Scholar]
- 3.Leehey D. J., Singh A. K., Alavi N., Singh R. (2000) Kidney Int. Suppl. 77, S93–S98 [DOI] [PubMed] [Google Scholar]
- 4.Metzger R., Bohle R. M., Chumachenko P., Danilov S. M., Franke F. E. (2000) Atherosclerosis 150, 21–31 [DOI] [PubMed] [Google Scholar]
- 5.Stegbauer J., Lee D. H., Seubert S., Ellrichmann G., Manzel A., Kvakan H., Muller D. N., Gaupp S., Rump L. C., Gold R., Linker R. A. (2009) Proc. Natl. Acad. Sci. U.S.A. 106, 14942–14947 [DOI] [PMC free article] [PubMed] [Google Scholar]
- 6.Hoch N. E., Guzik T. J., Chen W., Deans T., Maalouf S. A., Gratze P., Weyand C., Harrison D. G. (2009) Am. J. Physiol. Regul. Integr. Comp. Physiol. 296, R208–216 [DOI] [PMC free article] [PubMed] [Google Scholar]
- 7.Ruiz-Ortega M., Bustos C., Hernández-Presa M. A., Lorenzo O., Plaza J. J., Egido J. (1998) J. Immunol. 161, 430–439 [PubMed] [Google Scholar]
- 8.Brown D. I., Griendling K. K. (2009) Free Radic. Biol. Med. 47, 1239–1253 [DOI] [PMC free article] [PubMed] [Google Scholar]
- 9.Platten M., Youssef S., Hur E. M., Ho P. P., Han M. H., Lanz T. V., Phillips L. K., Goldstein M. J., Bhat R., Raine C. S., Sobel R. A., Steinman L. (2009) Proc. Natl. Acad. Sci. U.S.A. 106, 14948–14953 [DOI] [PMC free article] [PubMed] [Google Scholar]
- 10.Scharfstein J., Monteiro A. C., Schmitz V., Svensjö E. (2008) Biol. Chem. 389, 1015–1024 [DOI] [PubMed] [Google Scholar]
- 11.Montecucco F., Pende A., Mach F. (2009) Mediators Inflamm. 2009, 752406. [DOI] [PMC free article] [PubMed] [Google Scholar]
- 12.Shen X. Z., Li P., Weiss D., Fuchs S., Xiao H. D., Adams J. A., Williams I. R., Capecchi M. R., Taylor W. R., Bernstein K. E. (2007) Am. J. Pathol. 170, 2122–2134 [DOI] [PMC free article] [PubMed] [Google Scholar]
- 13.Shen X. Z., Lukacher A. E., Billet S., Williams I. R., Bernstein K. E. (2008) J. Biol. Chem. 283, 9957–9965 [DOI] [PMC free article] [PubMed] [Google Scholar]
- 14.Chambers H. F., Deleo F. R. (2009) Nat. Rev. Microbiol. 7, 629–641 [DOI] [PMC free article] [PubMed] [Google Scholar]
- 15.Zenewicz L. A., Shen H. (2007) Microbes Infect. 9, 1208–1215 [DOI] [PMC free article] [PubMed] [Google Scholar]
- 16.Cole J., Quach D. L., Sundaram K., Corvol P., Capecchi M. R., Bernstein K. E. (2002) Circ. Res. 90, 87–92 [DOI] [PubMed] [Google Scholar]
- 17.Tseng C. W., Kyme P., Low J., Rocha M. A., Alsabeh R., Miller L. G., Otto M., Arditi M., Diep B. A., Nizet V., Doherty T. M., Beenhouwer D. O., Liu G. Y. (2009) PLoS One 4, e6387. [DOI] [PMC free article] [PubMed] [Google Scholar]
- 18.Okabe M., Ikawa M., Kominami K., Nakanishi T., Nishimune Y. (1997) FEBS Lett. 407, 313–319 [DOI] [PubMed] [Google Scholar]
- 19.Langford K. G., Shai S. Y., Howard T. E., Kovac M. J., Overbeek P. A., Bernstein K. E. (1991) J. Biol. Chem. 266, 15559–15562 [PubMed] [Google Scholar]
- 20.Shiloh M. U., MacMicking J. D., Nicholson S., Brause J. E., Potter S., Marino M., Fang F., Dinauer M., Nathan C. (1999) Immunity 10, 29–38 [DOI] [PubMed] [Google Scholar]
- 21.Dahlgren C., Karlsson A. (1999) J. Immunol. Methods 232, 3–14 [DOI] [PubMed] [Google Scholar]
- 22.MacMicking J., Xie Q. W., Nathan C. (1997) Annu. Rev. Immunol. 15, 323–350 [DOI] [PubMed] [Google Scholar]
- 23.Babu B. R., Griffith O. W. (1998) Curr. Opin. Chem. Biol. 2, 491–500 [DOI] [PubMed] [Google Scholar]
- 24.Nathan C., Shiloh M. U. (2000) Proc. Natl. Acad. Sci. U.S.A. 97, 8841–8848 [DOI] [PMC free article] [PubMed] [Google Scholar]
- 25.Diep B. A., Palazzolo-Ballance A. M., Tattevin P., Basuino L., Braughton K. R., Whitney A. R., Chen L., Kreiswirth B. N., Otto M., DeLeo F. R., Chambers H. F. (2008) PLoS One 3, e3198. [DOI] [PMC free article] [PubMed] [Google Scholar]
- 26.Tenover F. C., Goering R. V. (2009) J. Antimicrob. Chemother. 64, 441–446 [DOI] [PubMed] [Google Scholar]
- 27.Bernstein K. E. (2006) Hypertension 47, 509–514 [DOI] [PubMed] [Google Scholar]
- 28.Houghton A. M., Hartzell W. O., Robbins C. S., Gomis-Rüth F. X., Shapiro S. D. (2009) Nature 460, 637–641 [DOI] [PMC free article] [PubMed] [Google Scholar]
- 29.Foster T. J. (2005) Nat. Rev. Microbiol. 3, 948–958 [DOI] [PubMed] [Google Scholar]
- 30.Graves S. F., Kobayashi S. D., DeLeo F. R. (2010) J. Mol. Med. 88, 109–114 [DOI] [PMC free article] [PubMed] [Google Scholar]
- 31.Wang R., Braughton K. R., Kretschmer D., Bach T. H., Queck S. Y., Li M., Kennedy A. D., Dorward D. W., Klebanoff S. J., Peschel A., DeLeo F. R., Otto M. (2007) Nat. Med. 13, 1510–1514 [DOI] [PubMed] [Google Scholar]
- 32.Beckerman K. P., Rogers H. W., Corbett J. A., Schreiber R. D., McDaniel M. L., Unanue E. R. (1993) J. Immunol. 150, 888–895 [PubMed] [Google Scholar]
- 33.MacMicking J. D., Nathan C., Hom G., Chartrain N., Fletcher D. S., Trumbauer M., Stevens K., Xie Q. W., Sokol K., Hutchinson N., et al. (1995) Cell 81, 641–650 [DOI] [PubMed] [Google Scholar]
- 34.Richardson A. R., Dunman P. M., Fang F. C. (2006) Mol. Microbiol. 61, 927–939 [DOI] [PubMed] [Google Scholar]
- 35.Radi R., Beckman J. S., Bush K. M., Freeman B. A. (1991) Arch Biochem. Biophys. 288, 481–487 [DOI] [PubMed] [Google Scholar]
- 36.Wink D. A., Kasprzak K. S., Maragos C. M., Elespuru R. K., Misra M., Dunams T. M., Cebula T. A., Koch W. H., Andrews A. W., Allen J. S., et al. (1991) Science 254, 1001–1003 [DOI] [PubMed] [Google Scholar]
- 37.Wink D. A., Mitchell J. B. (1998) Free Radic. Biol. Med. 25, 434–456 [DOI] [PubMed] [Google Scholar]
- 38.Boockvar K. S., Granger D. L., Poston R. M., Maybodi M., Washington M. K., Hibbs J. B., Jr., Kurlander R. L. (1994) Infect Immun. 62, 1089–1100 [DOI] [PMC free article] [PubMed] [Google Scholar]
- 39.Sakiniene E., Bremell T., Tarkowski A. (1997) Clin. Exp. Immunol. 110, 370–377 [DOI] [PMC free article] [PubMed] [Google Scholar]
- 40.Sasaki S., Miura T., Nishikawa S., Yamada K., Hirasue M., Nakane A. (1998) Infect Immun. 66, 1017–1022 [DOI] [PMC free article] [PubMed] [Google Scholar]
- 41.Gusarov I., Shatalin K., Starodubtseva M., Nudler E. (2009) Science 325, 1380–1384 [DOI] [PMC free article] [PubMed] [Google Scholar]
- 42.Richardson A. R., Libby S. J., Fang F. C. (2008) Science 319, 1672–1676 [DOI] [PubMed] [Google Scholar]
- 43.Benoit M., Desnues B., Mege J. L. (2008) J. Immunol. 181, 3733–3739 [DOI] [PubMed] [Google Scholar]
- 44.Mantovani A., Sica A., Locati M. (2005) Immunity 23, 344–346 [DOI] [PubMed] [Google Scholar]
- 45.Porta C., Rimoldi M., Raes G., Brys L., Ghezzi P., Di Liberto D., Dieli F., Ghisletti S., Natoli G., De Baetselier P., Mantovani A., Sica A. (2009) Proc. Natl. Acad. Sci. U.S.A. 106, 14978–14983 [DOI] [PMC free article] [PubMed] [Google Scholar]
- 46. (1999) JAMA 282, 1123–1125 [PubMed] [Google Scholar]
- 47.Kobayashi S. D., DeLeo F. R. (2009) Curr. Opin. Pharmacol. 9, 545–551 [DOI] [PubMed] [Google Scholar]
- 48.Han G., Martinez L. R., Mihu M. R., Friedman A. J., Friedman J. M., Nosanchuk J. D. (2009) PLoS One 4, e7804. [DOI] [PMC free article] [PubMed] [Google Scholar]
- 49.Martinez L. R., Han G., Chacko M., Mihu M. R., Jacobson M., Gialanella P., Friedman A. J., Nosanchuk J. D., Friedman J. M. (2009) J. Invest. Dermatol. 129, 2463–2469 [DOI] [PubMed] [Google Scholar]
Associated Data
This section collects any data citations, data availability statements, or supplementary materials included in this article.