Abstract
The lignin content of biomass can impact the ease and cost of biomass processing. Lignin reduction through breeding and genetic modification therefore has potential to reduce costs in biomass-processing industries (e.g. pulp and paper, forage, and lignocellulosic ethanol). We investigated compositional changes in two low-lignin alfalfa (Medicago sativa) lines with antisense down-regulation of p-coumarate 3-hydroxylase (C3H) or hydroxycinnamoyl-CoA:shikimate hydroxycinnamoyltransferase (HCT). We investigated whether the difference in reactivity during lignification of 4-coumaryl alcohol (H) monomers versus the naturally dominant sinapyl alcohol and coniferyl alcohol lignin monomers alters the lignin structure. Sequential base extraction readily reduced the H monomer content of the transgenic lines, leaving a residual lignin greatly enriched in H subunits; the extraction profile highlighted the difference between the control and transgenic lines. Gel permeation chromatography of isolated ball-milled lignin indicated significant changes in the weight average molecular weight distribution of the control versus transgenic lines (CTR1a, 6000; C3H4a, 5500; C3H9a, 4000; and HCT30a, 4000).
Keywords: Cell Wall, NMR, Plant, Spectroscopy, Transgenic, C3H, HCT, Lignin, Molecular Weight
Introduction
The advent of large-scale liquid fuel production from biomass has served to highlight how difficult it is to commercially process biomass effectively and efficiently. Much of the difficulty is due to the recalcitrant nature of lignocelluloses (1), a complex interlinking structure composed of cellulose, hemicelluloses, and lignin that makes up the bulk of terrestrial biomass. Accessibility to the cell wall is influenced by lignin, which provides structural integrity to the cell wall. Both total lignin content and lignin monomer composition may impact the ease with which biomass is processed. This study examines whether lignin molecular weight is altered by changing the lignin monomer composition and if these changes affect the ease with which lignin can be removed by chemical processing.
Three monomers (Fig. 1), 4-coumaryl alcohol (H),2 coniferyl alcohol (G), and sinapyl alcohol (S), polymerize in what is thought to be a combinatorial fashion to form the bulk of the lignin polymer (2, 3). The amount of each unit depends on the species, age, cell type, and tissue type (4, 5). The presence of each additional methoxy group on a lignin unit results in one less reactive site (S < G < H) and therefore fewer possible combinations during the polymerization reaction. For example, the S unit has no vacant 5-position; therefore 5,5′-cross-linking is unavailable for lignin S subunits. As a result, lignin rich in S subunits is more easily depolymerized than lignin rich in G subunits.
FIGURE 1.
Structure labeling convention. A lignin carbon (left) is denoted by Hx, Gx, or Sx, where H (4-coumaryl), G (coniferyl), and S (sinapyl) denote the lignin subunit type and x denotes the position on the ring. A cellulose carbon (right) is denoted by Cx, where x denotes the position on the sugar ring.
The relative level of S and G lignin subunits is expressed as the S/G ratio, an important measurement used in the assessment of biomass. H lignin subunits are present in low levels in natural materials (4.9% of lignin in wild-type alfalfa (1) and 0.8% in Norway Spruce (6)); consequently, less is known about lignin high in H subunits and its impact on biomass processing.
In addition to the core H/G/S polymer, lignin includes a range of other structures commonly bonded to the main lignin structure through ether or ester linkages. Such modifications are especially frequent in herbaceous species and usually involve the addition of p-coumaric acid, ferulic acid, and occasionally sinapic acid. The modifications can take the form of cross-linking groups between lignin and carbohydrate (7–9) or pendant groups at the γ-position of the lignin interlinkage unit (10–13). A detailed review of these structures as they apply to herbaceous biomass can be found in Ref. 10.
In this work, transgenic lines of alfalfa (Medicago sativa) with antisense down-regulation of the expression of p-coumarate 3-hydroxylase (C3H) and hydroxycinnamoyl-CoA:shikimate hydroxycinnamoyltransferase (HCT) were used as models. Both C3H and HCT genes are involved in the production of S and G lignin monomers but not H monomers in the lignin biosynthetic pathway. Their down-regulation is therefore expected to reduce production of S and G monomers and to lead to an increased incorporation of H monomers in the lignin constructed by the plant (14, 15).
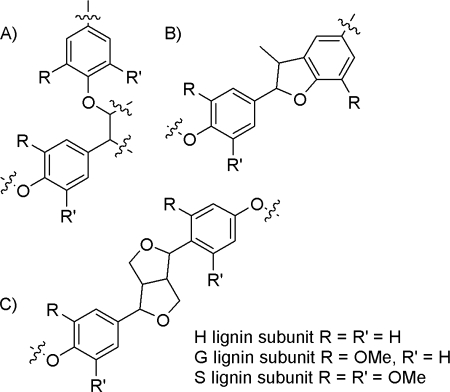
Ralph et al. (16) reported decreases in lignin content (70–76% of the control) and large increases in H monomer units (from 20 to 65 times depending on the analysis) with no change in S/G ratio in C3H-down-regulated alfalfa. Previous work on isolated lignin from the same alfalfa C3H and HCT lines used here has shown the lignin content to be lower than the control and the percentage of H units relative to S and G units to be greater than the controls (1, 16–19). Structurally, the lignin in alfalfa C3H and HCT transgenic lines has been shown to contain a greater proportion of phenylcoumaran- and resinol-type linkages, whereas aryl ether interunit linkages were less prevalent compared with the control (16, 20). Ralph et al. (16) also demonstrated that, in the C3H line, phenylcoumarans were formed almost solely from coupling reactions involving p-coumaryl alcohol, whereas coupling reaction in the control resulted from the combination of p-coumaryl, coniferyl, and sinapyl alcohols. These three most common interunit linkages are shown in Fig. 2.
FIGURE 2.
β-O4 (A) interunit linkages decrease in HCT and C3H alfalfa, whereas phenylcoumaran (B) and resinol (C) interunit linkages increase (16, 20).
Using the same plant materials, Chen and Dixon (1) showed that the decrease in lignin content was between 30 and 50% (dependent on analysis method and use of pretreatment). This decrease in lignin content after transformation was accompanied by 56 and 100% increases in enzymatic saccharification efficiency for acid-pretreated and non-pretreated samples, respectively. This highlights the significant positive influence that decreasing lignin content can have on the efficiency of saccharification of biomass.
To better understand the changes in lignin in these transgenic alfalfa lines, we utilized sequential extraction to chemically dissect the cell wall material. In sequential extraction, progressively more aggressive treatments are used to fractionate the biomass. In the case presented here, three extractions were used: MeOH extraction to remove non-structural cell wall components, 0.1 m NaOH (overnight, 4 °C) to remove highly labile cell wall-bound phenolics, and 2 m NaOH (10 min, 110 °C oil bath) to remove less labile cell wall-bound phenolics. We observed a higher removal of cell wall components under the base extraction conditions for the transgenic lines compared with the controls, indicating differences in the chemical and/or physical construction of the cell wall after transgenic modification of the lignin biosynthetic pathway. In addition, gel permeation chromatography (GPC) of isolated ball-milled lignin indicated smaller lignin in the transgenic lines.
EXPERIMENTAL PROCEDURES
Materials
Methanol (HPLC-grade), THF (HPLC-grade), glacial acetic acid (reagent-grade), and diethyl ether (anhydrous, reagent-grade) were from J. T. Baker (Phillipsburg, NJ). 1,4-Dioxane (anhydrous, 99.80%), 1,2-dichloroethane (≥99.8%, HPLC-grade), acetic anhydride (reagent-grade) and pyridine (anhydrous, ≥99.8%) were from Sigma. The generation of lignin-modified transgenic lines of M. sativa has been presented in detail previously (16, 19). The independent transgenic lines investigated were CTR1a, CTR49a, C3H4a, C3H9a, HCT3a, and HCT30a. CTR1a and CTR49a are empty vector controls used to account for potential changes to the cell wall chemistry due to the genetic transformation process itself. Two vegetatively propagated replicates of each independent line were used to account for potential variation in cell wall chemistry due to environmental effects. Mature stems were harvested (the first seven internodes from the top were discarded) for each line when the plants had reached the late flowering stage. Samples were dried at 55 °C. The compositional analyses of untreated whole stems discussed here have been published previously (21).
Methanol Extraction
Dried stem material (1.0-g batches) was weighed into 120-ml vials, and MeOH (50 ml) was added. The vials were capped and shaken at 5 °C overnight. A filtering crucible with a type A/D glass fiber filter was used to filter the solutions (the same arrangement was used in each step). The solids were washed with 50 ml of MeOH. The methanolic washes and filtrates were combined, collected, and dried. The solids were then washed with 50 ml of 18.2 megohms of water. The solid was freeze-dried and weighed, and the MeOH was evaporated and freeze-dried.
0.1 m NaOH Extraction
The above freeze-dried solids (0.7-g batches) were weighed into 120-ml vials, and 0.1 m NaOH (50 ml) was added. The vials were capped and shaken at 5 °C overnight and then filtered. The vials were washed six times with 5.0 ml of water, and the solid residue was washed four times with 5.0 ml of water. The washes and filtrates were collected. The crucible was washed with water until the flow-through was neutral (this second wash was not saved for use). The solid was freeze-dried and weighed, and the filtrate was neutralized with acidified AMBERLITE CG50 resin and stored at 4 °C.
2 mNaOH Extraction
Samples were split in two for reaction in the oil bath due to volume constraints. Two ASE vials were prepared with 0.2 g each of the 0.1 m NaOH-extracted residue and 25 ml each of 2 m NaOH. These were reacted simultaneously in a 110 °C oil bath for 10 min with stirring. Samples were cooled in a water bath at room temperature. The split samples were recombined and washed until the filtrate was neutral (∼200 ml). The filtrate was acidified to pH 2.0 with concentrated HCl. The solution was allowed to rest at 4 °C overnight before the precipitate was filtered off, freeze-dried, and weighed.
NMR
Solid-state NMR spectra were collected using high-resolution 13C cross-polarization/magic angle spinning (CP/MAS) with a Bruker Avance-200 MHz spectrometer (50.13 MHz, room temperature). The spinning speed was 7000 Hz, and a contact time of 2 ms with a 1-db ramp on the proton spin locking field was applied during cross-polarization. The acquisition time was 32.8 ms, and the recycle delay was 1 s.
Thioacidolysis
The thioacidolysis method used to determine the lignin composition of treated and untreated cell wall material as well as extracted material was as described by Lapierre et al. (22).
Lignin Isolation
Ball-milled lignin was isolated according to modified literature methods described previously (20, 23, 24). Wiley milled alfalfa samples (60 mesh) were Soxhlet-extracted with ethanol/H2O (95:5, v/v) for 48 h and then dried under vacuum overnight. The dried alfalfa (5–10.0 g) was ball-milled in a Roalox ceramic jar (0.35 liter) with zirconia balls using a rotatory ball mill running at 96 rpm for 8 days. A zirconia ball/biomass weight ratio of 30:1 was used. The ball-milled residue was then extracted (2 × 48 h stirring in the dark) with dioxane/water (96:4, v/v; 10 ml/g of alfalfa). The extracted mixture was centrifuged, and the supernatant was collected and evaporated at 35 °C under reduced pressure to obtain the crude ball-milled lignin. The crude lignin was dissolved in acetic acid/water (90:10, v/v; 50 mg/ml), precipitated in deionized water (200 ml), centrifuged, and dried under vacuum at room temperature for 24 h. For further purification, the solid product was dissolved in a minimum quantity of 1,2-dichloroethane/ethanol (2:1, v/v), precipitated in diethyl ether (200 ml), centrifuged, washed with diethyl ether (3 × 20 ml), dried under vacuum at 40 °C overnight, and stored in a refrigerator. The ball-milled lignin yields were 7.7, 14.2, 9.4, and 10.1%, for the control, C3H4a, C3H9a, and HCT30a samples, respectively.
GPC
The isolated lignin samples were weighed into Reacti-Vials and acetylated by dissolving in pyridine (10 μl/1-mg sample), stirring at 40 °C for 1 h, adding acetic anhydride (10 μl/1-mg sample) and stirring overnight at room temperature. The reaction was terminated by the addition of methanol (4 μl/1-mg sample). The acetylation reagents were evaporated from the samples at 40 °C under a stream of nitrogen gas, and the samples were dried in a vacuum oven at 40 °C overnight and then (1 torr) at room temperature for 1 h. The dried acetylated samples were dissolved in THF and filtered (0.45-μm nylon membrane syringe filters) before GPC analysis.
GPC analysis was performed using an Agilent HPLC system with three polystyrene/divinylbenzene GPC columns (300 × 7.5 mm, 10-μm beads; Polymer Laboratories) with nominal pore diameters of 104, 103, and 102 Å. The eluent was THF; the flow rate 1.0 ml/min; the sample concentration was ∼2 mg/ml; and an injection volume of 25 μl was used. The HPLC system was attached to a diode array detector measuring absorbance at 260 nm (bandwidth of 40 nm). Polystyrene calibration standards were used with molecular weights ranging from 580 to 2,950,000. Toluene was used as the monomer calibration standard.
RESULTS
Extractions
Methanol extraction was first used to ensure the removal of small molecules that are structurally unrelated to the plant cell wall. Gravimetric variations in methanol extracts of the non-cell wall components were not statistically significant across the lines. Upon further extraction with 0.1 m NaOH and then 2.0 m NaOH, there was significantly more material removed from the two transgenic lines compared with the control. The 2.0 m NaOH solution was acidified, and the precipitates were collected. A higher mass of precipitate was collected from the transgenic lines compared with the control, in agreement with a decrease in the extracted residue in the transgenic lines.
Solid-state NMR of the Cell Wall Residue
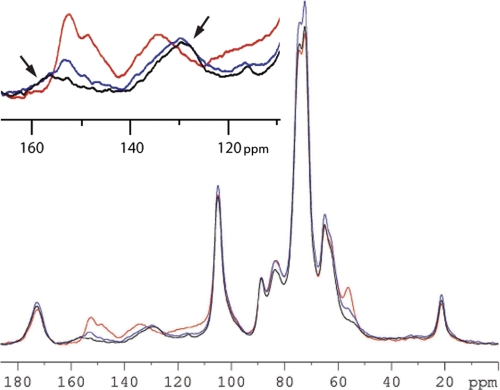
Solid-state 13C CP/MAS NMR was used to investigate the lignin structural characteristics in plant cell walls. The advantage of this technique over liquid-state NMR is the inclusion of the whole biomass (treated or untreated) instead of only the components that can be solubilized in applicable solvents. This allows a greater proportion of the biomass to be examined; however, solid-state NMR has the disadvantage of lower resolution. Background measurements of the whole insoluble cell wall residue (post-methanol extraction) were used to compare the control with the C3H- and HCT- down-regulated lines (Fig. 3).
FIGURE 3.
13C CP/MAS NMR spectra of methanol-extracted alfalfa stems. Red traces, CTR49a; blue traces, C3H9a; black traces, HCT30a. The spectra in the inset highlight the change in intensity at 157–165 ppm assigned to H4, demonstrating the increase in H lignin.
By adjusting the solid-state NMR spectra of the six lines so they were equal at 89 ppm (assigned to C-4 in interior crystalline cellulose), the relative amount of lignin in each sample could be compared (see Fig. 1 for carbon labeling convention). A comparison of the three alfalfa lines after methanol extraction (Fig. 3) showed that the control had greater intensity in the aromatic region (110–165 ppm) than the transgenic lines relative to the carbohydrate region (60–110 ppm). The aromatic region of the cell wall residue of plant materials is generally assigned to lignin, although other compounds such as proteins, tannins, and phenolic compounds (including ferulates and coumarates) cross-linked to either lignin or hemicellulose fractions can also contribute to the aromatic intensity. The decrease in the aromatic intensity relative to the carbohydrate intensity, suggesting decreased lignin content in the transgenic materials compared with the control, is consistent with the previous determination of lignin content in these lines as determined by the acetyl bromide method (25).
The spectra of the whole plant cell wall residue for the C3H and HCT transgenic lines show an increase in intensity at ∼160 ppm, assigned to the lignin H4 (Fig. 3, inset), and ∼130 ppm, assigned to H2 and H6. We believe that the expected increase in intensity at ∼115 ppm due to H3 and H5 is offset by the decrease in lignin content, although close examination of the alfalfa HCT transgenic spectra (Fig. 3, inset) indicates a possible broad peak. Concurrent with an increase in intensity assigned to H-type units are decreases in resonances assigned to S- and G-type units (for example, 152 ppm assigned to S3 and S5 (26)). The lower abundance of S- and G-type lignin units can also be determined by the decrease in the methoxyl peak at 56 ppm, although decreases in total lignin content can also contribute to the loss in signal intensity. A more complete summary of reference lignin chemical shifts can be found elsewhere (16, 26–29).
Base Extraction
The treatment of biomass with base removes both phenolic and hemicellulosic components of the plant cell wall, making it difficult to compare spectra. To compare two treatment conditions of the same sample, we assume that the crystalline cellulose concentration of the sample is constant between treatments. C-4 of the crystalline cellulose peak appears at 88–89 ppm (30–32) and appears distinct from the amorphous region. By assuming that there is no change in crystalline cellulose during the base extractions, the crystalline cellulose peak can be used as an internal standard for relative comparisons between samples. Although there could be some change in crystalline cellulose due to the conversion of type I to type II cellulose, the spectra do not show any type II cellulose peaks, indicating no large changes in cellulose morphology. Use of the crystalline cellulose peak as an internal standard is not absolute but gives an indication of the change in the aromatic intensity relative to the crystalline cellulose.
0.1 m NaOH Extraction
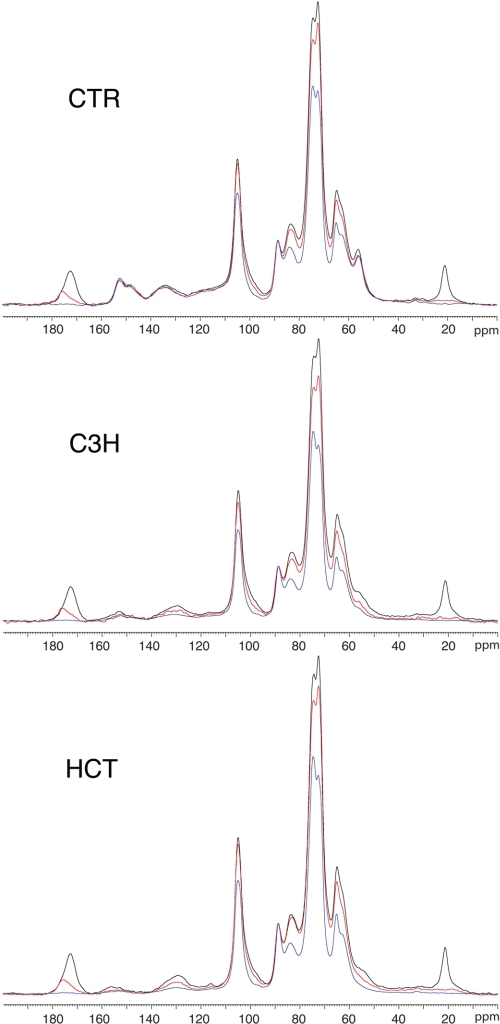
The solid-state NMR representation of the sequential extraction of the control, C3H, and HCT lines is shown in Fig. 4. Black traces represent the whole cell wall (extracted with methanol to remove small molecules and metabolites from the cell), red traces represent the 0.1 m NaOH-extracted cell wall (overnight, 5 °C), and blue traces represent the 2 m NaOH-extracted cell wall (10 min, 110 °C). As shown by the minimum change in the intensity of the aromatic region of the spectrum (110–165 ppm), the control sample did not lose a significant amount of aromatic material during either the 0.1 or 2.0 m NaOH extraction. This result is expected given the relatively mild treatments used in this work.
FIGURE 4.
13C CP/MAS NMR spectra from control and C3H- and HCT-down-regulated alfalfa. Black traces, methanol-extracted biomass; red traces, 0.1 m NaOH-extracted biomass; blue traces, 2.0 m NaOH-extracted biomass.
However, material was removed from both the C3H and HCT transgenic lines by 0.1 m NaOH extraction, especially in the regions between 122 and 140 ppm (representing H2/6, S1/4, and G1) and 151 and 161 ppm (representing S3/5, G3 phenolic, and G4 non-phenolic). The H2/6 region (126–129 ppm) did not overlap with the S1/4 and G1 regions (133–136 ppm), indicating that, at the very least, both H and S or G lignin subunits are being lost on extraction in the transgenic lines compared with the control. Loss of methoxyl content represented by a decrease in the peak intensity at 55 ppm (Fig. 3) is also indicative of loss of either S or G subunits of lignin.
2.0 m NaOH Extraction
Treatment with 2.0 m NaOH resulted in a 13C NMR signal reduction similar to that seen on treatment with 0.1 m NaOH. The control was only slightly changed, whereas major changes were observed in the spectra of the transgenic lines. Similar to what was observed in the 0.1 m NaOH extraction, the signal reduction was seen mostly in the regions at 122–140 and 151–161 ppm, with additional decreases seen in the region at 55 ppm (Fig. 3). As with the 0.1 m NaOH treatment, this reduction indicates a decrease in H2/6, S1/4, G1, S3/5, G3 phenolic, and G4 non-phenolic resonances, signifying the removal of lignin and lignin-like components. A concomitant decrease in methoxyl groups at 55 ppm can also be seen (Fig. 3), confirming that G and/or S lignin subunits are being removed as well as H subunits.
Solid-state NMR spectra of the 2.0 m NaOH precipitate were compared after normalizing to the carbohydrate peak at 101 ppm (see Fig. 6). Although this method of comparison does not allow quantification, it is clear that there is very little aromatic material (125–165 ppm) in the 2.0 m NaOH extract of the control. There are, however, large aromatic signals present in the extracts from both of the transgenic lines, corresponding to H3/5 (114–118 ppm), H2/6 (126–132 ppm), and H4 (156–163 ppm). This indicates that the aromatic-containing material in the precipitate is rich in H subunits rather than S or G subunits.
FIGURE 6.
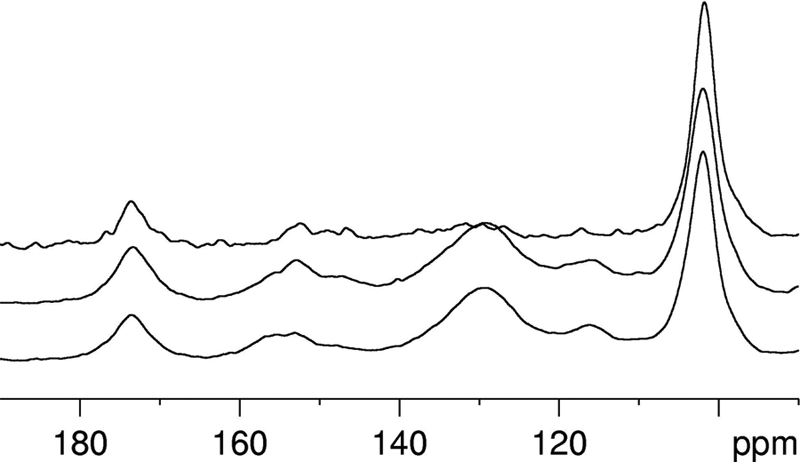
Solid-state 13C CP/MAS NMR spectra of the 2. 0 m NaOH precipitate. Shown are control and C3H- and HCT-down-regulated alfalfa. Upper trace, control; middle trace, C3H9a; lower trace, HCT30a.
Thioacidolysis
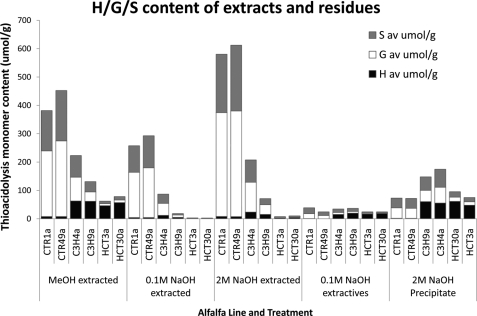
The methanol-, 0.1 m NaOH-, and the 2.0 m NaOH-extracted biomass; the 0.1 m NaOH extractives; and the 2.0 m NaOH precipitate were subjected to thioacidolysis to further confirm the distribution of the H, G, and S lignin subunits and their tendency to be extracted. The thioacidolysis data support the NMR findings (Fig. 5) and, in addition, allow quantitative comparison of the lines. The thioacidolysis of the methanol-extracted residues indicated that the H/G/S ratios were similar to previously published results (Table 1). The methanol-extracted controls showed lignin high in G and S subunits and little H monomer contribution, whereas the transgenic lines showed high levels of H monomer content. The HCT-down-regulated line had low levels of G and S lignin subunits, whereas the C3H line still retained more than half of the G/S lignin subunits found in the control. This indicated that the lignin structure in C3H is less altered compared with the control than is that in the HCT line. Note that the thioacidolysis values were lower for the 0.1 m NaOH-extracted material than for either the methanol- or 2 m NaOH-extracted residue. The 0.1 m NaOH extraction appeared to liberate phenolic compounds, which release S, G, and H monomers less readily than the methanol- or 2 m NaOH-treated material. A possible explanation is that the low molecular weight phenolic compounds contain a higher number of C–C bonds that are not cleaved under the thioacidolysis conditions employed and were therefore not detected.
FIGURE 5.
Lignin monomer compositions by thioacidolysis of extracts from control and transgenic alfalfa. Shown are H, G, and S lignin monomer levels (μmol/g) from methanol-, 0.1 m NaOH-, and 2.0 m NaOH-extracted residues; 0.1 m NaOH extractives; and 2.0 m NaOH precipitate. Thioacidolysis analysis of extracted residues was performed in triplicate; extractives were performed in duplicate. av, average.
TABLE 1.
S/G ratio and H, G, and S lignin content of the three alfalfa lines as determined by thioacidolysis (4) and 13C CP/MAS NMR of the cell wall residue
| Sample type/line | H | G | S | Total lignin | S/G ratio |
|---|---|---|---|---|---|
| % | % | % | mg/g | ||
| Thioacidolysis and acetyl bromide (whole plant cell wall residue) (4)a | |||||
| Control | 4.9 | 56.0 | 39.2 | 207.2 | 0.70 |
| C3H | 50.0 | 27.4 | 22.6 | 131.7 | 0.82 |
| HCT | 75.5 | 13.0 | 11.5 | 99.8 | 0.88 |
| Solid-state 13C NMRb | |||||
| Control | 149.5 | ||||
| C3H | 117.4 | ||||
| HCT | 89.7 | ||||
a Averaged from n lines: control, n = 4; C3H, n = 3; and HCT, n = 2.
b Averaged from the two relevant lines presented in this work.
Thioacidolysis analysis confirmed that lignin with high proportions of H monomers had been removed from the cell wall residue of the transgenic lines on extraction with 2.0 m NaOH, in agreement with the solid-state NMR analysis of the residues (Fig. 6). This analysis also indicated that the control lines contained very small amounts of the H lignin subunits (<10 μmol), as would be expected given the low natural abundance of H monomers in the control and the small amount of material extracted from the control. The thioacidolysis results of the 2.0 m NaOH-extracted residues showed a greatly reduced lignin content for the transgenic lines (especially HCT), in agreement with the 13C CP/MAS data (Fig. 4).
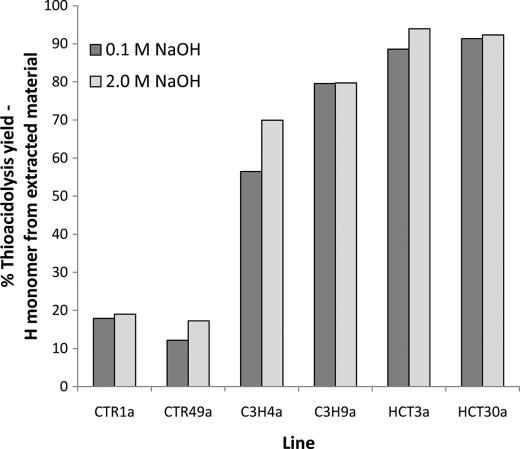
Analysis of the percentage of H lignin monomers (Fig. 7) that were removed by either the 0.1 or 2.0 m NaOH treatments demonstrated how the extractability of lignin high in H subunits changed radically from the control to the transgenic lines. Analysis of the data based on the percentage of H monomer units extracted removed the bias of different lignin contents and the different monomer ratios from the results. Using these data, the increased tendency of H monomer units to be preferentially extracted from the transgenic lines can be seen (Fig. 7). The HCT lines can be seen to have the highest percentage of H lignin monomers extracted, with ∼90% extracted compared with <20% for the controls. The percent H lignin monomers extracted is intermediate for the two C3H lines (ranging from 57 to 80%), as expected from their intermediate total lignin and H monomer contents.
FIGURE 7.
Percent thioacidolysis yield. Shown is the H monomer content from extracted material. Dark gray bars, 0.1 m NaOH extraction; light gray bars, 2 m NaOH extraction .
GPC Analysis
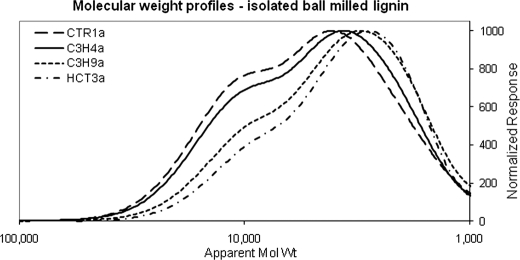
The lignin isolated from HCT30a has a peak average molecular weight (Mp) of 2800, a weight average molecular weight (Mw) of 4000, and an H monomer content of 74%. At the other extreme, the control has Mp = 4100, Mw = 6000, and an H monomer content of 2%. Interestingly, even the difference between the two C3H lines is captured by the size distribution of the isolated lignin. C3H4a, which was less down-regulated than C3H9a, behaved most similarly to the control. The Mw = 4000, Mp = 3000, and H monomer content of 48% for C3H9a reflect a strong down-regulation of C3H and are similar to the values in the HCT line. C3H4a instead has values part way between C3H9a and the control (Mw = 5500, Mp = 3600, and H monomer content of 27%), reflecting a partial down-regulation of C3H expression.
DISCUSSION
Radical Polymerization and Formation of the Lignin Polymer
Lignin is thought to form via oxidative coupling of the monolignol metabolites (2, 33). Any variable that influences these coupling reactions therefore influences the resultant lignin. Russell et al. (34, 35) reported trends in the oxidative coupling patterns of different monolignols that indicate that the monolignol distribution of a lignin influences both the interunit linkage distribution and possibly the size of the resultant lignin. Insights can be gleaned from studying this artificial system.
Using ESR spectroscopy of peroxidase-catalyzed phenylpropanoid oxidation and molecular modeling, Russell et al. (34) investigated the distribution of the unpaired electron in lignin precursor radicals. They found that methoxyl substitution increases the unpaired electron density on the phenolic oxygen and therefore the tendency of the oxidative coupling reaction to involve reactions through the phenol. As the H lignin subunit-forming monolignol (coumaryl alcohol) has no methoxy substituents on the ring, the unpaired electron density is greatest on the carbon nuclei, not the phenolic oxygen, and consequently, the preference is for C–C reactions. This is exactly what was observed by Pu et al. (20) in lines in which lignin is high in H subunits. Two-dimensional NMR showed a decrease in β-O4 linkages (a phenolic linkage) and an increase in both resinol and phenylcoumaran linkages (C–C linkages). Furthermore, both resinol and phenylcoumaran linkages are in greater abundance in lines down-regulated by HCT (H lignin subunits, 75.5%) compared with C3H (H lignin subunits, 50.0%) (1). Thus, these results follow the trend that lignin with a higher H lignin subunit content is concomitantly higher in C–C linkages. Ralph et al. (16) additionally found that dibenzodioxocin (a linkage involving three monomer units, two phenolic linkages, and one C–C linkage) was doubled in C3H-down-regulated alfalfa.
In a follow-up report, Russell et al. (36) showed that (for horseradish peroxidase) the ease with which lignin precursors undergo oxidation to their free radical form is also dependent on their degree of methoxylation. In this in vitro example, additional methoxy groups help stabilize the free radical, aid oxidation, and therefore produce a greater number of reactive species. Russell et al. pointed out that this phenomenon likely explains why the non-methoxylated lignin subunits make up such a small amount of natural lignin. It is not known exactly how these changes in the tendency to form radicals impact the incorporation of the resultant lignin into the plant cell wall, but given the changed extraction profile of the C3H and HCT lines, it is apparent that it does. One possibility is that, due to a reduced number of reactive monomer species, chain growth of the lignin polymer may be reduced, leading to a decrease in molecular weight of lignin. In fact Russell, et al. (36) suggested that the non-methoxylated monomer may have a role in terminating chain growth. Smaller lignin polymers would presumably be less cross-linked (per total length), potentially having fewer bonds tying them into the lignocellulosic ultrastructure. Smaller aromatic chains would also have greater solubility, as they are not limited by the phenomenon of hydrophobic hydration, which impacts large compounds of the same unit composition.
GPC of isolated lignin confirms that there is a trend toward lower molecular weight lignin in the transgenic lines versus the control (Fig. 8), supporting the idea that lignin high in H content may be more easily extracted due to decreased chain length. Moreover, the trend in molecular weight decrease corresponds with the increase in the percentage of H lignin subunits present in the methanol-extracted cell wall residue.
FIGURE 8.
GPC of isolated lignin. Lignins were isolated from alfalfa lines CTR1a, C3H4a, C3H9a, and HCT3a.
Impact on Lignin Structure
Our results indicate there are extractable and non-extractable fractions of polyphenolic compounds present in the transgenic materials. Thus, the lignin rich in H subunits behaves significantly differently from the lignin present in the controls. Russell et al. (36) established that a polymer formed primarily from H monomers has a reduced tendency to react, tends to form C–C bonds, and has a tendency to cap. In conjunction with the GPC of isolated lignin indicating lower average molecular weights, this points toward the difference between the control and transgenic lignins as being, at least partly, one of polymer molecular weight. This is not to rule out the possibility that alterations are also occurring due to an inability of the plant to cope with the large increase in flux along the p-coumaryl alcohol portion of the lignin biosynthetic pathway.
Lignin high in H subunits has been observed to be laid down in the cell wall very early in the lignification process and may therefore be associated with initiation of lignification. Possibly the material that is not removed by base extraction is serving that purpose and is laid down via a different mechanism from the lignin formed with the increased H content due to down-regulated expression of the C3H and HCT genes. The extractable material is then the lignin synthesized by the plant as it attempts to compensate for the loss of the G and S monomers. It is not surprising then that the extractable polyphenolic material is different in these transgenic materials compared with the control materials. It is a matter for further investigation as to whether the polyphenolic material produced by the transgenic plants conforms to our current definition of lignin.
Additional work is under way to characterize the structure of the components of the extracted materials to increase our understanding of how the change in the lignin monomer ratio has altered lignin incorporation into the cell walls of the C3H- and HCT-down-regulated transgenic alfalfa plants. Understanding more about this process will help further detail what occurs in planta, in the time between initiation of lignin monomer biosynthesis and the generation of the final lignin product within the plant cell wall.
Conclusions
The increased extractability of the lignin-like material composed predominately of H subunits is due (at least partly) to a decrease in the molecular weight of the polymer. The decrease in molecular weight is explained by the reduced stability of the 4-coumaryl alcohol building block during radical coupling compared with the more prevalent sinapyl and coniferyl alcohols. As a result of the radical tending to stabilize on the ring instead of the phenolic oxygen, the interunit linkage distribution of the materials high in H lignin subunits is also altered. Our findings suggest that the lignin molecular weight and, as a result, the ease with which it can be removed during chemical processing can be influenced by altering the monomer ratio.
Acknowledgments
We thank Robert Sykes (National Bioenergy Center, National Renewable Energy Laboratory) for discussions and for reviewing the manuscript and David Johnson for performing the GPC.
This work was supported by the Bioenergy Science Center, which is a United States Department of Energy Bioenergy Research Center supported by the Office of Biological and Environmental Research in the Department of Energy Office of Science.
- H
- 4-coumaryl alcohol
- G
- coniferyl alcohol
- S
- sinapyl alcohol
- C3H
- p-coumarate 3-hydroxylase
- HCT
- hydroxycinnamoyl-CoA:shikimate hydroxycinnamoyltransferase
- GPC
- gel permeation chromatography
- CP/MAS
- cross-polarization/magic angle spinning
- Mp
- peak average molecular weight
- Mw
- weight average molecular weight.
REFERENCES
- 1.Chen F., Dixon R. A. (2007) Nat. Biotechnol. 25, 759–761 [DOI] [PubMed] [Google Scholar]
- 2.Sarkanen K. V. (1971) In Lignins: Occurrence, Formation, Structure and Reactions (Sarkanen K. V., Ludwig C. H. eds) Wiley InterScience, New York [Google Scholar]
- 3.Freudenberg K., Neish A. C. (1968) Constitution and Biosynthesis of Lignin, pp. 95–163, Springer-Verlag, Berlin [Google Scholar]
- 4.Whetten R. W., MacKay J. J., Sederoff R. R. (1998) Annu. Rev. Plant Physiol. Plant Mol. Biol. 49, 585–609 [DOI] [PubMed] [Google Scholar]
- 5.Monties B., Fukushima K. (2001) in Lignin, Humic Substances and Coal (Hofrichter M., Steinbuchel A. eds) pp. 1–64, Wiley-VCH, Weinheim, Germany [Google Scholar]
- 6.Wadenback J., Clapham D., Gellerstedt G., von Arnold S. (2004) Holzforschung 58, 107–115 [Google Scholar]
- 7.Lam T. B. T., Iiyama K., Stone B. A. (1992) Phytochemistry 31, 1179–1183 [Google Scholar]
- 8.Iiyama K., Lam T. B. T., Kasuya N., Stone B. A. (1994) Phytochemistry 35, 959–961 [Google Scholar]
- 9.Iiyama K., Lam T. B. T., Stone B. A. (1990) Phytochemistry 29, 733–737 [Google Scholar]
- 10.Buranov A. U., Mazza G. (2008) Ind. Crop. Prod. 28, 237–259 [Google Scholar]
- 11.Crestini C., Argyropoulos D. S. (1997) J. Agric. Food Chem. 45, 1212–1219 [DOI] [PubMed] [Google Scholar]
- 12.Ralph J., Hatfield R. D., Quideau S., Helm R. F., Grabber J. H., Jung H. J. G. (1994) J. Am. Chem. Soc. 116, 9448–9456 [Google Scholar]
- 13.Ralph J. (1996) J. Nat. Prod. 59, 341–342 [Google Scholar]
- 14.Chiang V. L. (2006) Environ. Chem. 4, 143–146 [Google Scholar]
- 15.O'Connell A., Holt K., Piquemal J., Grima-Pettenati J., Boudet A., Pollet B., Lapierre C., Petit-Conil M., Schuch W., Halpin C. (2002) Transgenic Res. 11, 495–503 [DOI] [PubMed] [Google Scholar]
- 16.Ralph J., Akiyama T., Kim H., Lu F., Schatz P. F., Marita J. M., Ralph S. A., Reddy M. S., Chen F., Dixon R. A. (2006) J. Biol. Chem. 281, 8843–8853 [DOI] [PubMed] [Google Scholar]
- 17.Shadle G., Chen F., Srinivasa Reddy M. S., Jackson L., Nakashima J., Dixon R. A. (2007) Phytochemistry 68, 1521–1529 [DOI] [PubMed] [Google Scholar]
- 18.Nakashima J., Chen F., Jackson L., Shadle G., Dixon R. A. (2008) New Phytol. 179, 738–750 [DOI] [PubMed] [Google Scholar]
- 19.Reddy M. S., Chen F., Shadle G., Jackson L., Aljoe H., Dixon R. A. (2005) Proc. Natl. Acad. Sci. 102, 16573–16578 [DOI] [PMC free article] [PubMed] [Google Scholar]
- 20.Pu Y., Chen F., Ziebell A., Davison B. H., Ragauskas A. J. (2009) Bioenergy Res. 2, 198–208 [Google Scholar]
- 21.Sykes R., Kodrzycki B., Tuskan G. A., Foutz K., Davis M. (2008) Wood Sci. Technol. 42, 649–661 [Google Scholar]
- 22.Lapierre C., Rolando C., Monties B. (1983) Holzforschung 189–198 [Google Scholar]
- 23.Bjorkman A. (1956) Svensk Papperstidning 37, 477–485 [Google Scholar]
- 24.Chang H. M., Cowling E. B., Brown W., Alder E., Miksche G. (1975) Holzforschung 29, 153–159 [Google Scholar]
- 25.Chen F., Srinivasa Reddy M. S., Temple S., Jackson L., Shadle G., Dixon R. A. (2006) Plant J. 48, 113–124 [DOI] [PubMed] [Google Scholar]
- 26.Robert D. (ed) (1992) Methods in Lignin Chemistry, Springer-Verlag, New York [Google Scholar]
- 27.Ralph S. A., Ralph J., Landucci L. L. (2004) NMR Database of Lignin and Cell Wall Model Compounds, ars.usda.gov/Services/docs.htm?docid=10491
- 28.Joseleau J. P., Ruel K. (1997) Plant Physiol. 114, 1123–1133 [DOI] [PMC free article] [PubMed] [Google Scholar]
- 29.Wikberg H., Maunu S. L. (2004) Carbohydr. Polymers 58, 461–466 [Google Scholar]
- 30.Teeäär R., Serimaa R., Paakkarl T. (1987) Polymer Bull. 17, 231–237 [Google Scholar]
- 31.Park S., Johnson D. K., Ishizawa C. I., Parilla P. A., Davis M. F. (2009) Cellulose 16, 641–647 [Google Scholar]
- 32.Hult E. L., Liitia T., Maunu S. L., Hortling B., Iversen T. (2002) Carbohyr. Polymers 49, 231–234 [Google Scholar]
- 33.McDougall G. J., Stewart D., Morrison I. M. (1994) Planta 194, 9–14 [Google Scholar]
- 34.Russell W. R., Forrester A. R., Chesson A., Burkitt M. J. (1996) Arch. Biochem. Biophys. 332, 357–366 [DOI] [PubMed] [Google Scholar]
- 35.Russell W. R., Provan G. J., Burkitt M. J., Chesson A. (2000) J. Biotechnol. 79, 73–85 [DOI] [PubMed] [Google Scholar]
- 36.Russell W. R., Burkitt M. J., Scobbie L., Chesson A. (2006) Biomacromolecules 7, 268–273 [DOI] [PubMed] [Google Scholar]


