

Abstract
Hormone-sensitive lipase (HSL) is rate-limiting for diacylglycerol and cholesteryl ester hydrolysis in adipose tissue and essential for complete hormone-stimulated lipolysis. Gene expression profiling in HSL−/− mice suggests that HSL is important for modulating adipogenesis and adipose metabolism. To test whether HSL is required for the supply of intrinsic ligands for PPARγ for normal adipose differentiation, HSL−/− and wild type (WT) littermates were fed normal chow (NC) and high fat (HF) diets supplemented with or without rosiglitazone (200 mg/kg) for 16 weeks. Results show that supplementing rosiglitazone to a NC diet completely normalized the decreased body weight and adipose depots in HSL−/− mice. Additionally, rosiglitazone resulted in similar serum glucose, total cholesterol, FFA and adiponectin values in WT and HSL−/− mice. Furthermore, rosiglitazone normalized the expression of genes involved in adipocyte differentiation, markers of adipocyte differentiation, and enzymes involved in triacylglycerol synthesis and metabolism, and cholesteryl ester homeostasis, in HSL−/− mice. Supplementing rosiglitazone to a HF diet resulted in improved glucose tolerance in both WT and HSL−/− animals and also partial normalization in HSL−/− mice of abnormal WAT gene expression, serum chemistries, organ and body weight changes. In vitro studies showed that adipocytes from WT animals can provide ligands for activation of PPARγ, and that activation is further boosted following lipolytic stimulation; whereas adipocytes from HSL−/− mice displayed attenuated activation of PPARγ, with no change following lipolytic stimulation. These results suggest that one of the mechanisms by which HSL modulates adipose metabolism is by providing intrinsic ligands or pro-ligands for PPARγ.
Keywords: knockout, rosiglitazone, ligand
1. Introduction
Adipogenesis is the process where committed preadipocytes differentiate into mature adipocytes. This process starts with cell arrest of preadipoctyes, which is controlled by many transcription factors, including early transcription factors C/EBPβ, C/EBPδ and PPARγ and followed by C/EBPα [1-5]. Committed preadipocytes undergo morphologic and gene expression changes that result in increased triacylglycerol1 (TAG) synthesis and lipid accumulation. The mature adipocyte is filled with lipid, acquires insulin sensitivity, and expresses and secretes various adipokines. Overall, more than 100 different transcription factors, coactivators and repressors are necessary for this process. Among these factors PPARγ is considered the master regulator of adipogenesis [6, 7]. Extensive studies using loss of function and gain of function designs show that PPARγ is necessary and sufficient for adipogenesis [8]. Overexpression of PPARγ in fibroblasts results in stimulation of adipogenesis and lipid accumulation [9]. PPARγ action is potentiated by a variety of lipids and lipid-like compounds, including various fatty acids [2]. High concentrations of fatty acids are associated with increased adipogenesis and intracellular TAG storage; homeostasis of fatty acids is maintained through de novo synthesis and through lipolysis in adipose tissue.
Studies of the enzymes responsible for adipose tissue lipolysis have shown that adipose tissue triglyceride lipase (ATGL) [10, 11], hormone-sensitive lipase (HSL) [12] and monoacylglycerol lipase are the major enzymes responsible for the breakdown of stored TAG. Further studies show that ATGL is primarily responsible for the first step of TAG breakdown resulting in diacylglycerol (DAG), and that HSL is responsible for the hydrolysis of DAG [13, 14]. Genetic ablation of ATGL in mice results in obese animals with over-accumulation of TAG in various tissues [15]. The genetic ablation of HSL in mice, however, results in a phenotype where, instead of being obese, the animals are resistant to the development of obesity either by high fat diet or by crossing with genetically obese animals, ob/ob mice [16-18]. Studies of gene expression show that a number of genes associated with adipose differentiation, such as transcription factors, lipogenic enzymes, lipid related proteins, and insulin signaling proteins, are decreased in adipose tissue of HSL−/− mice. Thus, there is a distinct functional difference between ATGL and HSL in terms of regulating adipose lipid homeostasis, and HSL appears to have a role in the process of adipogenesis and lipid accumulation. In this paper, we provide evidence that HSL modulates adipogenesis through providing intrinsic ligands, or substrates that are metabolized further to produce ligands, i.e., pro-ligands, for the master regulator of adipogenesis, PPARγ.
2. Materials and Methods
2.1 Animals
HSL−/− mice were generated by homologous recombination as previously described [17], and backcrossed five times with C57/BL6J mice. Mice were maintained in the animal facility at the VA Palo Alto on a 12/12 hr light/dark cycle. For breeding experiments, mice heterozygous for the deleted HSL allele were used to generate homozygous HSL−/− mice and HSL+/+ wild type (WT) littermates. Genotyping was performed by a single-step PCR using three primers as described previously [17]. High-fat (35.9% w/w lard fat) diet (HF) and control normal chow (4.8% w/w fat) diet (NC) were obtained from Research Diets, Inc. (New Brunswick, NJ), product numbers D12309 and D12310, respectively. Rosiglitazone containing diets were custom formulated by adding 200 mg/kg rosiglitazone [19] to the HF and NC diets to form the HF with rosiglitazone (HF+R) and NC with rosiglitazone diets (NC+R), respectively. Twelve week-old female HSL+/+ and HSL−/− littermate mice were randomized to HF, NC, HF +R, and NC+R diets ad libitum for 16 weeks. Body weight, body temperature, and 24hr food consumption were measured every other week following procedures described previously. At the end of the diet treatments, animals were sacrificed and adipose tissue (both white – WAT and brown – BAT) collected.
2.2 Glucose tolerance test
Glucose tolerance tests were performed at 13 weeks after the animals were on the diet treatments. Animals were fasted overnight, blood was drawn at baseline and at 15, 30, 60 and 120 min after the intraperitoneal injection of 20% dextrose solution (1g dextrose/kg of body weight). Blood glucose levels were assayed using a Precision II glucometer (Abbott, IL). Serum was prepared from the blood samples and stored for various assays.
2.3 Blood chemistries
Blood samples were drawn by retroorbital puncture from animals in the fed or overnight (>16 h)-fasted state, as indicated in the figure legends. Cardiac puncture was performed at the time of death in the fed state. Enzymatic assay kits were used for the determination of serum glucose, triglyceride, total cholesterol (Sigma Chemical Co., St. Louis, MO), and FFA (Wako, Richmond, VA). Serum insulin, adipocyte complement-related protein of 30 kDa (ACRP30)/adiponectin, and leptin were measured using radioimmunoassay kits (Linco Research, St. Charles, MO).
2.4 RNA isolation
Total RNA was isolated from white adipose tissue using TRIzol reagent (Invitrogen, Carlsbad, CA). Tissue samples were homogenized in 1 ml of TRIzol reagent per 50–100 mg of tissue using a power homogenizer (Ultra-Turrax T25, IKA® Works, Inc, Wilmington, NC). After the ethanol precipitation step, the RNA was cleaned further using ArrayGrade™ Total RNA Isolation Kit (SABiosciences, Frederick, MD). RNA was dissolved in 45–80 μl RNase free water and stored at −80°C.
2.5 Analysis of DAG content
Lipids from equal amounts of retroperitoneal white adipose tissue were extracted using Folch extraction mix (choloroform:methanol, 2:1) and then resuspended in choloroform before loading onto thin layer chromatography (TLC) plates (Whatman, Maidston, UK). After sequential separation using choloroform:methanol:water (60:40:10), and hexane:ethanol:acetic acid (85:15:2), TLC plates were developed and scanned using Gel Doc XR system from Biorad (Hercules, CA, USA) and DAG content was quantified against standards.
2.6 Measurement of PPARγ ligand activity
Primary adipocytes from WT and HSL−/− mice were prepared as described previously [20], and lipolysis was stimulated with isoproterenol (1 μM) in DMEM media with 3% BSA. Conditioned media were collected after 15 min of stimulation and used to treat CHO cells that were transfected with PPRE-Luc with and without PPARγ. Twenty-four hours after treatment with conditioned media, CHO cells were harvested and the activation of PPRE-Luc promoter was assayed using a luciferase assay kit from Promega (Madison, WI, USA).
2.7 Fatty acid analysis
Primary adipocytes from WT and HSL−/− mice were prepared as described previously [20] and incubated with or without rosiglitazone (1 μM) for 24 hours in culture media. Cells were washed with phosphate buffered saline and 5% BSA and then incubated with isoproterenol (1 μM) in DMEM media with 3% BSA. Media were collected after 1.5 hours of stimulation and fatty acid analysis performed at Microbial ID, Inc. (Neward, DE, USA). Briefly, after saponification and methylation, samples were extracted with hexane and methyl tert-butyl ether. Fatty acid methyl esters were analyzed by gas chromatography and identified by comparison with authentic standards.
2.8 Taqman real time PCR analysis
Total RNA was reverse-transcribed in a 20 μl reaction containing random primers and Superscript II enzyme. Real-time PCR was performed with an ABI Prism 8500 System using SYBR green master mix reagent and the primer pairs used described previously [16, 21]. Primers for ACSL1 (NCBI Reference Sequence: NM_007981.3) were: forward TCCTACAAAGAGGRGGCAGA, reverse GAGAGAAGAGGCCGATGAAC. The relative mass of specific RNA was calculated by the comparative cycle of threshold detection method according to the manufacturer’s instruction. Three independent sets of Taqman real time PCR were performed using different RNA preparation from the adipose tissue; each run of Taqman real-time PCR was conducted in triplicate. Genes examined included: CEBPα, PPARγ, adiponectin, perilipin, FABP4, ATGL, TGH, PEPCK, ChREBP, GPAT, DGAT1, ACSL1, ACAT1, HMGCS, HMGCR, F4/80, and 36B4. [16, 21, 22]
2.9 Statistics
Data are expressed as means ± SEM. Statistical analyses were performed by 2-way ANOVA using Prism 5 for Mac OS X (GraphPad Software, Inc., La Jolla, CA). Differences between groups were considered statistically significant when P < 0.05
3. Results
3.1 Restoration of decreased body weight gain in HSL−/− mice with rosiglitazone treatment
In our previous studies with HSL−/− mice on a mixed background of 129/Sv-C57BL6, the weight of HSL−/− mice was slightly decreased yet still very similar to HSL+/+ mice [16]. In the current study, we have backcrossed the HSL−/− mice at least 5 times into the C57BL6J background. When fed a NC diet, the body weight of HSL−/− mice is only 90% of that of its WT littermates (29.12 ± 1.9 g for WT, and 26.2 ± 0.8 g for HSL−/−) (p<0.05). Supplementing rosiglitazone in the NC diet resulted in increased body weight gain in HSL−/− mice and restored the body weight of HSL−/− mice to that of WT littermate controls (Figure 1). When the animals were fed a HF diet, there was a greater difference in body weights due to the lack of weight gain in the HSL−/− mice (WT 38.85 ± 4.0 g; HSL−/− 28.43 ± 1.2 g). Supplementing rosiglitazone in the HF diet resulted in increased body weight gain in HSL−/− mice (HF+R 31.0 ± 2.2 g, p<0.05); however, the magnitude was insufficient to allow HSL−/− mice to achieve the same weight as the WT mice.
Figure 1.

Body weight gain of animals treated with rosiglitazone on either a normal chow diet (A) or a high fat diet (B). Female animals (WT, +/+ or HSL null, −/−) of 12 week old were randomized to NC (normal chow), NC+R (normal chow supplemented with rosiglitazone), HF (high fat), and HF+R (high fat supplemented with rosiglitazone) diets ad libitum for 16 weeks (n=8 in each group). Body weights were measured each week; data presented are the average of eight animals per group.
Weights of various internal organs, including adipose tissue (both WAT and BAT), liver, heart, pancreas, spleen and lung, were then examined. Similar to the effect on whole body weights, 16 weeks rosiglitazone treatment on the NC diet normalized the reduced WAT mass in HSL−/− mice (Table 1). On the HF diet, the WAT of WT animals was 3.5 fold higher than HSL−/− mice. Rosiglitazone treatment tended to normalize the differences seen in the weight of WAT in HSL−/− mice; however this was primarily due to effects on WT adipose weight and the weight of WAT in WT mice was still 2.4 fold higher than HSL−/− mice (p<0.05). HSL−/− mice were previously shown to have increased lipid accumulation in livers, resulting in larger livers [16]. Rosiglitazone treatment decreased liver weights in HSL−/− mice towards that of WT mice such that there was no significant difference in the liver weights of HSL−/− mice compared with WT mice on the respective diets. A similar effect of rosiglitazone to normalize increased splenic weight was also seen (WT 0.11 ± 0.04 g, HSL−/− 0.23 ± 0.13 g, p<0.05). For heart, there were no differences in cardiac weights between WT and HSL−/− mice, but rosiglitazone tended to increase cardiac weights and this effect was significant in HSL−/− mice (p<0.05). There were no significant differences in the weights of pancreas or lung on NC diet with or without rosiglitazone in WT or HSL−/− mice. Liver, spleen and heart were larger in HSL−/− mice on a HF diet, and remained larger with rosiglitazone treatment.
Table 1.
Weight of organs of WT and HSL−/− on different diets.
| Normal Chow | Normal Chow+Rosi | High Fat | High Fat+Rosi | |||||
|---|---|---|---|---|---|---|---|---|
| WT | HSL−/− | WT | HSL−/− | WT | HSL−/− | WT | HSL−/− | |
| Total WAT | 3.25±0.23 | 1.58±0.11* | 2.12±0.24 | 2.03±0.32 | 7.32±0.65 | 2.05±0.32** | 4.83±0.67 | 2.16±0.35* |
| BAT | 0.24±0.02 | 0.38±0.05* | 0.61±0.05 | 0.50±0.13 | 0.47±0.06 | 0.48±0.14 | 0.82±0.13 | 0.64±0.20* |
| Liver | 1.13±0.15 | 1.50±0.30* | 1.02±0.36 | 1.25±0.04 | 1.51±0.60 | 1.73±0.35* | 1.23±0.21 | 1.4±0.32 |
| Spleen | 0.11±0.04 | 0.23±0.13* | 0.13±0.03 | 0.16±0.05 | 0.09±0.03 | 0.11±0.02* | 0.15±0.03 | 0.20±0.03* |
| Pancreas | 0.18±0.05 | 0.20±0.03 | 0.15±0.03 | 0.15±0.02 | 0.21±0.07 | 0.23±0.05 | 0.16±0.21 | 0.14±0.32 |
| Heart | 0.15±0.03 | 0.15±0.03 | 0.18±0.02 | 0.20±0.02 | 0.14±0.03 | 0.16±0.02 | 0.17±0.03 | 0.21±0.03 |
| Lung | 0.21±0.03 | 0.19±0.06 | 0.16±0.03 | 0.21±0.05 | 0.17±0.04 | 0.18±0.02 | 0.14±0.05 | 0.16±0.06 |
Results are means ± SE (in g) of mice on various diets for 16wks. Mice were sacrificed in the fed state (n=8 in each group). WAT and BAT, white and brown adipose tissue, respectively. Total WAT mass is the sum of inguinal, femoral, scapular, perigonadal, and intraperitoneal depots.
P <0.05,
P <0.01.
Comparisons are between HSL−/− and WT within each treatment group.
Core body temperature was measured every other week; on average there were no significant differences in core body temperature between HSL−/− mice and WT mice on rosiglitazone (data not shown). As previously reported [16], when fasted overnight, HSL−/− mice showed 1.4 and 1.9 fold more weight loss than WT mice on NC and HF diets, respectively (Figure 2). When mice were supplemented with rosiglitazone, WT animals showed a 40% increase in fasting induced weight loss (from 1.83 ± 0.45 g to 2.58 ± 0.56 g, p<0.05), but HSL−/− mice showed no further changes. Therefore, the difference between the HSL−/− and WT mice was no longer statistically significant after rosiglitazone treatment. Food consumption in HSL−/− mice was increased by rosiglitazone on a NC diet, whereas rosiglitazone had no statistically significant effects on food consumption in WT mice or in HSL−/− mice on a HF diet (Figure 3).
Figure 2.
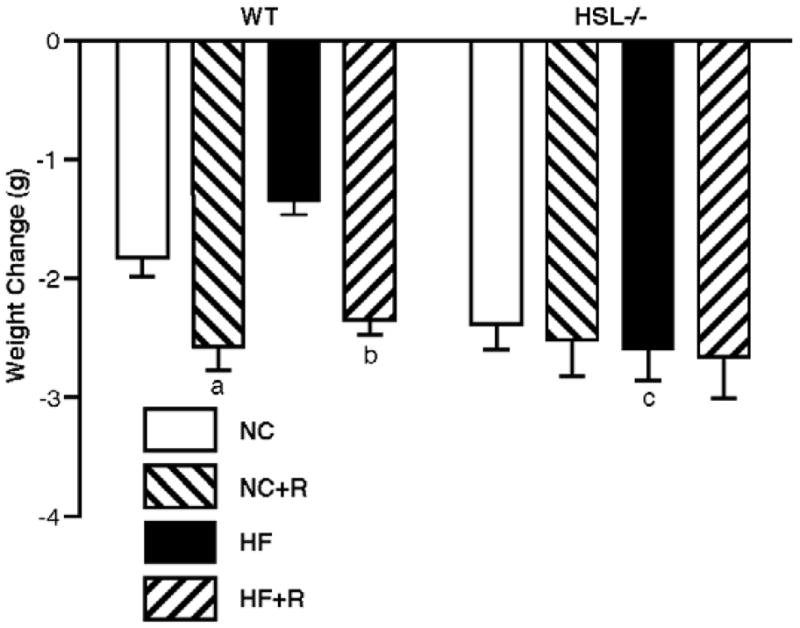
Fasting induced weight loss. At 13 weeks of diet treatment, animals were fasted overnight and differences in body weights after the fast are shown; n=8 in each group. Results are means ± SE. WT, wild type; NC, normal chow; HF, high fat diet; R, rosiglitazone. a, p<0.05 compared with WT NC; b, p<0.01 compared with WT HF; c, p<0.001 compared with WT HF.
Figure 3.
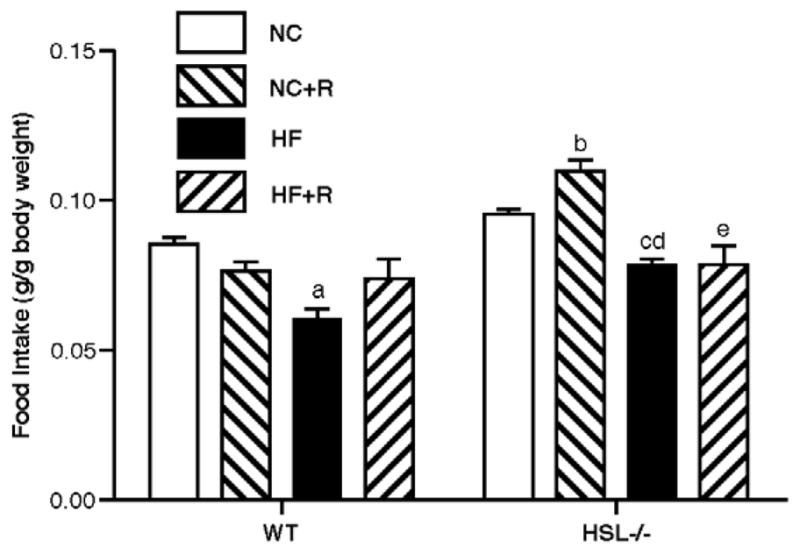
24 hour food consumption. Food consumption of the animals was measured over 24 hr periods, every other week on the various diets. Data shown are means ± SE (n=8 in each group). WT, wild type; NC, normal chow; HF, high fat diet; R, rosiglitazone. a, p<0.001 compared with WT NC; b, p<0.001 compared with WT NC+R; c, p<0.05 compared with −/− NC; d, p<0.05 compared with WT HF; e, p<0.001 compared with −/− NC+R.
3.2 Serum biochemical measurements
Serum biochemical values associated with lipid and carbohydrate metabolism are displayed in Table 2. HSL−/− mice had higher fasting serum glucose values, which decreased with rosiglitazone treatment in NC, but not with HF feeding. Rosiglitazone treatment lowered serum TG levels in WT and HSL−/− mice on both NC and HF diets. Although the serum TG levels remained lower in HSL−/− mice on rosiglitazone and NC, rosiglitazone treatment resulted in similar serum TG values in WT and HSL−/− mice on a HF diet. Rosiglitazone treatment lowered serum total cholesterol by 27% and 15% in WT animals on NC and HF diets, respectively (p<0.05); however, no changes were seen in HSL−/− mice. Rosiglitazone treatment decreased serum FFA in WT mice by 48% and 57% on NC and HF diets, respectively, and also decreased serum FFA in HSL−/− mice by 30% and 52% on NC and HF diets, respectively (p<0.05). The serum FFA levels in WT and HSL−/− mice were similar by the end of rosiglitazone treatment.
Table 2.
Serum biochemical values of WT and HSL−/− mice on different diets.
| Normal Chow | Normal Chow+Rosi | High Fat | High Fat+Rosi | |||||
|---|---|---|---|---|---|---|---|---|
| WT | HSL−/− | WT | HSL−/− | WT | HSL−/− | WT | HSL−/− | |
| Glucose, mg/dl | 160±36 | 177±36* | 104±41 | 130±30 | 179±30 | 197±29 | 140±29 | 208±47.5* |
| Triglyceride, mg/dl | 93±17 | 73±17* | 72±12 | 56±16 | 156±33 | 158±21 | 126±21 | 123.2±26.7 |
| Total cholesterol, mg/dl | 175±45 | 141±17 | 127±29 | 150±21 | 203±70 | 227±25 | 173.0±39.1 | 206.7±69.3 |
| FFA, mmol/l | 1.55±0.72 | 1.01±0.19* | 0.80±0.37 | 0.71±0.23 | 2.39±1.30 | 2.14±0.62 | 1.01±0.47 | 1.03±0.54 |
| Insulin, fasted, ng/ml | 1.66±0.15 | 1.72±0.17 | 1.48±0.08 | 1.60±0.11 | 1.53±0.12 | 1.44±0.17 | 1.30±0.29 | 1.68±0.35 |
| Adiponectin, μg/ml | 56.6±9.5 | 12.8±7.7** | 68.0±5.3 | 56.4±12.3 | 39.2±2.5 | 9.1±3.7** | 67.1±0.9 | 50.66±11.9 |
Results are means ± SE of mice on various diets for 16wks (n=8 in each group).
P <0.05,
P <0.01.
Comparisons are between HSL−/− and WT within each treatment group.
Serum adiponectin levels were lower in HSL−/− than WT mice on both NC and HF diets (p<0.05), as previously reported [16]. Rosiglitazone treatment resulted in a 3.4 and 4.5-fold increase in serum adiponectin levels in HSL−/− mice on NC and HF diets, respectively, compared to 20% (NC) and 71% (HF diet) increases seen in WT animals. This resulted in serum adiponectin levels in WT and HSL−/− mice being similar after rosiglitazone treatment. Rosiglitazone treatment showed a trend towards lowering fasting serum insulin levels; however, this did not reach statistical significance.
Glucose tolerance tests were performed after overnight fasting when animals had been on the different diets for 12 weeks. As shown in Figure 4, in the animals fed NC diets (Figure 4a), HSL−/− mice had slightly higher basal glucose levels than WT mice, and WT mice showed better glucose tolerance since their serum glucose values returned to normal faster than HSL−/− animals. At 60 mins after glucose injection, the serum glucose level was significantly different in WT and HSL−/− animals. Rosiglitazone treatment significantly improved glucose tolerance in both WT and HSL−/− mice as evidenced by the significant decrease in the area under the curve (AUC) of the GTT with rosiglitazone treatment (Figure 4b, p<0.05). In the animals fed a HF diet (Figures 4c and d), HSL−/− mice appeared to have better glucose tolerance, with serum glucose levels at 60 mins after glucose injection being significantly lower in HSL−/− animals than their WT littermate controls. Again, rosiglitazone treatment improved glucose tolerance in both HSL−/− and WT animals with significantly decreased AUC of the GTT (Figure 4d, p<0.01).
Figure 4.

Glucose tolerance tests. Glucose tolerance tests were performed at 13 weeks after the animals were on the diet treatments. Animals were fasted overnight; blood was drawn at baseline and at 15, 30, 60 and 120 min after the intraperitoneal injection of 20% dextrose solution (1g dextrose/kg of body weight). Data shown are means ± SE. (n=5 for animals on normal chow diet, n=8 for animals on HF diet). Panel A: GTT on normal chow (NC). Panel B: GTT on high fat diet (HF). Panel C: Area under the curve (AUC) of the GTTs. WT, wild type; −/−, HSL null; NC, normal chow; HF, high fat diet; R, rosiglitazone. a, p<0.01 compared with WT NC; b, p<0.05 compared with WT HF; c, p<0.05 compared with −/− HF.
3.3 Analysis of DAG content in WAT
The DAG content in the retroperitoneal WAT of HSL−/− mice that were fed with NC diet was about twice that of WT mice (HSL−/−: 8.53 ± 2.56 μg/mg, WT: 3.70 ± 1.37 μg/mg, p<0.05), and was not changed significantly by rosiglitazone treatment (Figure 5). With HF feeding, there was a trend towards an increase in DAG content in the WAT of both WT and HSL−/− mice, but the content in HSL−/− mice remained 2 fold higher than WT mice (HF+HSL−/−: 10.82 ± 2.30 μg/mg, HF+WT: 4.90 ± 0.49 μg/mg, p<0.05). Thus, rosiglitazone treatment did not significantly alter DAG content in HSL−/− mice.
Figure 5.

DAG content in WAT. Total lipids were extracted from retro-peritoneal WAT at the end of the diet treatment and used for analysis of DAG content after TLC separation of lipid species. The amounts of DAG in the samples were quantified using a standard curve run on TLC at the same time. Results are means ± SE; (n=4–5 in each group). WT, wild type; NC, normal chow; HF, high fat diet; R, rosiglitazone. a, p<0.01 compared with WT NC; b, p<0.001 compared with WT HF.
3.4 Effects of adipocyte conditioned media on PPARγ-PPRE-Luc activity
To test whether HSL is responsible for releasing ligands, or substrates that are metabolized further to produce ligands, for PPARγ, primary adipocytes were isolated from WT and HSL−/− mice and subjected to lipolytic hormone stimulation. Conditioned media were collected and tested for their ability to stimulated PPRE-Luc activity with and without PPARγ (Figure 6A). Conditioned media from WT adipocytes increased PPRE-Luc activity 5-fold (p<0.001) and this was increased an additional 30% by conditioned media collected from isoproterenol-stimulated WT adipocytes (p<0.01). Conditioned media from HSL−/− adipocytes also increased PPRE-Luc activity, but to a lesser extent than WT adipocytes (p<0.05), and there was no further change with conditioned media from isoproterenol-stimulated HSL−/− adipocytes. Similar to previous reports [13, 17], the total amount of FFA released by isoproterenol from HSL−/− adipocytes was ~50–60% lower than observed from WT adipocytes (0.663±0.088 vs 0.285±0.012 nmol/mg protein, p<0.05); this was not affected by treatment with rosiglitazone (data not shown). In addition to differences between WT and HSL−/− adipocytes in the quantity of FFA released, there were small, but significant, differences in the relative distribution of the species of fatty acids released into the media, with significantly more 9-cis-octadecenoic (18:1, p<0.001) and significantly less 9-cis-hexadecenoic (16:1, p<0.05) and 3-hydroxydodecanoic (3OH 12:0, p<0.005) released into the media of HSL−/− adipocytes (Figure 6B). Small percentages of octadecanoic (18:0) and 3-hydroxydodecenoic (3OH 12:1) were released into the media of WT adipocytes, but neither was detected in the media of HSL−/− adipocytes (p<0.005).
Figure 6.

Fatty acid products released from adipocytes. Panel A: Effects of adipocyte conditioned media on PPARγ-PPRE-Luc activity. CHO cells transfected with PPRE-Luc with and without PPARγ were exposed to conditioned media obtained from primary adipocytes that had been treated with or without isoproterenol (1μM). Adipocytes were isolated from WT and HSL−/− mice. Luciferase activity, corrected for transfection efficiency by renilla activity, was assessed 24 h after treatment with conditioned media. Data presented are means ± SE of three independent experiments. a, p<0.01 compared with WT conditioned media without isoproterenol; b, p<0.05 compared with WT conditioned media without isoproterenol; c, p<0.001 compared with WT conditioned media with isoproterenol. Panel B: Percentage distribution of fatty acid species released into media from isoproterenol-stimulated primary adipocytes isolated from WT and HSL−/− mice. Data presented are means ± SD of triplicate incubations. a, p<0.05; b, p<0.005 compared with WT.
3.5 Expression of genes in WAT
To confirm and examine the role of genes involved in various pathways associated with adipogenesis and lipid homeostasis, we used Taqman real-time RT-PCR and examined the expression of a selected set of genes (Figure 7). As previously reported [16], adiponectin and perilipin were lower in HSL−/− mice (p<0.001) and both were reduced by HF feeding in both WT and HSL−/− mice (p<0.001). Rosiglitazone treatment had no effects on expression of adiponectin or perilipin in WT mice on a NC diet; however, rosiglitazone treatment increased adiponectin (p<0.001) and tended to increase perilipin in WT mice on a HF diet. In contrast, rosiglitazone treatment increased adiponectin and perilipin in HSL−/− mice on NC (p<0.001 and 0.01, respectively) to levels seen in WT mice and tended to increase levels on HF diets; however, the increase on a HF diet was insufficient to return values to the WT level. Levels of FABP4 tended to be reduced by HF feeding in both WT and HSL−/− (p<0.05) mice. Rosiglitazone treatment had no effects on expression of FABP4 in either WT or HSL−/− mice on a NC diet; however, rosiglitazone treatment increased FABP4 in WT (p<0.001) and tended to increase FABP4 in HSL−/− mice on a HF diet; however, the increase in HSL−/− mice on a HF diet was insufficient to return values to the WT level. In contradistinction, ATGL was increased by rosiglitazone treatment in both WT and HSL−/− mice (p<0.001) on NC, but had no effects in the setting of a HF diet. PEPCK and ACSL1 tended to be lower in HSL−/− mice and tended to be reduced by HF feeding in both WT and HSL−/− mice. Rosiglitazone treatment increased PEPCK and ACSL1 in HSL−/− mice on NC (p<0.05 and 0.001, respectively) to levels seen in WT mice and tended to increase levels on HF diets; however, the increase on a HF diet was insufficient to return values to the WT level.
Figure 7.

Gene expression in WAT. Total RNA was extracted from perigonadal WAT at the end of the diet treatments and was used for gene expression analysis by real-time RT-PCR using SyBr Taqman analysis. Levels of gene expression were normalized by the expression of acidic ribosomal protein (36B4). Results are means ± SE; n=5 in each group. WT, wild type; NC, normal chow; HF, high fat diet; R, rosiglitazone; FABP4, fatty acid binding protein 4; ATGL, adipose tissue triglyceride lipase; PEPCK, phosphoenolpyruvate carboxykinase; ACSL1, acyl coenzyme A synthetase 1. a, p<0.001 compared with NC; b, p<0.01 compared with NC; c, p<0.05 compared with NC; d, p<0.001 compared with HF; e, p<0.001 compared with the respective WT; f, p<0.01 compared with the respective WT; g, p<0.05 compared with the respective WT; h, p<0.001 compared with NC+R; I, p<0.01 compared with NC+R.
4. Discussion
The major contribution of adipose tissue is the storage of energy in the form of TAG and the mobilization of this stored energy leading to the release of FFA [23, 24]. Studies show that multiple lipases, including ATGL, HSL and monoacylglycerol lipase, are involved in lipolysis and the release of FFA. In particular, HSL appears to be the rate-limiting enzyme for diacylglycerol, as well as cholesteryl ester, hydrolysis in adipose tissue and is essential for complete hormone stimulated lipolysis. Studies with HSL−/− mice show that the absence of HSL is not associated with the development of obesity; however, adipose cells from HSL−/− mice display size heterogeneity, with a population tending to be hypertrophic and an increased population of pre-adipocytes; WAT depots tend to be reduced and BAT depots are increased [17, 25]. There is a significant decrease of serum FFA level in HSL−/− mice and over-accumulation of DAG in multiple tissues [13, 17]. Further studies into the gene expression profiles in HSL−/− mice show that the levels of expression of transcription factors required for adipocyte differentiation (PPARγ, C/EBPα), markers of adipocyte differentiation (adiponectin, leptin, resistin, adipsin, FABP4, perilipin, and LPL), and enzymes involved in triglyceride synthesis (GPAT, DGAT1, DGAT2, FAS and ACLY) are reduced [16, 26]. Therefore, it appears that the absence of HSL results in the disruption of normal adipocyte differentiation and/or lipid accumulation possibly due either to the accumulation of DAG or the absence of FA products released during lipolysis. The current studies have tested the hypothesis that HSL mediates the release of FA products during lipolysis that either can directly serve as ligands or can be metabolized to ligands for PPARγ and, thus, mediate adipocyte differentiation, by examining the effects of rosiglitazone in HSL−/− mice.
Rosiglitazone is a synthetic antidiabetic drug that has been shown to increase insulin sensitivity and is a specific ligand for PPARγ [27, 28]. Several lines of evidence show that rosiglitazone exerts its insulin sensitizing effects through activation of PPARγ [2, 5], the master regulator of adipogenesis and lipid metabolism. When rosiglitazone was added to the diets of animals in the current studies, there was a significant increase in body and adipose tissue weights in HSL−/− mice so that the final body weights after a 16 wk diet treatment were the same for HSL−/− and WT mice on a NC diet, although not fully corrected on a HF diet. The increased weight gain appeared to be due to increased food consumption in HSL−/− mice on the NC, but not the HF, diet. Rosiglitazone treatment resulted in an improvement in glucose tolerance in both HSL−/− and WT littermate controls whether on NC or HF diets. This was reflected in a reduction in FFA levels so that concentrations were similar in WT and HSL−/− on both NC and HF diets. In addition, rosiglitazone markedly increased serum adiponectin levels in HSL−/− mice so that values were similar to WT animals. Parallel to these changes, the expression of many of the PPARγ target genes that are involved in adipocyte differentiation, TAG synthesis and lipid metabolism (adiponectin, perilipin, ATGL, PEPCK, ACSL1), which were expressed at lower levels in HSL−/− mice, showed significant increases; however, there appeared to be substantial diet-genotype interactions in gene expression responses to rosiglitazone. Thus, rosiglitazone had minimal effects on the expression of the selected genes examined in WAT of WT mice on a NC diet, with the exception of a substantial increase in ATGL expression. These observations are consistent with recent observations on the effects of rosiglitazone on adipose gene expression in normal rats [29]. Whereas a HF diet tended to reduce the expression of the selected genes in WT mice, rosiglitazone increased their expression in this setting, with the exception of ATGL, which remained low. In contradistinction to WT mice, rosiglitazone increased the expression of the selected genes in HSL−/− mice on both NC and HF diets, although the response on a HF was attenuated. Thus, from serum chemistries to the expression of genes involved in lipid metabolism, a global effect towards normalization was observed with rosiglitazone. Therefore, it appears that the abnormalities seen in adipogenesis and lipid metabolism in HSL−/− mice are corrected, or partially corrected, by stimulation of PPARγ function through the addition of its ligand, rosiglitazone.
Although the identity of the natural biological ligand for PPARγ still remains unsolved, many studies have shown that polyunsaturated fatty acids and related molecules can activate PPARγ [2]. The data presented in figure 6 provide evidence that adipose cells from HSL−/− mice secrete a reduced amount of PPARγ ligands or substrates that can be converted to PPARγ ligands, i.e., pro-ligands, compared to WT and that isoproterenol-stimulated lipolysis fails to increase the release of PPARγ ligands, or pro-ligands, in HSL−/− cells. It is unclear whether the reduced release of PPARγ ligands, or pro-ligands, from HSL−/− cells is due to the decrease in total FFA released during lipolysis or due to the alterations in the species of fatty acids released from HSL−/− adipocytes. Since supplementing rosiglitazone to a NC diet appeared to reverse all of the defects observed in HSL−/− mice, it is tempting to conclude that reduction in PPARγ ligands or pro-ligands is the major defect in HSL−/− mice leading to abnormal adipose cell metabolism. Moreover, it is noteworthy that the metabolic abnormalities in the HSL−/− mice were corrected by rosiglitazone without any discernable change in the increased accumulation of DAG within their adipose tissue. Nonetheless, rosiglitazone supplementation to a HF diet resulted in only partial normalization in HSL−/− mice of previously abnormal WAT gene expression, serum chemistries, organ and body weight changes. Although DAG accumulation tended to be increased by a HF diet in both WT and HSL−/− mice, this did not reach statistical significance and suggests that other abnormalities might be exaggerated under conditions of HF feeding that might contribute to the abnormalities in adipose metabolism observed in HSL−/− mice. Certainly, HSL is known to hydrolyze retinyl esters [30], and it has been suggested that disruption of retinoid metabolism by HSL deficiency contributes to some of the abnormalities observed in WAT in this setting [31].
In conclusion, we have shown that supplementing rosiglitazone in the diet of HSL−/− mice can reverse the abnormalities in adipogenesis and lipid metabolism associated with the ablation of HSL. These effects appear to be exerted through the normalization of expression of PPARγ target genes involved in adipogenesis, TAG synthesis and lipid metabolism. These results are consistent with the interpretation that HSL can modulate adipose lipid metabolism through providing intrinsic ligands or pro-ligands for PPARγ; however, other defects in HSL−/− mice also appear to contribute to the derangement in adipose metabolism in the setting of a HF diet. Thus, interventions that modulate HSL activity could result in effects on adipogenesis and whole body lipid homeostasis.
Acknowledgments
Grants
Supported in part by the Department of Veterans Affairs (Office of Research and Development, Medical Research Service) and by the National Institutes of Health grant R01 AG028098, who had no roles in the study design, collection, analysis and interpretation of data, writing the report or submission of the paper.
Footnotes
Abbreviations used: ACSL1, acyl coenzyme A synthetase family member 1; ATGL, adipose triglyceride lipase; BAT, brown adipose tissue; DAG, diacylglycerol; FABP4, fatty acid binding protein 4; HF, high fat; HSL, hormone-sensitive lipase; NC, normal chow; PEPCK, phosphoenolpyruvate carboxykinase; TAG, triacylglycerol; WAT, white adipose tissue; WT, wild type.
Publisher's Disclaimer: This is a PDF file of an unedited manuscript that has been accepted for publication. As a service to our customers we are providing this early version of the manuscript. The manuscript will undergo copyediting, typesetting, and review of the resulting proof before it is published in its final citable form. Please note that during the production process errors may be discovered which could affect the content, and all legal disclaimers that apply to the journal pertain.
References
- 1.Chen Z, Torrens JI, Anand A, Spiegelman BM, Friedman JM. Krox20 stimulates adipogenesis via C/EBPbeta-dependent and -independent mechanisms. Cell Metab. 2005;1:93–106. doi: 10.1016/j.cmet.2004.12.009. [DOI] [PubMed] [Google Scholar]
- 2.Krey G, Braissant O, L’Horset F, Kalkhoven E, Perroud M, Parker MG, Wahli W. Fatty acids, eicosanoids, and hypolipidemic agents identified as ligands of peroxisome proliferator-activated receptors by coactivator-dependent receptor ligand assay. Mol Endocrinol. 1997;11:779–791. doi: 10.1210/mend.11.6.0007. [DOI] [PubMed] [Google Scholar]
- 3.Loftus TM, Lane MD. Modulating the transcriptional control of adipogenesis. Curr Opin Genet Dev. 1997;7:603–608. doi: 10.1016/s0959-437x(97)80006-8. [DOI] [PubMed] [Google Scholar]
- 4.Rosen ED. The transcriptional basis of adipocyte development. Prostaglandins Leukot Essent Fatty Acids. 2005;73:31–34. doi: 10.1016/j.plefa.2005.04.004. [DOI] [PubMed] [Google Scholar]
- 5.Rosen ED, MacDougald OA. Adipocyte differentiation from the inside out. Nat Rev Mol Cell Biol. 2006;7:885–896. doi: 10.1038/nrm2066. [DOI] [PubMed] [Google Scholar]
- 6.Farmer SR. Regulation of PPARgamma activity during adipogenesis. Int J Obes (Lond) 2005;29(Suppl 1):S13–16. doi: 10.1038/sj.ijo.0802907. [DOI] [PubMed] [Google Scholar]
- 7.Tontonoz P, Spiegelman BM. Fat and beyond: the diverse biology of PPARγ. Annu Rev Biochem. 2008;77:289–312. doi: 10.1146/annurev.biochem.77.061307.091829. [DOI] [PubMed] [Google Scholar]
- 8.Rosen ED, Walkey CJ, Puigserver P, Spiegelman BM. Transcriptional regulation of adipogenesis. Genes Dev. 2000;14:1293–1307. [PubMed] [Google Scholar]
- 9.Tontonoz P, Hu E, Spiegelman BM. Stimulation of adipogenesis in fibroblasts by PPAR gamma 2, a lipid-activated transcription factor. Cell. 1994;79:1147–1156. doi: 10.1016/0092-8674(94)90006-x. [DOI] [PubMed] [Google Scholar]
- 10.Jenkins CM, Mancuso DJ, Yan W, Sims HF, Gibson B, Gross RW. Identification, cloning, expression, and purification of three novel human calcium-independent phospholipase A2 family members possessing triacylglycerol lipase and acylglycerol transacylase activities. J Biol Chem. 2004;279:48968–48975. doi: 10.1074/jbc.M407841200. [DOI] [PubMed] [Google Scholar]
- 11.Zimmermann R, Strauss JG, Haemmerle G, Schoiswohl G, Birner-Gruenberger R, Riederer M, Lass A, Neuberger G, Eisenhaber F, Hermetter A, Zechner R. Fat mobilization in adipose tissue is promoted by adipose triglyceride lipase. Science. 2004;306:1383–1386. doi: 10.1126/science.1100747. [DOI] [PubMed] [Google Scholar]
- 12.Kraemer FB, Shen WJ. Hormone-sensitive lipase: control of intracellular tri-(di-) acylglycerol and cholesteryl ester hydrolysis. J Lipid Res. 2002;43:1585–1594. doi: 10.1194/jlr.r200009-jlr200. [DOI] [PubMed] [Google Scholar]
- 13.Haemmerle G, Zimmermann R, Hayn M, Theussl C, Waeg G, Wagner E, Sattler W, Magin TM, Wagner EF, Zechner R. Hormone-sensitive lipase deficiency in mice causes diglyceride accumulation in adipose tissue, muscle, and testis. J Biol Chem. 2002;277:4806–4815. doi: 10.1074/jbc.M110355200. [DOI] [PubMed] [Google Scholar]
- 14.Schweiger M, Schreiber R, Haemmerle G, Lass A, Fledelius C, Jacobsen P, Tornqvist H, Zechner R, Zimmermann R. Adipose triglyceride lipase and hormone-sensitive lipase are the major enzymes in adipose tissue triacylglycerol catabolism. J Biol Chem. 2006;281:40236–40241. doi: 10.1074/jbc.M608048200. [DOI] [PubMed] [Google Scholar]
- 15.Haemmerle G, Lass A, Zimmermann R, Gorkiewicz G, Meyer C, Rozman J, Heldmaier G, Maier R, Theussl C, Eder S, Kratky D, Wagner EF, Klingenspor M, Hoefler G, Zechner R. Defective lipolysis and altered energy metabolism in mice lacking adipose triglyceride lipase. Science. 2006;312:734–737. doi: 10.1126/science.1123965. [DOI] [PubMed] [Google Scholar]
- 16.Harada K, Shen W-J, Patel S, Natu V, Wang J, Osuga J-i, Ishibashi S, Kraemer FB. Resistance to high-fat diet-induced obesity and altered expression of adipose-specific genes in HSL-deficient mice. Am J Physiol Endocrinol Metab. 2003;285:E1182–1195. doi: 10.1152/ajpendo.00259.2003. [DOI] [PubMed] [Google Scholar]
- 17.Osuga J, Ishibashi S, Oka T, Yagyu H, Tozawa R, Fujimoto A, Shionoiri F, Yahagi N, Kraemer FB, Tsutsumi O, Yamada N. Targeted disruption of hormone-sensitive lipase results in male sterility and adipocyte hypertrophy, but not in obesity. Proc Natl Acad Sci U S A. 2000;97:787–792. doi: 10.1073/pnas.97.2.787. [DOI] [PMC free article] [PubMed] [Google Scholar]
- 18.Sekiya M, Osuga JI, Okazaki H, Yahagi N, Harada K, Shen WJ, Tamura Y, Tomita S, Iizuka Y, Ohashi K, Okazaki M, Sata M, Nagai R, Fujita T, Shimano H, Kraemer FB, Yamada N, Ishibashi S. Absence of hormone-sensitive lipase inhibits obesity and adipogenesis in Lepob/ob mice. J Biol Chem. 2004;279:15084–15090. doi: 10.1074/jbc.M310985200. [DOI] [PubMed] [Google Scholar]
- 19.Watkins SM, Reifsnyder PR, Pan H-j, German JB, Leiter EH. Lipid metabolome-wide effects of the PPARγ agonist rosiglitazone. J Lipid Res. 2002;43:1809–1817. doi: 10.1194/jlr.m200169-jlr200. [DOI] [PubMed] [Google Scholar]
- 20.Prokocimer PG, Maze M, Vickery RG, Kraemer FB, Gandjei R, Hoffman BB. Mechanism of halothane-induced inhibition of isoproterenol-stimulated lipolysis in isolated rat adipocytes. Mol Pharmacol. 1988;33:338–343. [PubMed] [Google Scholar]
- 21.Shen WJ, Patel S, Yu Z, Jue D, Kraemer FB. Effects of rosiglitazone and high fat diet on lipase/esterase expression in adipose tissue. Biochim Biophys Acta. 2007;1771:177–184. doi: 10.1016/j.bbalip.2006.11.009. [DOI] [PMC free article] [PubMed] [Google Scholar]
- 22.Hertzel AV, Smith LA, Berg AH, Cline GW, Shulman GI, Scherer PE, Bernlohr DA. Lipid metabolism and adipokine levels in fatty acid-binding protein null and transgenic mice. Am J Physiol Endocrinol Metab. 2006;290:E814–823. doi: 10.1152/ajpendo.00465.2005. [DOI] [PubMed] [Google Scholar]
- 23.Arner P, Langin D. The role of neutral lipases in human adipose tissue lipolysis. Curr Opin Lipidol. 2007;18:246–250. doi: 10.1097/MOL.0b013e32811e16fb. [DOI] [PubMed] [Google Scholar]
- 24.Zechner R, Kienesberger PC, Haemmerle G, Zimmermann R, Lass A. Adipose triglyceride lipase and the lipolytic catabolism of cellular fat stores. J Lipid Res. 2009;50:3–21. doi: 10.1194/jlr.R800031-JLR200. [DOI] [PubMed] [Google Scholar]
- 25.Fortier M, Wang SP, Mauriege P, Semache M, Mfuma L, Li H, Levy E, Richard D, Mitchell GA. Hormone-sensitive lipase-independent adipocyte lipolysis during beta-adrenergic stimulation, fasting, and dietary fat loading. Am J Physiol Endocrinol Metab. 2004;287:E282–288. doi: 10.1152/ajpendo.00203.2003. [DOI] [PubMed] [Google Scholar]
- 26.Zimmermann R, Haemmerle G, Wagner EM, Strauss JG, Kratky D, Zechner R. Decreased fatty acid esterification compensates for the reduced lipolytic activity in hormone-sensitive lipase-deficient white adipose tissue. J Lipid Res. 2003;44:2089–2099. doi: 10.1194/jlr.M300190-JLR200. [DOI] [PubMed] [Google Scholar]
- 27.Harris PK, Kletzien RF. Localization of a pioglitazone response element in the adipocyte fatty acid-binding protein gene. Mol Pharmacol. 1994;45:439–445. [PubMed] [Google Scholar]
- 28.Lehmann JM, Moore LB, Smith-Oliver TA, Wilkison WO, Willson TM, Kliewer SA. An antidiabetic thiazolidinedione is a high affinity ligand for peroxisome proliferator-activated receptor gamma (PPAR gamma) J Biol Chem. 1995;270:12953–12956. doi: 10.1074/jbc.270.22.12953. [DOI] [PubMed] [Google Scholar]
- 29.Kang JG, Park CY, Ihm SH, Yoo HJ, Park H, Rhee EJ, Won JC, Lee WY, Oh KW, Park SW, Kim SW. Mechanisms of adipose tissue redistribution with rosiglitazone treatment in various adipose depots. Metabolism. 2010;59:46–53. doi: 10.1016/j.metabol.2009.07.004. [DOI] [PubMed] [Google Scholar]
- 30.Wei S, Lai K, Patel S, Piantedosi R, Shen H, Colantuoni V, Kraemer FB, Blaner WS. Retinyl ester hydrolysis and retinol efflux from BFC-1β adipocytes. J Biol Chem. 1997;272:14159–14165. doi: 10.1074/jbc.272.22.14159. [DOI] [PubMed] [Google Scholar]
- 31.Strom K, Gundersen TE, Hansson O, Lucas S, Fernandez C, Blomhoff R, Holm C. Hormone-sensitive lipase (HSL) is also a retinyl ester hydrolase: evidence from mice lacking HSL. Faseb J. 2009;23:2307–2316. doi: 10.1096/fj.08-120923. [DOI] [PubMed] [Google Scholar]