Abstract
Variations in the subject's heart rate and breathing pattern have been shown to result in significant fMRI signal changes, mediated in part by non-neuronal physiological mechanisms such as global changes in levels of arterial CO2. When these physiological changes are correlated with a task, as may happen in response to emotional stimuli or tasks that change levels of arousal, a concern arises that non-neuronal physiologically-induced signal changes may be misinterpreted as reflecting task-related neuronal activation. The purpose of this study is to provide information that can help in determining whether task activation maps are influenced by task-correlated physiological noise, particularly task-correlated breathing changes. We also compare different strategies to reduce the influence of physiological noise. Two paradigms are investigated — 1) a lexical decision task where some subjects showed task-related breathing changes, and 2) a task where subjects were instructed to hold their breath during the presentation of contrast-reversing checkerboard, an extreme case of task-correlated physiological noise. Consistent with previous literature, we find that MRI signal changes correlated with variations in breathing depth and rate have a characteristic spatial and temporal profile that is different from the typical activation-induced BOLD response. The delineation of activation in the presence of task correlated breathing changes was improved either by independent component analysis, or by including specific nuisance regressors in a regression analysis. The difference in the spatial and temporal characteristics of physiological-induced and neuronal-induced fluctuations exploited by these strategies suggests that activation can be studied even in the presence of task-correlated physiological changes.
Introduction
A central challenge in functional magnetic resonance imaging (fMRI) is that the neuronal activity induced blood oxygenation level dependent (BOLD) signal changes are small compared to various sources of noise — including thermal noise, scanner instabilities, subject motion, and the subject's respiration and heart beat. The pulsation of the blood, for example, causes in-flow effects leading to signal changes throughout gray matter with the largest signal changes near large vessels and highly vascular regions (Biswal et al., 1996; Dagli et al., 1999; Glover et al., 2000; Lund et al., 2006). The movement of the chest during respiration causes magnetic field changes which can distort the acquired images, particularly in inferior regions and edges of the brain, as well as the CSF (Brosch et al., 2002; Raj et al., 2001). In addition to these fluctuations occurring at the cardiac and respiratory frequencies (approximately 1 Hz and 0.3 Hz, respectively) and their harmonics, slower fMRI signal changes can be induced by variations in cardiac rate (Bianciardi et al., 2008a, 2008b; Chang et al., 2009; Shmueli et al., 2007). The respiration variation induced changes are believed to be mediated in part by changes in arterial levels of CO2, a potent vasodilator. This effect can be most clearly seen in response to a breath-holding challenge, where even a brief breath hold can result in a signal increase of several percent (Abbott et al., 2005; Kastrup et al., 1999a, 1999b; Stillman et al., 1995; Thomason et al., 2005). However, even subtle changes in breathing depth and rate, which occur naturally during rest at very low temporal frequencies (~0.03 Hz) (Van den Aardweg and Karemaker, 2002), can lead to significant signal changes (Bianciardi et al., 2008a, 2008b; Birn et al., 2006; Chang et al., 2009; Wise et al., 2004). Such fluctuations can either mask, or appear similar to, BOLD signal changes induced by neuronal activity. These findings therefore raise a concern for fMRI, particularly for studies where heart rate or breathing changes are associated with the task, as may be seen in some cognitive tasks or in response to some emotional stimuli. The focus of the study presented here is to investigate the issue of task-correlated breathing changes.
The influence of physiological fluctuations has been a particular focus in studies of “functional connectivity,” a technique that attempts to derive information about functional connections in the brain based on the correlation of time series fluctuations between different regions of the brain. Networks of brain regions could be falsely identified as functionally connected based on the similarity of cardiac- or respiratory-induced fluctuations to brain activation related changes. Care must therefore be taken in these studies to remove the influence of physiological noise.
In contrast to investigations of functional connectivity, the role of physiological noise in task activation studies has generally been of little concern, except in studies of regions known to be severely affected, such as the brain stem (Guimaraes et al., 1995). On average over the whole brain, cardiac and respiratory fluctuations account for less than 10% of the noise (Bianciardi et al., 2008a, 2008b; Shmueli et al., 2007). Likely because of this relatively small increase in noise, many researchers do not expend the additional time and effort to monitor and correct for physiological changes. While this does improve statistical power, others improve their statistics by increasing the amount of data acquired from each subject, or by including more subjects in the analysis.
A potentially more serious problem, however, occurs when the heart beat and respiration changes are correlated with the task. The concern is that blood flow and blood oxygenation changes induced by variations in the heart rate or breathing rate and depth, and mediated by non-neuronal mechanisms such as changes in the levels of arterial CO2, may be mistaken for neuronal-induced signal changes. Furthermore, the additional noise cannot be reduced by averaging more data. In fact, with averaging, these artifactual effects can increase. The correlation of physiological changes with the task cannot always be avoided. For example, tasks which are cognitively demanding, requiring focused or sustained attention, or emotional stimuli are likely to cause changes in breathing and heart rate. These changes are frequently used as behavioral measures (e.g. Lane et al., 2009; Napadow et al., 2008).
Previous studies have investigated the spatial and temporal patterns of respiration induced signal changes, and its influence on functional connectivity (Birn et al., 2006, 2008a,b). In this study, we focus on the special case were the physiological noise is task-correlated. The goal of this study is to provide information that can help in determining whether or not task activation maps are influenced by task-correlated physiological noise, particularly task-correlated breathing changes, and to compare various strategies of dealing with this noise. Based on previous research, our hypothesis is that respiration-induced signal changes can be identified and distinguished from neuronal-induced BOLD signal changes because of differences in the spatial and temporal characteristics. We therefore compare various strategies that aim to exploit this difference in order to reduce the detrimental influence of physiological noise on two different data sets. The first data set involves a lexical decision making task, where some subjects showed task-correlated respiration changes. In the second data set, subjects were instructed to hold their breath during a presentation of a contrast-reversing checker-board. This second data set was collected in order to test our methods for separating task correlated physiologic effects from activation for a more extreme case of task-correlated physiological noise.
Methods
Subjects and imaging parameters
In the first part of this study, we used data acquired from 10 healthy right-handed adult volunteers (ages: 21–44 yrs, average age 30.8±8.2 yrs). The Institutional Review Board (IRB) of the National Institute of Mental Health approved the protocol, and all subjects provided informed consent. Other analyses of this data were previously published in Birn et al. (2006, 2008a,b). Time series of T2*-weighted echo-planar MR images were acquired on a 3 T General Electric (GE) HDx MRI scanner (Waukesha, WI, USA) using an 8-channel GE receive coil with whole body RF excitation. Whole brain coverage was achieved using 27–28 sagittal 5 mm thick slices. (TR: 2000 ms, TE: 30 ms, 90 degree flip angle, FOV: 24 cm, slice thickness: 5 mm, matrix: 64 × 64, 165 image volumes per time series.)
In the second part of this study, data were acquired from 8 healthy adult volunteers (ages: 22–43 yrs, average age 28.7±7.1 yrs). Time series of T2*-weighted echo-planar MR images were acquired on a 3 T General Electric (GE) HDx MRI scanner (Waukesha, WI, USA) using an 16-element receive-only brain array coil with whole body RF excitation. Whole brain coverage was achieved using 27 sagittal 4 mm thick slices. (TR: 2000 ms, TE: 30 ms, 90 degree flip angle, FOV: 24 cm, slice thickness: 5 mm, matrix: 64 × 64, 150 image volumes per time series.) In both parts of the study, a high resolution anatomical image was acquired using a T1-weighted Magnetization Prepared Rapid Gradient Echo (MP-RAGE) sequence.
Physiological data were recorded during each scan using a pulse-oximeter placed on the left index finger and a pneumatic belt positioned at the level of the diaphragm. These two physiological monitoring devices are an integrated part of the General Electric MR scanner (Waukesha, WI), and are recorded to a text file with 25 ms sampling period by changing a manufacturer supplied control variable on the MR console. The measurement obtained from the respiration belt was determined to be linearly related to the expansion of the belt.
Task paradigms
For the first data set, 8 imaging time series (runs) were acquired from each subject. In two 5.5 min runs, subjects performed a lexical decision task, where either words or “non-words” (a string of pronounceable letters that do not form an English word) were presented visually, and the subject's response (word or non-word) was recorded using a button press. The task was presented in a blocked design (30 s task blocks alternated with 30 s of rest) with words or non-words presented every 2 s during the task block. In two additional 5 min time series, subjects rested with their eyes closed (‘Rest’). In the other runs, subjects performed additional cued breathing tasks that are not analyzed in this study. Each of these resting time series was repeated twice. A subset of 8 subjects also performed a breath-holding task (5 min 40 s in duration) consisting of 20 s breath hold at the end of expiration alternated with 40 s of normal breathing.
For the second data set, subjects performed 3 types of tasks. In one run, subjects passively viewed a contrast reversing checkerboard which was presented using rear screen projection in a block design fashion 30 s OFF (gray fixation)/20 s ON (‘Visual Only’). The subjects were asked to fixate on a cross in the center of the screen. In another run, subjects were instructed to perform a breath holding task (‘Breath-Hold Only’). This consisted of a 30 s countdown presented centrally, together with paced breathing instructions — that is, the words “Breathe In” and “Breathe Out” displayed in the center of the screen, each lasting 3 s. When the countdown reached zero, the word in the center of the screen changed to “Breath Hold”, and the subjects were asked to hold their breath for 20 s, again with a similarly presented countdown. The task was timed to present “Breath Out” directly before the “Hold Breath” instruction so that breath holding occurred after expiration. In a third run, subjects performed the breath-holding in synchrony with the presentation of the contrast-reversing checkerboard (‘Vis + BH’). Other phases of visual stimulation to breath-holding were also performed, but are not analyzed here. The order of the runs was randomized across subjects. Each of the runs was 5.5 min in duration.
Analysis
Image analysis was performed using AFNI (Cox, 1996). For both data sets of the study, reconstructed images were first corrected for motion using a rigid-body volume registration. Fluctuations at the primary cardiac and respiratory frequencies, and their harmonics, were then reduced using the RETROICOR routine (Glover et al., 2000), adapted as a Linux command line script invoking AFNI's deconvolution routine. This technique is similar to those developed earlier by Josephs et al. (1997) or X. Hu et al. (1995). It does not simply filter out a prescribed range of frequencies, but rather corrects the signal based on the phase of the cardiac and respiratory cycle in which each image was acquired. This technique can therefore reduce cardiac and respiratory fluctuations occurring at approximately 1 Hz and 0.3 Hz, respectively, even when the data is not critically sampled (e.g. using a 2 s TR). It does not, however, remove the slower signal changes induced by breath-to-breath variations in the depth and rate of breathing, or changes induced by the variability of the heart rate. Signals were then converted to percent signal change by dividing each voxel's time course by the mean signal across time and multiplying the result by 100.
Lexical task
Functional activation maps were computed from the lexical task time series by computing the regression of each voxel's fMRI response time course with an ideal response function consisting of a Gamma-variate function convolved with the blocked design stimulus timing. Changes in the respiration volume per time (RVT), which reflect changes in the envelope of the respiration changes as well as the rate of breathing, were estimated in a manner similar to that described by Birn et al. (2006) and Birn et al. (2008a,b). In brief, we first determined from the respiration belt measurement, the time and value (reflecting the amount of expansion of the respiration belt) of each maxima and minima. The series of maxima was then each interpolated to integer multiples of the TR. The series of minima was interpolated in the same way. The respiration period was determined by subtracting the time between successive maxima, and again this series of respiration periods was interpolated to integer multiples of the imaging TR. The time series of RVT changes was then computed by subtracting the minima from the maxima and dividing by the period for each time point (at integer multiples of TR). The influence of these RVT changes during the lexical task was computed by fitting a time-shifted version of the RVT time course to each voxel time series. That is, the regression was repeated 31 times, once for each shift of the RVT regressor, from 0 s to 30 s in 1 s increments. This was done to allow for a variability in the latency of the respiration-induced signal change across the brain or across subjects. Increases in respiration depth or rate typically result in MR signal decreases. Therefore, for each voxel, the shift that resulted in the largest negative fit (t-statistic) was chosen. This regression analysis was performed twice — once by modeling only the RVT, and another time by modeling the RVT in addition to the ideal task-related response. The t-statistics of the fit to the ideal task regressor and the fit to the RVT were converted to Z-scores, transformed to Talairach space, and averaged across subjects. In addition, a random effects analysis was performed by computing an unpaired one sample t-test of the activation amplitudes (relative to baseline) from each subject. No spatial smoothing was performed on the datasets. The correlation between the RVT regressor and the task was computed for each subject. The variability of the RVT across time was assessed by computing its temporal standard deviation.
For further analyses of the time series and statistics, four regions of interest were defined. The first two regions of interest consisted of areas significantly activated (‘Act’) or deactivated (‘Deact’) in the brain in response to the lexical task, based on a fixed effects group analysis (group average Z-score > 2.0). A third region of interest consisted of areas significantly correlated with RVT changes during the resting runs (‘RVT’) (group average Z-score > 3.5). Finally, a fourth region of interest was defined as those areas part of the RVT mask, but not part of the Act or Deact masks (‘RVT-noAct’). Time series from the lexical and breath-holding tasks were averaged over each region of interest and across subjects. In addition, the amplitude and t-statistics of the fit of the lexical task regressor and the RVT regressor to the lexical task time series were averaged over the regions of interest and across subjects.
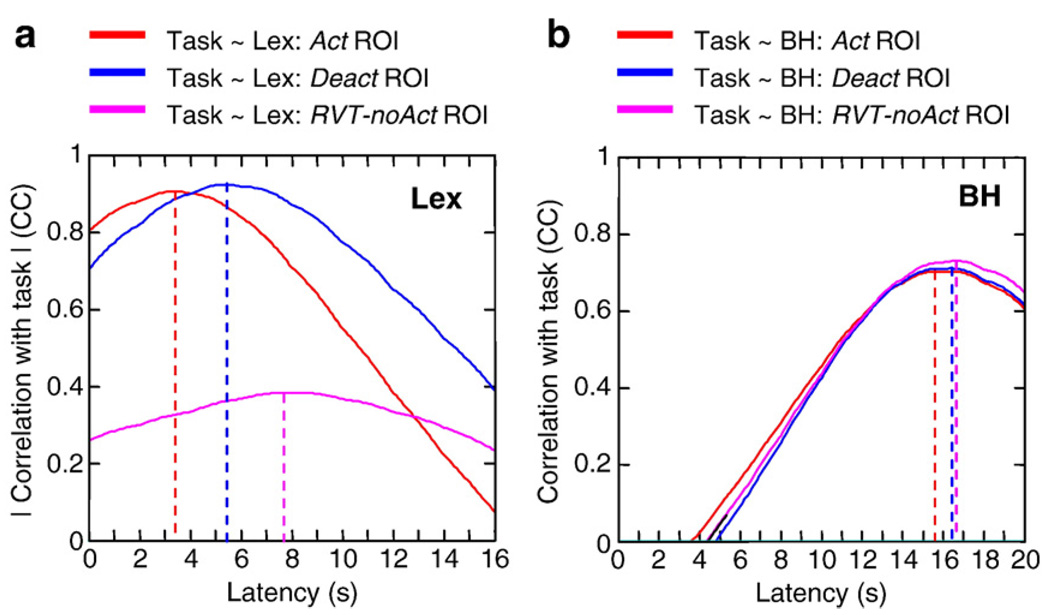
Next, we computed the cross-correlation function between an ideal boxcar reflecting the task timing, and the signal intensity time course from the lexical task averaged over 3 different ROIs — Act, Deact, and RVT-noAct. Similarly, we computed the cross correlation function between the ideal timing of the breath-hold (performed in the lexical task study) and the average breath-hold response across subjects, again for each of the 3 ROIs. This cross correlation function was computed by shifting the ideal boxcar (representing either the lexical task timing or the breath-holding task timing) in 0.1 s increments from 0 s to 16 s for the lexical task, and from 0 to 20 s for the breath-holding task.
Visual stimulation and breath-holding
Functional activation maps from the contrast-reversing checkerboard stimulus were obtained by computing the regression of each voxel time series with an ideal response consisting of the task timing convolved with a gamma-variate hemodynamic response function. In the first analysis (Fim0), only the ideal task response (ideal*gamma-variate) was modeled. In a second regression analysis (FimRRF), two regressors were included — one modeling the task timing convolved with the gamma-variate hemodynamic response function, and a second modeling the task timing convolved with the respiration response function (RRF) (Birn et al., 2008a,b). In a third analysis (FimROI), regressors for the ideal task response and the respiration response were taken from the averaged time courses of the ‘Visual Only’ and ‘Breath-hold Only’ conditions, respectively. A visual cortex ROI was defined by those brain voxels in the ‘Visual Only’ run significantly correlated with the ideal response (the task timing convolved with the hemodynamic gamma-variate response function). The average response to the visual task block was obtained by averaging the signal intensity time course in the ‘Visual Only’ task run across blocks and across this visual cortex ROI. Similarly, the average response to a breath-hold in the visual cortex was obtained by averaging the response to the ‘Breath-hold Only’ task run across blocks and across the visual cortex ROI.
Next, various additional nuisance regressors were computed from the time series data and evaluated in terms of their ability to reduce the effect of task correlated physiological noise.
A global regressor was computed for each run (‘Visual Only’, ‘Breath-hold Only’, and ‘Vis + BH’) by averaging the signal intensity time series across all voxels in the brain. Such a regressor has been used in previous studies in an attempt to reduce the influence of respiration-induced signal changes (e.g. McKay et al., 2003).
A CSF-average regressor was obtained by averaging the signal intensity time series from each run across all voxels identified as containing significant contribution from CSF. This identification was performed automatically in each subject by comparing the first echo planar image to the last image in the time series, providing a rough T1-map. This T1-map was thresholded to provide masks for CSF, white matter, and gray matter (Bodurka et al., 2007).
Finally, the voxel time series with the highest standard deviation over time, and located in the brain, was extracted. In 7 out of 8 subjects, this voxel was located in the sagittal sinus. In the remaining subject, the voxel was located at the posterior edge of the brain.
These time series (global, CSF, and highest SD) were each used as additional nuisance regressors in the regression analysis.
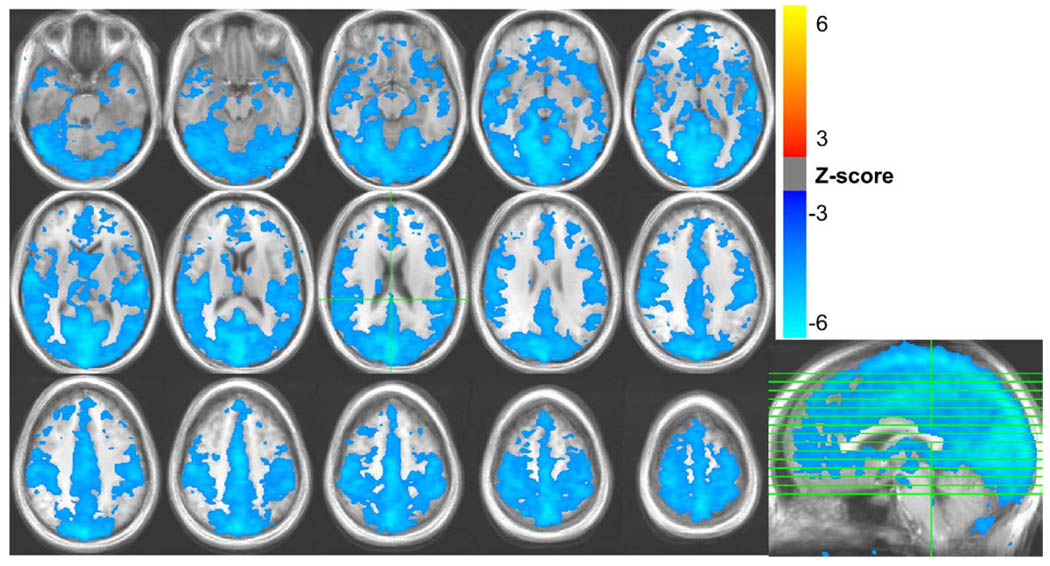
Group independent component analyses (ICA) were carried out separately on the ‘Visual Only’ and the ‘Vis + BH’ fMRI data to investigate whether ICA can distinguish between the visual activation and breathing related changes. Probabilistic Independent Component Analysis (Beckmann and Smith, 2004) was performed with MELODIC (Multivariate Exploratory Linear Decomposition into Independent Components) which is part of the FSL package (www.fmrib.ox.ac.uk/fsl). After transformation into standard space, subject datasets were temporally concatenated together resulting in a single large dataset on which the ICA was performed. Estimated component maps were ordered by comparing their time courses with the expected visual activation response (i.e. the visual timing convolved with a gamma variate). Components relating to visual activity and respiration for both the ‘Visual Only’ and ‘Vis + BH’ were extracted and compared. The component reflecting respiration was chosen based on the qualitative spatial similarity with respiration-induced changes typically observed during rest, as well as those observed in the regression analysis of breath-hold induced changes (e.g. large signal changes in midline brain regions, particularly in the posterior cingulate, occipital cortex, and sagittal sinus — see Fig. 1).
Fig. 1.
Areas with significant signal changes correlated with variations in the respiration volume per unit time (RVT) during rest, averaged over all 10 subjects.
Results
Lexical task
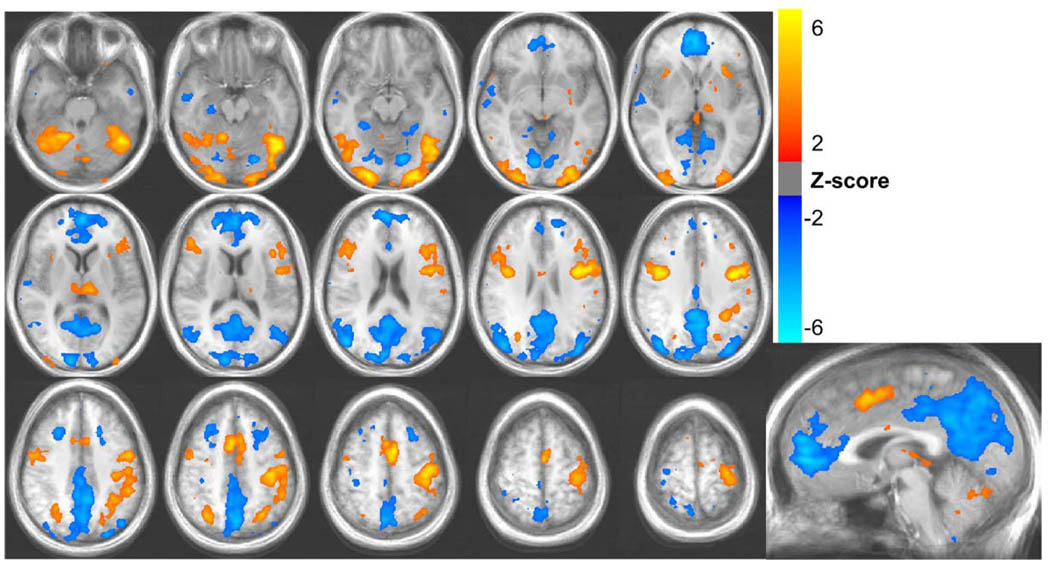
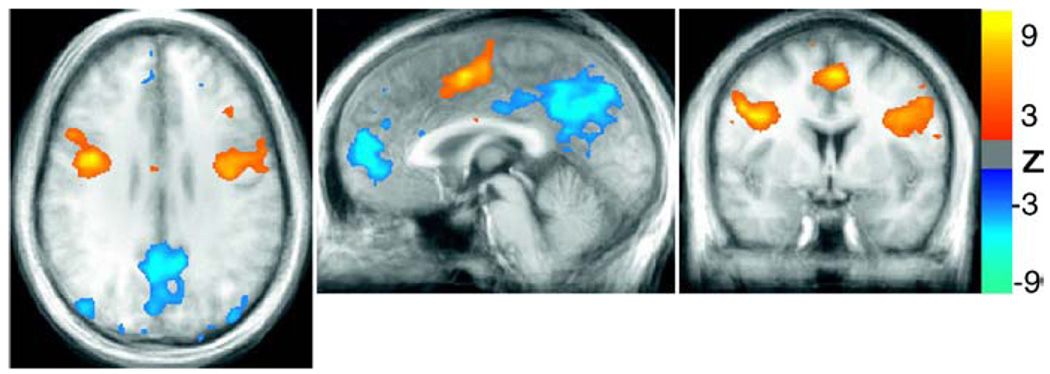
The lexical decision task resulted in activations in the left and right precentral gyrus, middle occipital gyrus, fusiform gyrus, and inferior frontal gyrus (see Fig. 2). Decreases in the fMRI signal during task performance relative to fixation were observed in the anterior cingulate, posterior cingulate, precuneus, and the superior occipital gyrus — areas typically part of the “default mode network.” These areas are believed to be generally more active in the absence of a specific task (i.e. during rest), and deactivated for cognitively demanding tasks (Raichle et al., 2001).
Fig. 2.
Activations (red/yellow) and de-activations (blue) during the lexical task. Average Z-scores from 10 subjects are shown.
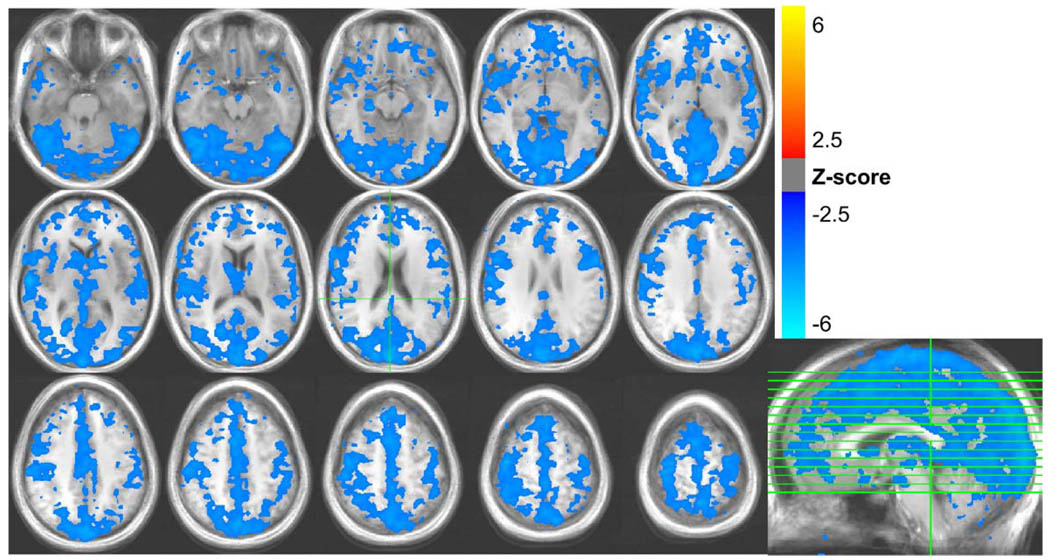
During the lexical runs, the respiration depth varied across time by a mean ± standard deviation of 19.1% ± 8.6%, with a range of 8.7% to 31.9% across subjects The respiration volume per unit time (RVT) varied by an average of 17.5% ± 6.3% with a range of 9.9% to 31.7%. MR signal changes were significantly correlated with RVT changes in expansive regions of gray matter, with the largest regions occurring in the occipital cortex, extending from the medial visual cortex to the posterior cingulate and precuneus; bilateral post-central gyrus; bilateral caudate, bilateral superior temporal gyrus, and the sagittal sinus (see Fig. 3). RVT-related MR signal changes during rest were larger and more extensive, but generally showed a similar spatial pattern (see Fig. 1). RVT changes explained 8.1% ± 4.0% of the variance in the resting runs, and 4.5% ± 1.7% of the variance in the lexical runs. (These values are computed from the R2 statistic of each regressor fit, and reflect the mean and standard deviation across subjects, averaged over regions with significant task-related activation in the lexical task run.)
Fig. 3.
Areas with significant signal changes correlated with variations in the respiration volume per unit time (RVT) during the lexical task, averaged over all 10 subjects.
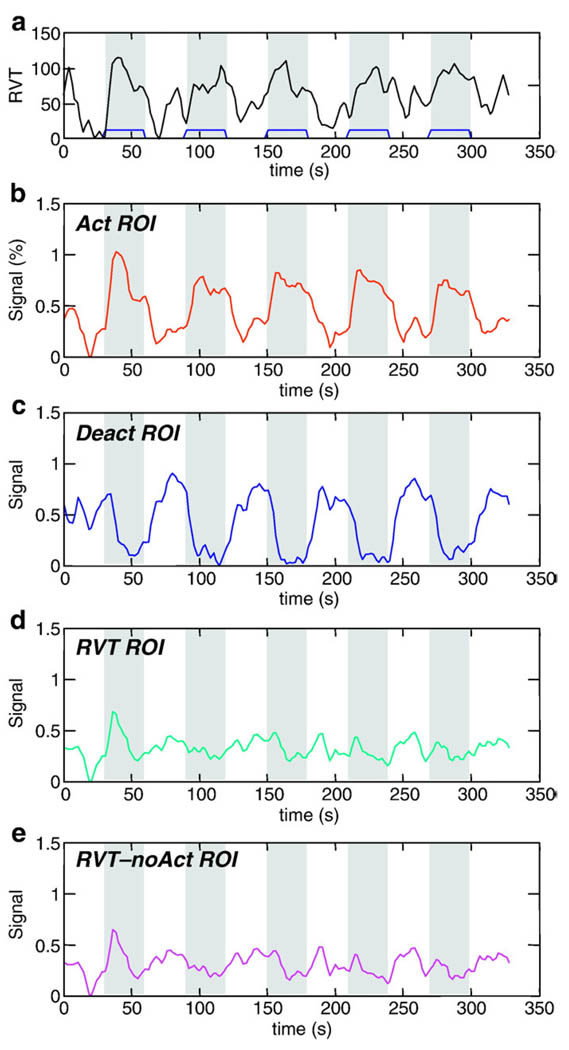
The correlation between the RVT and the task varied across subjects from 0.04 to 0.46. The average RVT time course for the lexical task across all subjects was significantly correlated with the task (CC = 0.59, p < 4 × 10⁻¹⁷) (see Fig. 4a). Figs. 4b–e show signal intensity time courses averaged over all subjects, and over specific regions of interest. ActROI reflects an average over all regions positively correlated with the ideal neuronal BOLD response (i.e. “activated” regions in the group analysis). DeactROI reflects an average over all regions negatively correlated with the ideal BOLD response (i.e. “deactivated” regions in the group analysis). RVT ROI reflects an average over regions with significant RVT-related signal changes. RVT-noAct reflects an average over voxels with significant RVT-related signal changes that were outside of areas either activated or deactivated (positively or negatively correlated with the ideal BOLD response).
Fig. 4.
(a) Time course of respiration volume per time during the lexical task averaged over all subjects. Bottom 4 graphs show signal intensity time courses averaged over all subjects and over different regions of interest: regions with significant (b) activation, (c) de-activation (relative to resting baseline), (d) RVT changes, and (e) RVT changes outside of regions showing lexical activations or deactivations. Times during which the lexical task was performed are indicated in gray.
The average activation map from the five runs (from four subjects) with the highest correlation between the RVT and the task (average correlation: 0.36 ± 0.05) appeared similar to the activation map derived from all 10 subjects (see Fig. 5). No significant differences were found comparing runs with a high correlation between the RVT and task to runs with a low correlation between the RVT and task.
Fig. 5.
Activations (orange) and deactivations (blue) from 5 runs with a relatively high correlation between the RVT and task (average CC = 0.35).
Based on the average RVT and signal intensity time series over all subjects (Fig. 4), RVT-related signal fluctuations appear to be delayed relative to task-related signal changes. The signal intensity time course averaged over the RVT-noAct ROI was delayed by 4.3 s relative to the time course of signal fluctuations averaged over the activated (Act) ROI (see Fig. 6a). Time courses from voxels that were deactivated during the task (part of the Deact ROI) were delayed by 1.9 s relative to voxels that were activated (see Fig. 6a). Regions significantly correlated with RVT (the RVT ROI) overlapped regions that were activated and deactivated during the lexical task (see Figs. 2 and 3). In contrast, the difference in the latencies of the breath-holding response in these regions was less than 1 s (see Fig. 6b).
Fig. 6.
Cross-correlation function between a boxcar representing the task-timing and the signal intensity time course from the lexical task (left) and the breath-holding run (right) averaged over all subjects and various regions of interest: Act ROI — regions significantly activated during the lexical task (i.e. significantly correlated with the ideal BOLD response); Deact ROI — regions significantly deactivated relative to baseline; RVT-noAct ROI: regions significantly correlated with respiration volume per unit time (RVT) changes during resting runs, but outside of regions activated and deactivated. Note: cross-correlations for the Deact ROI and RVT-noAct ROI are negative, and have been multiplied by − 1 for display.
Visual stimulation and breath-holding
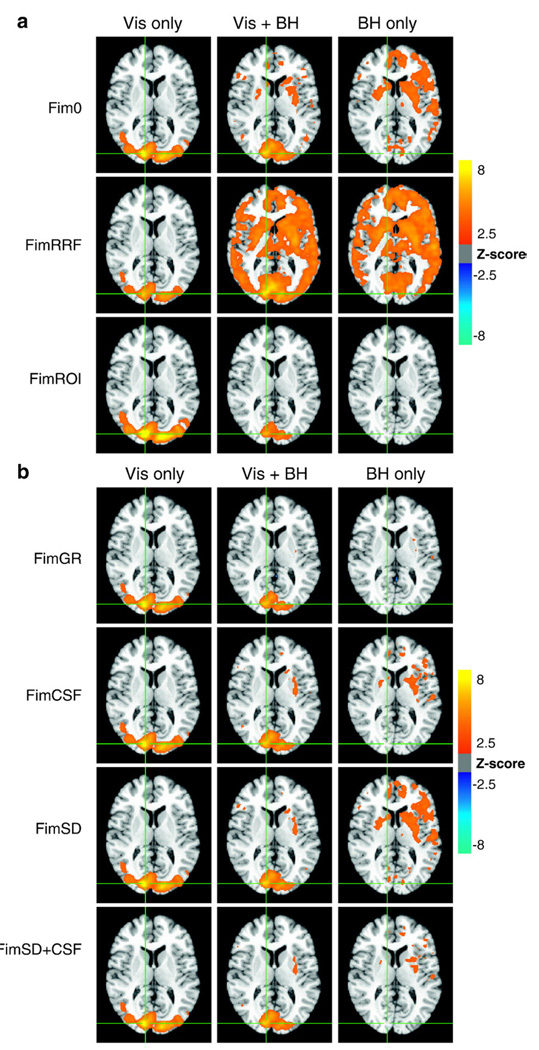
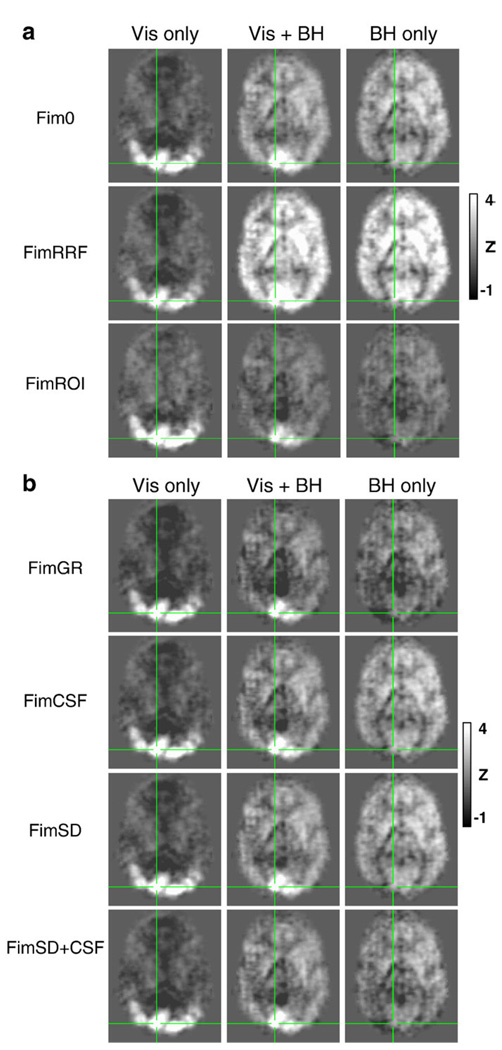
During the breath-holding task, subjects varied their breathing from a normal breathing depth (for 30 s) to holding their breath (for 20 s), which was typically followed by a deeper breath after each breath-hold block. Figs. 7a, b, 8a, and b show the average Z-scores (across all subjects) of the regressor modeling the ideal BOLD response in the Visual Only (Vis only), Vis + BH, and Breath-hold Only (BH only) conditions. ‘Fim0’ reflects the results of a regression analysis when only the ideal gamma-variate for the visual stimulation's BOLD response is used as a regressor. ‘FimRRF’ reflects the analysis results when two regressors are included — a gamma-variate modeling the ideal BOLD response, and the respiration response function modeling the breath-holding induced signal. The Z-score of the fit to the ideal BOLD regressor is shown. In ‘FimROI’, the regressors for the BOLD and breath-holding responses are the stimulus timing convolved with the trial-averaged responses (over the visual cortex and all subjects) from the Visual Only and Breath-hold Only conditions. In Figs. 7b and 8b, various nuisance regressors are included in the regression analysis in addition to the ideal gamma-variate BOLD response — either a global regressor (FimGR), the average signal over all CSF (FimCSF), the voxel time course with the highest temporal standard deviation (FimSD), or both the average CSF signal and the voxel with the highest standard deviation (FimSD + CSF). Again, the Z-scores of the fit to the ideal BOLD regressor are shown.
Fig. 7.
(a) Voxels with significant BOLD signal changes (i.e. the average Z-scores of the regressor modeling the ideal BOLD response) across all subjects during the visual stimulation (Vis Only), combined visual stimulation and Breath-holding (Vis + BH), and Breath-holding (BH only) tasks. Fim0: using only the ideal gamma-variate hemodynamic response typically used to model activation. FimRRF: using a gamma-variate hemodynamic response in addition to the respiration response function (RRF). FimROI: using an averaged response from the Vis Only and BH Only conditions to model the visual activation and respiration-induced changes, respectively. (b) Voxels with significant BOLD signal changes (i.e. the average Z-scores of the regressor modeling the ideal BOLD response) across all subjects during the visual stimulation (Vis Only), combined visual stimulation and Breath-holding (Vis + BH), and Breath-holding (BH only) tasks. In addition to the gamma-variate hemodynamics response function used as an ideal function to model the BOLD response, various nuisance regressors are included. FimGR: global regression. FimCSF: signal averaged over CSF. FimSD: time course from voxel with the largest standard deviation over time. FimSD + CSF: both the signal averaged over the CSF and the voxel time course with the highest temporal standard deviation.
Fig. 8.
(a) Activations shown in Fig. 7a, but without thresholding. Average Z-scores of the regressor modeling the ideal BOLD response across all subjects during the visual stimulation (Vis Only), combined visual stimulation and Breath-holding (Vis + BH), and Breath-holding (BH only) tasks. Fim0: using only the ideal gamma-variate hemodynamic response typically used to model activation. FimRRF: using a gamma-variate hemodynamic response in addition to the respiration response function (RRF). FimROI: using an averaged response from the Vis Only and BH Only conditions to model the visual activation and respiration-induced changes, respectively. (b) Activations shown in Fig. 7b, but without thresholding. Average Z-scores of the regressor modeling the ideal BOLD response across all subjects during the visual stimulation (Vis Only), combined visual stimulation and Breath-holding (Vis + BH), and Breath-holding (BH only) tasks. In addition to the gamma-variate hemodynamics response function used as an ideal function to model the BOLD response, various nuisance regressors are included. FimGR: global regression. FimCSF: signal averaged over CSF. FimSD: time course from voxel with the largest standard deviation over time. FimSD + CSF: both the signal averaged over the CSF and the voxel time course with the highest temporal standard deviation.
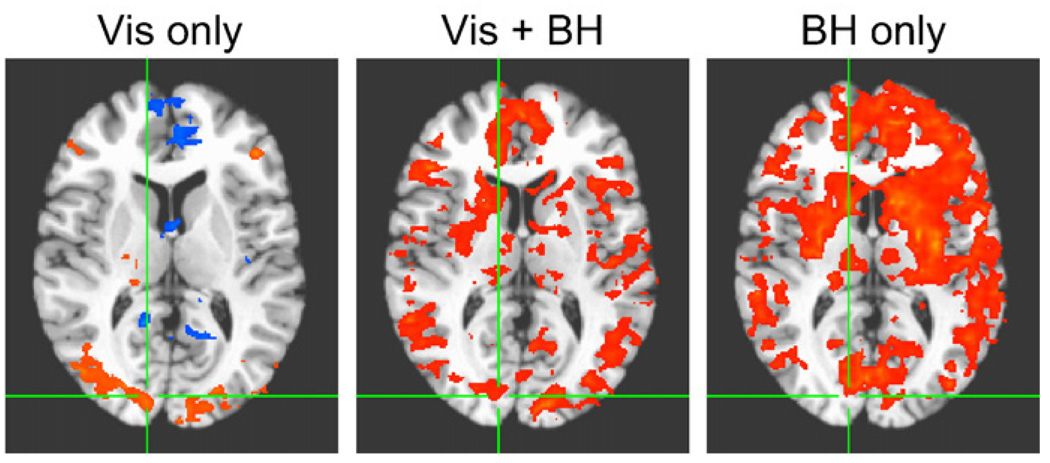
Visual stimulation without concurrent breath-holding resulted in robust task-related signal changes in the visual cortex (see the left columns of Figs. 7a and b). The breath-holding task by itself resulted in significant task-correlated signal changes throughout gray matter. When breath-holding was performed in synchrony with visual stimulation, signal changes significantly correlated with the ideal BOLD response (based on a fixed effects analysis) were located primarily in visual cortex, with some additional signal changes (but less significant) occurring throughout the brain (see the middle columns of Figs. 7a and b). The region identified as “active” in the visual cortex, however, was less extensive than the areas identified as active in the visual only condition. In contrast, a random effects analysis, which used only the amplitude of the fit coefficients from each subject in the second level group analysis, found extensive “activations” throughout gray matter, similar to regions identified in the breath-hold only condition (see Fig. 9).
Fig. 9.
Random effects analysis of signal changes significantly correlated (p < 0.01, corrected) with the ideal BOLD regressor (a gamma-variate response function convolved with the task timing) during visual stimulation alone (Vis only), visual stimulation synchronous with breath-holding (Vis + BH) and breath-holding task alone (BH only). In this random effects analysis, only the amplitudes of the fit to the ideal response are passed to the second level group analysis.
When signal changes during the ‘Vis + BH’ condition were modeled using both the task timing convolved with a gamma-variate and the task timing convolved with the respiration response function (FimRRF), the average Z-score of the fit to the gamma-variate response was significant throughout gray matter, overlapping largely with regions showing RVT-related or breath-hold induced signal changes. Using the averaged time courses from the ‘Visual Only’ and ‘Breath-hold Only’ conditions as the ideal responses for the visual activation and RVT-induced signal changes, respectively, resulted in a better fit. The average Z-score for the visual activation regressor showed the largest activation in medial visual cortex, and less significant “activations” scattered throughout the frontal lobe, slightly better in terms of isolating the visual cortex than using only the gamma variate hemodynamic response in the model.
Adding nuisance regressors to model RVT-related signal changes improved the mapping of visual activation. At the same Z-score threshold as the simple model without any nuisance regressors, global signal regression resulted in less spurious activation in the frontal lobe, and activation more localized to the visual cortex. Using the voxel with the largest temporal standard deviation as a nuisance regressor also resulted in an activation map with fewer voxels significantly with the task outside of the visual cortex. Similar improvement was found when including the CSF regressor. Including both peak standard-deviation and CSF regressors resulted in an even better localization of activation to the visual cortex (see Fig. 7b).
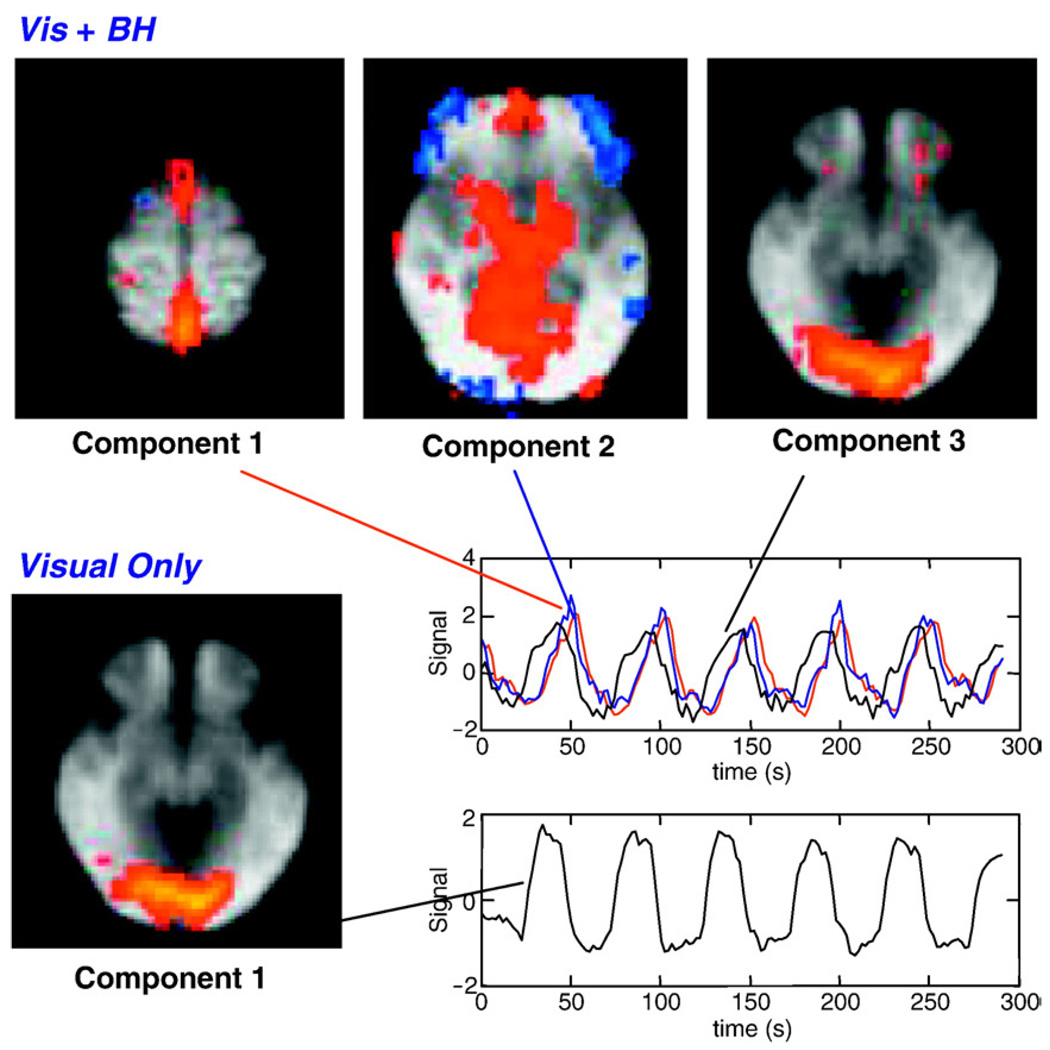
The group ICA produced 53 components for the ‘Visual Only’ condition, and 31 components for the ‘Vis + BH’ conditions. In the ‘Visual Only’ condition, the component explaining the greatest amount of variance (14.65% of the total variance) showed significant signal changes in the visual cortex (see Fig. 10). Additional components appear to reflect signal changes in motor regions, auditory cortex, and default mode network, as well as artifacts due to respiration and motion. In the ‘Visual + BH’ condition, the first two components explaining the greatest amount of variance (10.39% and 6.15% of the total variance for the first and second components, respectively) contained the largest signal changes in the sagittal sinus as well as an expansive midline region encompassing large portions of the cortex including anterior and posterior cingulate. The component explaining the third most amount of variance (5.73% of the total variance) reflected significant signal changes in the visual cortex, almost identical to the region identified in the ‘Visual Only’ condition.
Fig. 10.
Components and associated time courses from a group independent component analysis of all subjects viewing a contrast reversing checkerboard (Visual Only), or viewing a contrast reversing checkerboard while performing a breath-hold synchronous with the visual stimulus (Vis + BH). Two components from the Vis + BH are shown. Component 1 likely reflects respiration induced changes, since these are largest in the sagittal sinus. The time course associated with component 1 (respiration) is delayed relative to the time course associated with component 3 (visual activation). The component reflecting visual activation is highly similar in the presence or absence of task-correlated breath-holding.
Discussion
Changes in the respiration or heart rate that occur during the performance of a task are an important behavioral measure for a variety of studies. In addition, the sites of neural activity changes associated with these physiological changes are of great interest (e.g. Evans et al., 1999; Lane et al., 2009). A potential concern is that respiration or heart rate variations can produce hemodynamic changes that are not induced by the variations in neuronal activity. For example, changes in the depth or rate of breathing can lead to changes in arterial levels of CO2, which influences the blood flow throughout the brain, and particularly in regions with a high baseline blood volume (Wise et al., 2004). When these changes are task correlated, the induced signal changes could be mistaken for neuronally-induced task activations. Previous studies of the hemodynamic effects of heart rate variability and respiration changes, as well as the experiments and analyses in this study, however, suggest ways in which these artifactual signal changes may be detected and perhaps reduced.
Identifying the influence of task-correlated physiological noise
Both respiration related signal changes, as well as heart-rate variability related signal changes, have characteristic spatial patterns (Birn et al., 2006; Chang et al., 2009; Shmueli et al., 2007; Wise et al., 2004). Signal changes correlated with variations in the respiration volume per unit time, for example, occur throughout gray matter, with the largest signal changes occurring in the occipital cortex including the cuneus, precuneus, posterior cingulate, medial visual regions, as well as the sagittal and transverse sinuses. This pattern is observed in response to a variety of cued breathing variations (Birn et al., 2008a,b) including breath-holding (Abbott et al., 2005; Kastrup et al., 1999a, 1999b; Stillman et al., 1995; Thomason et al., 2005), as well as more natural, uncued, breathing variations occurring during rest (Birn et al., 2006; Wise et al., 2004) (Fig. 1) or during the lexical task (Fig. 3). It likely reflects the spatial heterogeneity in the underlying amount of resting blood volume, which is largest near draining veins and in the sinuses, as well as the primary sensory (visual, motor, and auditory) cortexes (Kastrup et al., 1999a, 1999b; Lierse,1963). An activation map that matches this pattern, or one that shows widespread bilateral activation throughout gray matter, is therefore suspect, and should be examined more carefully. In contrast, an activation map that shows significant and focal signal changes, particularly if these are outside of the regions characterized by the largest respiration related signal changes, is less likely to be the result of the global hemodynamic changes induced by respiration changes.
For the lexical task, no significant differences were found between runs with a high correlation of the RVT and the task and those with a low correlation of the RVT and task. However, this comparison is based on a limited number of runs with either a high or low correlation between the RVT and task, and may therefore not have the power to definitively establish a difference. It should be noted, though, that even in subjects with a relatively high (0.35) correlation between the respiration and the lexical task, the activations and deactivations were focal and occurred in regions distinct from those most strongly correlated with RVT changes during rest. Task-correlated signal changes, for example, were not observed in the sagittal sinus — a region that was consistently and strongly correlated with RVT changes. It is therefore possible that subjects whose breathing depth or rate was correlated with the task focused more on the task, thereby resulting in greater activation, outweighing any artifactual (non-neuronal) signal modulations induced by the breathing variation. While speculative, this preliminary finding suggests that task-correlated variations in RVT are more indicative of behavior (and the BOLD changes associated with that behavior), rather than an artifact (e.g. a global signal modulation throughout gray matter induced by varying arterial CO2).
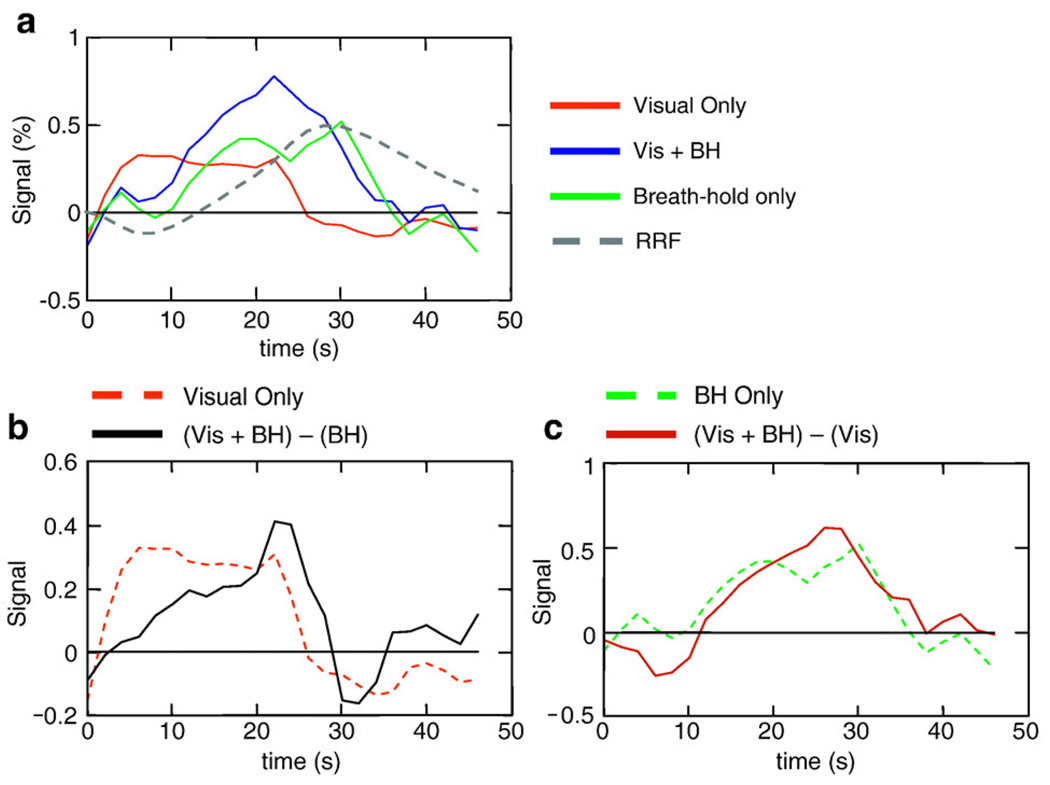
Signal changes related to respiration (RVT) signal changes also appear to differ from neuronal-induced signal changes in their temporal dynamics. In our task where subjects either viewed a contrast-reversing checkerboard, held their breath, or both, the breath-hold induced signal changes were significantly slower than the typical BOLD response to activation (see Fig. 11). This is consistent with previous studies showing slower respiration-induced signal changes (Bianciardi et al., 2008a, 2008b; Birn et al., 2008a,b; Chang et al., 2009), where the largest peak of the “respiration response function” occurred at 16 s. In contrast, the peak of the typical BOLD impulse response occurs around 4–5 s. Largely because of this difference in latency, a naïve analysis of the Visual + Breath-hold task – an extreme case of task correlated breathing changes – using only the typical ideal BOLD response still identified activation in the visual cortex and had relatively little false positive activation outside of the visual cortex (Fim0 in Fig. 7a). The extent of the identified activation, however, was reduced with only the more medial visual regions passing the significance threshold. The detection of activation in the more lateral regions of the visual cortex, which were clearly active in the ‘Vis Only’ condition, may have been hampered by the large respiration-related signal fluctuations. While the respiration-related changes did occur at a different latency than the ideal task-related response and therefore did not strongly affect the number of false positives, the additional respiration-related signal variations do increase the noise and therefore reduce the detection power of true activation. An alternative, but perhaps unlikely, explanation is that the combination of performing a breath-holding task while viewing a contrast-reversing checkerboard altered pattern of brain activity in the visual cortex.
Fig. 11.
(a) Average time courses for visual only, Vis + BH, and Breath-hold only conditions, averaged over all subjects and over the visual cortex. (b) The difference between the combined visual stimulation + BH response and the Breath-hold Only response (solid black line) compared to the Visual Only response (dashed red line). (c) The difference between the combined visual stimulation + BH response and the Visual Only response (solid black line) compared to the Breath-hold Only response.
The relatively small number of false positive activations seen when using only the gamma-variate regressor (Fim0) is due in part because the significance of the fit (a t-statistics, transformed to a Z-score) was used for the group level analysis. A random effects analysis that only uses the amplitudes of the responses at the group level does not fare as well. While respiration induced changes are delayed, they are not orthogonal to task related neuronal-induced changes. Therefore, the ideal BOLD regressor still fits respiration-induced changes to a certain degree. In a fixed effects analysis (i.e. when using the statistics of the fit), these regions are not considered “active”, since the residual error (from the fit of the ideal BOLD regressor to the respiration) is high. A random effects analysis that uses only the amplitudes of the response at the group level, however, still shows these areas as “active” since the amplitude of the erroneous fit was similar across subjects.
The response to breath-holding is clearly different than the response to task activation, but it is perhaps an extreme example of a breathing change that might occur in synchrony with a task. Does the difference in the latency of the responses hold for more subtle variations in breathing? One of our previous studies, for example, found that the signal changes related to more natural breathing changes, such as those occurring during rest or during the lexical task, appear to be slightly faster than the cued breath-holding induced signal changes, with a maximal correlation when the RVT time course was shifted by 8 s (or when a gamma-variate typically used to model activation-induced BOLD changes was shifted by 3 s) (Birn et al., 2008a,b). In contrast, a recent study by Chang et al. found that the respiration response function convolved with either the standard deviation of the breathing trace or the RVT time course fit well to signal changes measured during rest (Chang et al., 2009). The source of the difference between these results is unclear. However, the latency of the respiration related signal changes during rest, even though it may be faster than cued-respiration induced signal changes, is still slower than a typical neuronal-induced BOLD response.
While subjects had a range of correlation between their RVT changes and the task timing (CC = 0.04–0.46), the averaged RVT time course across all subjects was highly correlated with the task (CC = 0.6). The reason for this high correlation is that the common temporal feature across all subjects is the task timing. Task-unrelated RVT-induced signal changes occur at different phases for different subjects and are therefore averaged out, while task correlated breathing changes survive. This allows us to study the spatial and temporal characteristics of the task-related component of the RVT changes. The time series from the lexical task averaged over the RVT-noAct ROI was delayed by 4.3 s relative to the time series averaged over activated regions (the ‘Act’ ROI). The time series averaged over deactivated regions (the ‘Deact’ ROI) was delayed by 1.9 s relative to the activated regions. That is, the latency is between that of “activated” regions and regions influenced by RVT. These deactivated regions, however, overlapped to a large degree with RVT-related changes, and it is therefore possible that the latency in these regions reflects the dynamics of more rapid deactivations occurring on top of slower respiration-related signal changes. An additional explanation for the difference in latency between these regions is a difference in the underlying hemodynamics. For example, the RVT-noAct ROI could contain a greater proportion of large vessels, and the signal changes in these regions therefore merely reflect a delayed neuronally induced BOLD response. However, the latency of the breath-hold response was not significantly different between these three large ROIs, ruling out any significant hemodynamic variations.
Potential strategies to reduce the influence of task-correlated physiological noise
A common approach to reducing the influence of undesired fluctuations (“noise”) in time series is to include a model for these fluctuations in the analysis, for example as nuisance regressors. For task-correlated respiration changes, this strategy relies on exploiting the differences in the temporal dynamics of the respiration-induced and neuronal-induced responses.
In this study, we examined an extreme case of task-correlated breathing changes, where subjects held their breath during visual stimulation, and we explored various ways to model this task-correlated respiration-related “noise.” Including an ideal model of the respiration induced changes (the task timing convolved with the respiration response function published previously) into the analysis improved the overall fit, but the t-statistic of the ideal BOLD regressor was significant throughout gray matter, in regions that also showed large breath-hold induced changes (FimRRF in Figs. 7a and 8a). In other words, including a regressor based on the respiration response function into the model did not improve the mapping of task-related activation; rather, it appears to have made things worse. The likely reason for this is that the respiration response function that was used does not accurately model the breath-hold induced response in this study. Breath-hold induced changes in the visual cortex, as well as the average response across the entire brain, appear to be slightly faster in this study than the changes predicted by the respiration response function (see Fig. 11). This could be due to inter-subject variability, or the way in which the breath-hold was performed. In this study we used a breath-holding paradigm with cued breathing during the non-breath-hold interval, rather than uncued free breathing (“rest”), as used in previous studies. This shift in latency can be modeled by adding a faster gamma-variate response to the slower respiration response function. In other words, the sum of the modeled regressors for the respiration-induced changes and the BOLD activation, both of which are task correlated but at different latencies, results in a shifted task-correlated response. This is analogous to the way that the sum of a sine and a cosine results in a phase-shifted sine (or cosine). Adding some multiple of the gamma-variate response can therefore account for errors in the model of respiration-related changes. For this reason, the t-statistic of the gamma-variate regressor (when included in the model with the respiration response regressor) is significant in areas outside the visual cortex (for the ‘Vis + BH’ condition), and throughout the brain during the Breath-hold Only condition, when no visual stimulus was shown. When we used the averaged responses to the Breath-hold Only and Visual Only conditions to model the respiration and activation-related signal changes, respectively, the fit was considerably improved and the neuronally induced activation was better localized (FimROI in Fig. 7a). This again suggests that the problems in the earlier ideal modeling of respiration changes resulted from an inaccurate response function. It also shows that a more accurate model of respiration-induced changes can significantly reduce the artifacts induced by task correlated breathing. Adding the derivative of a response can usually account for variations in the latency. However, in this case (where respiration is task correlated), the derivative of the respiration response is highly collinear with a linear combination of the modeled respiration and BOLD responses.
These findings show that reducing the influence of task correlated respiration changes by nuisance variable regression is highly sensitive to the latency of the modeled response, highlighting the need for an accurate model of respiration-induced changes. This issue arises particularly when the nuisance regressors are task-correlated and differ from the regressor of interest primarily by a latency shift. In studies where respiration changes are not correlated with the task, errors in the latency or shape of the modeled respiration-related response would simply reduce the effectiveness of removing a source of noise, thereby increasing the likelihood of false negatives. However, when respiration changes are correlated with the task, an inaccurate estimate of the latency and shape of the respiration induced response can result in residual respiration-related changes being accounted for by the ideal BOLD regressor. Obtaining measures of the BOLD signal and respiration changes in isolation, as done here in the Breath-hold Only and Visual Only conditions, is unfortunately not possible for most tasks involving task correlated breathing changes. In addition, task correlated breathing fluctuations that occur during more typical tasks (e.g. emotional stimuli, or cognitively demanding tasks) can be slightly different than a cued breath-hold, perhaps closer to the more natural breathing fluctuations occurring during rest. The resulting respiration induced signal changes responses could also vary across the brain or across subjects. All of these variations would need to be accounted for in an ideal model of respiration-induced changes. An alternative approach is to estimate nuisance parameters from the data itself, such as regressing out the average signal from the CSF, the sagittal sinus, or the global signal.
Including the global signal as a nuisance regressor (sometimes referred to as “global signal regression”) resulted in an average Z-statistic group maps that showed fewer significant task-related signal changes outside of the visual cortex, and therefore appeared to at least partially correct for respiration related changes. However, interpretation of activation when global signal regression is performed can be problematic since the effect of interest, as well as possibly other neuronal fluctuations, is part of the global signal (Aguirre et al., 1998; Murphy et al., 2009). In particular, regions showing a negative correlation with the task after global signal regression do not necessarily reflect a “deactivation”, i.e. decreased signals during the task relative to the control states (Aguirre et al., 1998). Rather, task-related responses after global signal regression reflect the task-related changes around some global modulation.
Including either the average CSF signal from the ventricles or the voxel with the highest temporal standard deviation as regressors also reduced significant task-correlated changes outside of the visual cortex during the Vis + BH task. Including both CSF and TopSD regressors reduced slightly more of the variance, suggesting that these model slightly different and complementary aspects of the noise. The average correlation between the TopSD and CSF regressors was 0.19 for the Visual Only condition, 0.14 for the Breath-hold Only condition, and 0.51 for the Visual + BH condition. These regressors are also less likely to be influenced by neuronal fluctuations, reducing some of the complications from global signal regression.
Independent component analysis (ICA) is another technique that can exploit the temporal and spatial differences between neuronal activation and respiration-induced signal changes, and is therefore an alternative strategy for dealing with task-correlated physiological noise. This is consistent with our previous finding in resting-state data, where ICA was able to separate, at least to a certain degree, respiration changes from fluctuations in the default mode network (Birn et al., 2008a,b). In our study where subjects held their breath while viewing a contrast reversing checkerboard, an extreme case of a task-correlated respiration changes, ICA identified a component showing visual activation that was almost identical to the task-related component identified in the Visual Only condition, when subject viewed the contrast reversing checkerboard without holding their breath (see Fig. 10). The first two components explaining the most variance in the Vis + BH condition appear to reflect respiration-induced changes. Signal changes were widespread, with large signal change along the midline, particularly in the posterior regions of the brain and the sagittal sinus. The time course associated with these first 2 components showed a clear task-related response, but the signal changes were delayed by several seconds relative to the time course associated with the component showing visual activation (see Fig. 10). This is consistent with the delayed signal changes observed in response to breath-holding (Birn et al., 2008a, b; Li et al., 1999).
A common difficulty with ICA is identifying what physical, physiological, or cognitive process each component represents. In order to help with this identification, one can use additional prior information, such as the task timing. In our study with simultaneous breath-holding and visual stimulation, even though both the activation and physiological changes were task-related, the respiration-induced signal changes were delayed relative to activation induced signal changes. Artifactual respiration-induced signal changes can therefore be separated from activation induced changes based on the differences in their spatial as well as temporal characteristics.
Signal changes induced by variations in the heart-rate also exhibit a characteristic spatial and temporal pattern (Chang et al., 2009; Shmueli et al., 2007). They generally occur throughout gray matter, as well as areas more susceptible to cardiac pulsations, such as CSF and large vessel. Previous studies of the latency of these heart-rate variability induced changes, however, are somewhat inconsistent. Chang et al. derived a cardiac response function from resting data and found that the response function peaks at 4 s followed by an undershoot at 12 s (Chang et al., 2009). This appears to be similar to neuronal induced BOLD signal changes. In contrast, Shmueli et al. found the highest correlation between the heart rate variability and the MR signal at a shift of 6–12 s (Shmueli et al., 2007). A recent study by Bianciardi et al. finds a maximum in the correlation for shift of both 3 s as well as 15 s (Bianciardi et al., 2008a, 2008b). However, all of these studies report heart-rate variability induced changes occurring throughout gray matter. The best strategy to reduce artifactual signal changes induced by heart rate variability may therefore be to exploit the difference in the spatial pattern of the response, questioning signal changes that occur only near large vessels or globally throughout gray matter.
Conclusions
MRI signal changes correlated with variations in breathing depth and rate have a characteristic spatial and temporal profile that is different from the typical activation-induced BOLD response. Respiration related signal changes are evident throughout gray matter, particularly in the sagittal and transverse sinuses, and regions that have a high baseline blood volume, such as the primary sensory regions. In addition, respiration-related signal changes are delayed relative to activation induced BOLD signal changes. This spatial and temporal pattern can be used as a guide to determine whether a task-related signal change is due to neuronal activation or non-neuronal task-correlated physiological changes.
These observed spatial and temporal differences in the responses to activation vs. respiration variations can be exploited in order to reduce the influence of physiological noise and improve the detection of neuronal activation. In the lexical task, we found no significant activation differences between subjects with low and high task-correlated breathing. However, we cannot rule out that task-correlated breathing changes in other studies with potentially larger respiration changes from emotional or high attention task do not hide or otherwise distort more subtle activations and activation differences. We therefore compared a number of existing and proposed techniques to remove the influence of respiration changes. Each of these techniques has strengths and weaknesses. For example, based on our study, the delineation of activation in the presence of task correlated breathing changes was improved by using ICA to separate the task-activation data into spatially independent components. Signal changes were well localized to expected sites of activation, and were distinct from the more widespread and delayed signal changes related to respiration variations. However, the challenge with ICA is identifying the component reflecting neuronal activation to the task. The spatial patterns of respiration-induced changes presented here, as well as in previous studies (Birn et al., 2006; Chang et al., 2009; Wise et al., 2004), should help in identifying components reflecting respiration-related signal fluctuations. Signal changes induced by respiration variations can also be reduced by nuisance variable regression. Including a regressor to directly model the respiration-induced changes based on the changes in breathing or end-tidal CO2 would be ideal, but further work needs to be performed to fully characterize both the temporal dynamics of un-cued respiration-related signal changes and the spatial heterogeneity of this response. As this study demonstrates, when artifacts are task correlated, removing them via nuisance variable regression is highly sensitive to the accuracy with which these effects are modeled. An alternative approach, therefore, is to derive the nuisance variables directly from the data. Based on our study, regressing out either the global signal or the voxel with the highest standard deviation as well as the average time series across all CSF voxels, improved the localization of function in the presence of strong task-correlated breathing changes. However, regressing out the global signal can alter the activation-induced response (Aguirre et al., 1998), and should therefore be used with caution. Average CSF signals are less likely to be contaminated by task-activation. The underlying difference in the spatial and temporal characteristics of non-neuronal physiologically-induced signal variations and neuronal-induced fluctuations, combined with methods to exploit this difference, suggests that the neuronal activation of tasks with associated physiological changes can indeed be studied.
Acknowledgment
This research was funded by the National Institutes of Mental Health Intramural Research Program.
References
- Abbott DF, Opdam HI, Briellmann RS, Jackson GD. Brief breath holding may confound functional magnetic resonance imaging studies. Hum. Brain Mapp. 2005;24(4):284–290. doi: 10.1002/hbm.20086. [DOI] [PMC free article] [PubMed] [Google Scholar]
- Aguirre GK, Zarahn E, D'Esposito M. The inferential impact of global signal covariates in functional neuroimaging analyses. Neuroimage. 1998;8(3):302–306. doi: 10.1006/nimg.1998.0367. [DOI] [PubMed] [Google Scholar]
- Beckmann CF, Smith SM. Probabilistic independent component analysis for functional magnetic resonance imaging. IEEE Trans. Med. Imaging. 2004;23(2):137–152. doi: 10.1109/TMI.2003.822821. [DOI] [PubMed] [Google Scholar]
- Bianciardi M, Fukunaga M, van Gelderen P, Horovitz SG, de Zwart J, Shmueli K, Duyn JH. ISMRM Workshop: High Field Systems and applications. Rome, Italy: 2008a. Sources of fMRI signal variance in the human brain at rest: a 7 T study. [Google Scholar]
- Bianciardi M, Fukunaga M, van Gelderen P, Horovitz SG, de Zwart JA, Duyn JH. Modulation of spontaneous fMRI activity in human visual cortex by behavioral state. Neuroimage. 2009;45(1):160–168. doi: 10.1016/j.neuroimage.2008.10.034. [DOI] [PMC free article] [PubMed] [Google Scholar]
- Birn RM, Diamond JB, Smith MA, Bandettini PA. Separating respiratory-variation-related fluctuations from neuronal-activity-related fluctuations in fMRI. Neuroimage. 2006;31(4):1536–1548. doi: 10.1016/j.neuroimage.2006.02.048. [DOI] [PubMed] [Google Scholar]
- Birn RM, Murphy K, Bandettini PA. The effect of respiration variations on independent component analysis results of resting state functional connectivity. Hum. Brain Mapp. 2008a;29(7):740–750. doi: 10.1002/hbm.20577. [DOI] [PMC free article] [PubMed] [Google Scholar]
- Birn RM, Smith MA, Jones TB, Bandettini PA. The respiration response function: The temporal dynamics of fMRI signal fluctuations related to changes in respiration. Neuroimage. 2008b;40(2):644–654. doi: 10.1016/j.neuroimage.2007.11.059. [DOI] [PMC free article] [PubMed] [Google Scholar]
- Biswal B, DeYoe AE, Hyde JS. Reduction of physiological fluctuations in fMRI using digital filters. Magn. Reson. Med. 1996;35(1):107–113. doi: 10.1002/mrm.1910350114. [DOI] [PubMed] [Google Scholar]
- Bodurka J, Ye F, Petridou N, Murphy K, Bandettini PA. Mapping the MRI voxel volume in which thermal noise matches physiological noise–implications for fMRI. Neuroimage. 2007;34(2):542–549. doi: 10.1016/j.neuroimage.2006.09.039. [DOI] [PMC free article] [PubMed] [Google Scholar]
- Brosch JR, Talavage TM, Ulmer JL, Nyenhuis JA. Simulation of human respiration in fMRI with a mechanical model. IEEE Trans. Biomed Eng. 2002;49(7):700–707. doi: 10.1109/TBME.2002.1010854. [DOI] [PubMed] [Google Scholar]
- Chang C, Cunningham JP, Glover GH. Influence of heart rate on the BOLD signal: the cardiac response function. Neuroimage. 2009;44(3):857–869. doi: 10.1016/j.neuroimage.2008.09.029. [DOI] [PMC free article] [PubMed] [Google Scholar]
- Cox RW. AFNI: software for analysis and visualization of functional magnetic resonance neuroimages. Comput. Biomed. Res. 1996;29(3):162–173. doi: 10.1006/cbmr.1996.0014. [DOI] [PubMed] [Google Scholar]
- Dagli MS, Ingeholm JE, Haxby JV. Localization of cardiac-induced signal change in fMRI. Neuroimage. 1999;9(4):407–415. doi: 10.1006/nimg.1998.0424. [DOI] [PubMed] [Google Scholar]
- Evans KC, Shea SA, Saykin AJ. Functional MRI localisation of central nervous system regions associated with volitional inspiration in humans. J. Physiol. 1999;520(Pt. 2):383–392. doi: 10.1111/j.1469-7793.1999.00383.x. [DOI] [PMC free article] [PubMed] [Google Scholar]
- Glover GH, Li TQ, Ress D. Image-based method for retrospective correction of physiological motion effects in fMRI: RETROICOR. Magn. Reson. Med. 2000;44(1):162–167. doi: 10.1002/1522-2594(200007)44:1<162::aid-mrm23>3.0.co;2-e. [DOI] [PubMed] [Google Scholar]
- Guimaraes AR, Baker JR, Weisskoff RM. Caridac-gated functional MRI with T1 correction. Proceedings of SMR 3rd Annual Meeting; Nice, France. 1995. [Google Scholar]
- Hu X, Le TH, Parrish T, Erhard P. Retrospective estimation and correction of physiological fluctuation in functional MRI. Magn. Reson. Med. 1995;34:201–212. doi: 10.1002/mrm.1910340211. [DOI] [PubMed] [Google Scholar]
- Josephs O, Howseman AM, Friston KJ, Turner R. Physiological noise modelling for multi-slice EPI FMRI using SPM; Proceedings of the International Society for Magnetic Resonance in Medicine; Vancouver, B.C., Canada: 1997. [Google Scholar]
- Kastrup A, Kruger G, Glover GH, Neumann-Haefelin T, Moseley ME. Regional variability of cerebral blood oxygenation response to hypercapnia. Neuroimage. 1999a;10(6):675–681. doi: 10.1006/nimg.1999.0505. [DOI] [PubMed] [Google Scholar]
- Kastrup A, Li TQ, Glover GH, Moseley ME. Cerebral blood flow-related signal changes during breath-holding. AJNR Am. J. Neuroradiol. 1999b;20(7):1233–1238. [PMC free article] [PubMed] [Google Scholar]
- Lane RD, McRae K, Reiman EM, Chen K, Ahern GL, Thayer JF. Neural correlates of heart rate variability during emotion. Neuroimage. 2009;44(1):213–222. doi: 10.1016/j.neuroimage.2008.07.056. [DOI] [PubMed] [Google Scholar]
- Li TQ, Kastrup A, Takahashi AM, Moseley ME. Functional MRI of human brain during breath holding by BOLD and FAIR techniques. Neuroimage. 1999;9(2):243–249. doi: 10.1006/nimg.1998.0399. [DOI] [PubMed] [Google Scholar]
- Lierse W. Die Kapillardichte im Wirbeltiergehirn. Acta Anat. 1963;54:1–31. [PubMed] [Google Scholar]
- Lund TE, Madsen KH, Sidaros K, Luo WL, Nichols TE. Non-white noise in fMRI: does modelling have an impact? Neuroimage. 2006;29(1):54–66. doi: 10.1016/j.neuroimage.2005.07.005. [DOI] [PubMed] [Google Scholar]
- McKay LC, Evans KC, Frackowiak RS, Corfield DR. Neural correlates of voluntary breathing in humans. J. Appl. Physiol. 2003;95(3):1170–1178. doi: 10.1152/japplphysiol.00641.2002. [DOI] [PubMed] [Google Scholar]
- Murphy K, Birn RM, Handwerker DA, Jones TB, Bandettini PA. The impact of global signal regression on resting state correlations: are anti-correlated networks introduced? Neuroimage. 2009;44(3):893–905. doi: 10.1016/j.neuroimage.2008.09.036. [DOI] [PMC free article] [PubMed] [Google Scholar]
- Napadow V, Dhond R, Conti G, Makris N, Brown EN, Barbieri R. Brain correlates of autonomic modulation: combining heart rate variability with fMRI. Neuroimage. 2008;42(1):169–177. doi: 10.1016/j.neuroimage.2008.04.238. [DOI] [PMC free article] [PubMed] [Google Scholar]
- Raichle ME, MacLeod AM, Snyder AZ, Powers WJ, Gusnard DA, Shulman GL. A default mode of brain function. Proc. Natl. Acad. Sci. U. S. A. 2001;98(2):676–682. doi: 10.1073/pnas.98.2.676. [DOI] [PMC free article] [PubMed] [Google Scholar]
- Raj D, Anderson AW, Gore JC. Respiratory effects in human functional magnetic resonance imaging due to bulk susceptibility changes. Phys. Med. Biol. 2001;46(12):3331–3340. doi: 10.1088/0031-9155/46/12/318. [DOI] [PubMed] [Google Scholar]
- Shmueli K, van Gelderen P, de Zwart JA, Horovitz SG, Fukunaga M, Jansma JM, Duyn JH. Low-frequency fluctuations in the cardiac rate as a source of variance in the resting-state fMRI BOLD signal. Neuroimage. 2007;38(2):306–320. doi: 10.1016/j.neuroimage.2007.07.037. [DOI] [PMC free article] [PubMed] [Google Scholar]
- Stillman AE, Hu X, Jerosch-Herold M. Functional MRI of brain during breath holding at 4 T. Magn. Reson. Imaging. 1995;13(6):893–897. doi: 10.1016/0730-725x(95)00037-h. [DOI] [PubMed] [Google Scholar]
- Thomason ME, Burrows BE, Gabrieli JD, Glover GH. Breath holding reveals differences in fMRI BOLD signal in children and adults. Neuroimage. 2005;25(3):824–837. doi: 10.1016/j.neuroimage.2004.12.026. [DOI] [PubMed] [Google Scholar]
- Van den Aardweg JG, Karemaker JM. Influence of chemoreflexes on respiratory variability in healthy subjects. Am. J. Respir. Crit. Care Med. 2002;165(8):1041–1047. doi: 10.1164/ajrccm.165.8.2104100. [DOI] [PubMed] [Google Scholar]
- Wise RG, Ide K, Poulin MJ, Tracey I. Resting fluctuations in arterial carbon dioxide induce significant low frequency variations in BOLD signal. Neuroimage. 2004;21(4):1652–1664. doi: 10.1016/j.neuroimage.2003.11.025. [DOI] [PubMed] [Google Scholar]


