The crystal structure of Hsp33 from S. cerevisiae was solved at 2.40 Å resolution. Structural comparison showed that Hsp33 has a very similar structure to Hsp31, except for some deviations in helices α2–α3 of the core domain.
Keywords: Hsp33/YOR391Cp, Saccharomyces cerevisiae, ThiI/DJ-1/PfpI superfamily
Abstract
Saccharomyces cerevisiae Hsp33/YOR391Cp is a member of the ThiI/DJ-1/PfpI superfamily. Hsp33 was overexpressed in Escherichia coli and its crystal structure was determined at 2.40 Å resolution. Structural comparison revealed that Hsp33 adopts an α/β-hydrolase fold and possesses the putative Cys–His–Glu catalytic triad common to the Hsp31 family, suggesting that Hsp33 and Hsp31 share similar aminopeptidase activity, while structural deviations in helices α2–α3 of the core domain might be responsible for the access of different peptide substrates.
1. Introduction
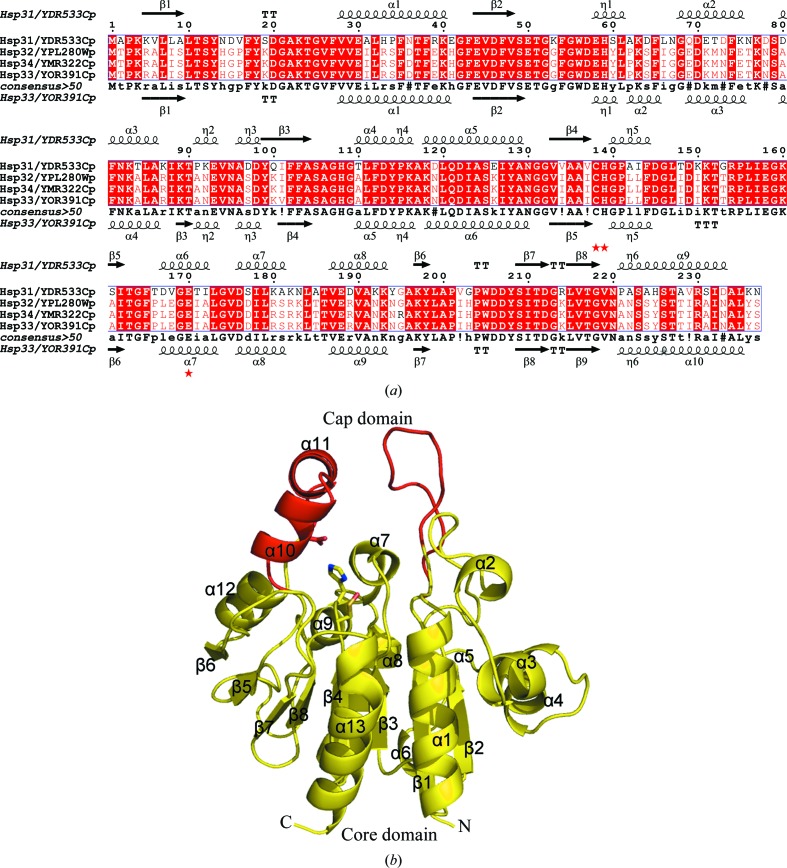
The HSP33/YOR391C gene from Saccharomyces cerevisiae encodes a 25.9 kDa protein (UniProt ID Q08914) reported to be a molecular chaperone. Its transcription is upregulated upon heat-shock, oxidative or other stress (Sakaki et al., 2003 ▶; Cremers et al., 2010 ▶). Hsp33 has three paralogues: Hsp31/YDR533Cp, Hsp32/YPL280Wp and Hsp34/YMR322Cp. Sequence comparison showed that Hsp33 shares a sequence identity of 69% and a similarity of 82% to Hsp31, whereas it is 99.5% identical to Hsp32 and 99.0% identical to Hsp34 (Fig. 1 ▶ a). Because of the high sequence conservation, these genes were named the Hsp31 mini-gene family. This gene family is speculated to have arisen from an initial duplication of the parental gene (presumably Hsp31) into a subtelomeric location, followed by recombination to produce the other copies (Wilson et al., 2004 ▶). However, their expression patterns are somewhat divergent. Unlike HSP31, the expression of HSP32, HSP33 and HSP34 is upregulated upon nitrogen starvation but not upon addition of the amino-acid analogue azetidine-2-carboxylic acid (AZC) or upon carbon starvation (Wilson et al., 2004 ▶). Little is known about the specific biochemical function of the yeast Hsp31 family, apart from a report that Hsp31 is structurally similar to its orthologue Escherichia coli Hsp31 (YedU), which has both chaperone and aminopeptidase activities, which are common in the DJ-1/ThiJ/PfpI superfamily (Quigley et al., 2003 ▶; Lee et al., 2003 ▶; Graille et al., 2004 ▶).
Figure 1.
Sequence alignment and overall structure. (a) Structure-based sequence alignment of Hsp33, Hsp31, Hsp32 and Hsp34 from S. cerevisiae. The secondary structure of Hsp31 (PDB codes 1qvz and 1rw7; Wilson et al., 2004 ▶; Graille et al., 2004 ▶) is shown at the top and that of Hsp33 (PDB code 3mii) is shown at the bottom. The residues involved in the catalytic triad are marked by red stars. Alignments were performed using the programs MULTALIN (Corpet, 1988 ▶) and ESPript (Gouet et al., 2003 ▶). (b) Cartoon representation of the yeast Hsp33 monomer. The core and cap domains are coloured yellow and red, respectively. The residues constituting the putative catalytic triad are shown as sticks. All figures were prepared using PyMOL (DeLano, 2002 ▶).
We have previously reported the crystallization of Hsp33, yielding a diffraction data set to 2.7 Å resolution (Liu et al., 2007 ▶). Here, we present the crystal structure of Hsp33 at 2.40 Å resolution. Structural comparison revealed that Hsp33 has a very similar structure to that of Hsp31, adopting an α/β-hydrolase fold and possessing a putative catalytic triad consisting of Cys138–His139–Glu170, which suggests that Hsp33 and Hsp31 share a similar aminopeptidase activity (EC 3.2.–.–). Some structural differences in helices α2–α3 of the core domain might be responsible for the access of different peptide substrates. Further biochemical and genetic analyses are required in order to verify this hypothesis.
2. Materials and methods
2.1. Protein crystallization and data collection
Crystals of Hsp33 were obtained using the hanging-drop vapour-diffusion method by mixing 2 µl Hsp33 at 10 mg ml−1 with 2 µl reservoir solution (15–18% polyethylene glycol 3000, 200 mM ammonium sulfate, 100 mM sodium citrate tribasic dihydrate pH 5.6, 5% glycerol). Crystals measuring 0.2 × 0.2 × 2.0 mm appeared after 7–15 d at 288 K and were soaked in cryoprotectant (30% glycerol, 18% polyethylene glycol 3000, 200 mM ammonium sulfate, 100 mM sodium citrate tribasic dihytrate pH 5.6) before flash-cooling in liquid nitrogen.
Diffraction data were collected from a loop-mounted crystal using a Rigaku MicroMax-007 X-ray generator (λ = 1.5418 Å) and a MAR345 image-plate detector (MAR Research, Germany). The data set was processed to 2.40 Å resolution with iMosflm (Leslie, 1999 ▶). The crystal belonged to space group P43212. Details of the procedures were as described by Liu et al. (2007 ▶).
2.2. Structure determination and refinement
The structure was determined by molecular replacement with the CCP4 (Collaborative Computational Project, Number 4, 1994 ▶) program MOLREP (Vagin & Teplyakov, 2010 ▶) using the structure of yeast Hsp31 (PDB code 1qvz; Graille et al., 2004 ▶) as the initial model. Refinement was carried out using the maximum-likelihood method as implemented in REFMAC (Murshudov et al., 1997 ▶) and the interactive rebuilding process in Coot (Emsley & Cowtan, 2004 ▶). The final model consists of 234 residues (4–237) of one monomer and 235 residues (3–237) of the other. The quality of the model was verified with MolProbity (Chen et al., 2010 ▶). A summary of the data-collection statistics and structure determination is given in Table 1 ▶. The coordinates and structure factors have been deposited in the Protein Data Bank under accession code 3mii.
Table 1. Data-collection statistics for the crystal of yeast Hsp33.
Values in parentheses are for the highest resolution shell.
| Data collection | |
| Space group | P43212 |
| Unit-cell parameters (, ) | a = b = 94.4, c = 132.2, = = = 90 |
| Molecules per asymmetric unit | 2 |
| Resolution range () | 60.632.40 (2.532.40) |
| Unique reflections | 45873 (6819) |
| Completeness (%) | 97.3 (99.4) |
| I/(I) | 8.7 (2.3) |
| R merge † (%) | 11.8 (44.3) |
| Average redundancy | 2.3 (2.2) |
| Structure refinement | |
| Resolution range () | 25.502.40 (2.462.40) |
| R factor‡/R free § | 0.222/0.246 |
| No. of protein atoms | 3635 |
| No. of heteroatoms | 31 |
| No. of water atoms | 168 |
| R.m.s.d.¶ bond lengths () | 0.006 |
| R.m.s.d. bond angles () | 0.946 |
| Mean B factor (2) | 21.74 |
| Ramachandran plot†† | |
| Most favoured (%) | 97.19 |
| Additional allowed (%) | 2.81 |
| Outliers (%) | 0 |
| Poor rotamers (%) | 0.27 |
| Clash score | 5.9 |
| PDB code | 3mii |
R
merge = 
 , where I
i(hkl) is the intensity of an observation and I(hkl) is the mean value for the unique reflection; summations are over all reflections.
R factor = 
 , where F
obs and F
calc are the observed and calculated structure-factor amplitudes, respectively.
R free was calculated with 5% of the data excluded from refinement.
Root-mean-square deviation from ideal values (Engh Huber, 1991 ▶).
Categories as defined by MolProbity (Chen et al., 2010 ▶).
3. Results and discussion
3.1. Overall structure
The 2.4 Å resolution crystal structure of yeast Hsp33 has clear electron density for residues Lys4 (Pro3 in the second molecule) to Ser237, with an R value of 0.222 and a free R value of 0.246 (Table 1 ▶). One asymmetric unit of the crystal contains two monomers, each of which consists of an α/β core domain (residues Lys4–Thr11, Gly25–Phe165 and Thr185–Ser237) and a cap domain (residues Ser12–Thr24 and Pro166–Leu184) (Fig. 1 ▶ b). The core domain adopts an α/β-hydrolase fold (Ollis et al., 1992 ▶; Nardini & Dijkstra, 1999 ▶) composed of 11 α-helices (α1–α9 and α12–α13) and eight β-strands (β1–β8). The main β-sheet strands (β1–β4 and β7–β8) are flanked by five helices (α1–α4 and α13) on one side and by six helices (α5–α9 and α12) and two strands (β5–β6) on the other side. The cap domain is composed of two α-helices (α10–α11) and a long loop. The interface of the core domain and the cap domain forms a wide open pocket in which the enzymatic reactions probably take place. Our structure is very similar to the yeast Hsp33 structure (PDB code 3kkl, released in March 2010; K. Y. Hwang, M. W. Sung & W. H. Lee, unpublished work) in a different crystal form, in which electron density for residues Leu61–Ala80 was missing.
3.2. Dimerization state
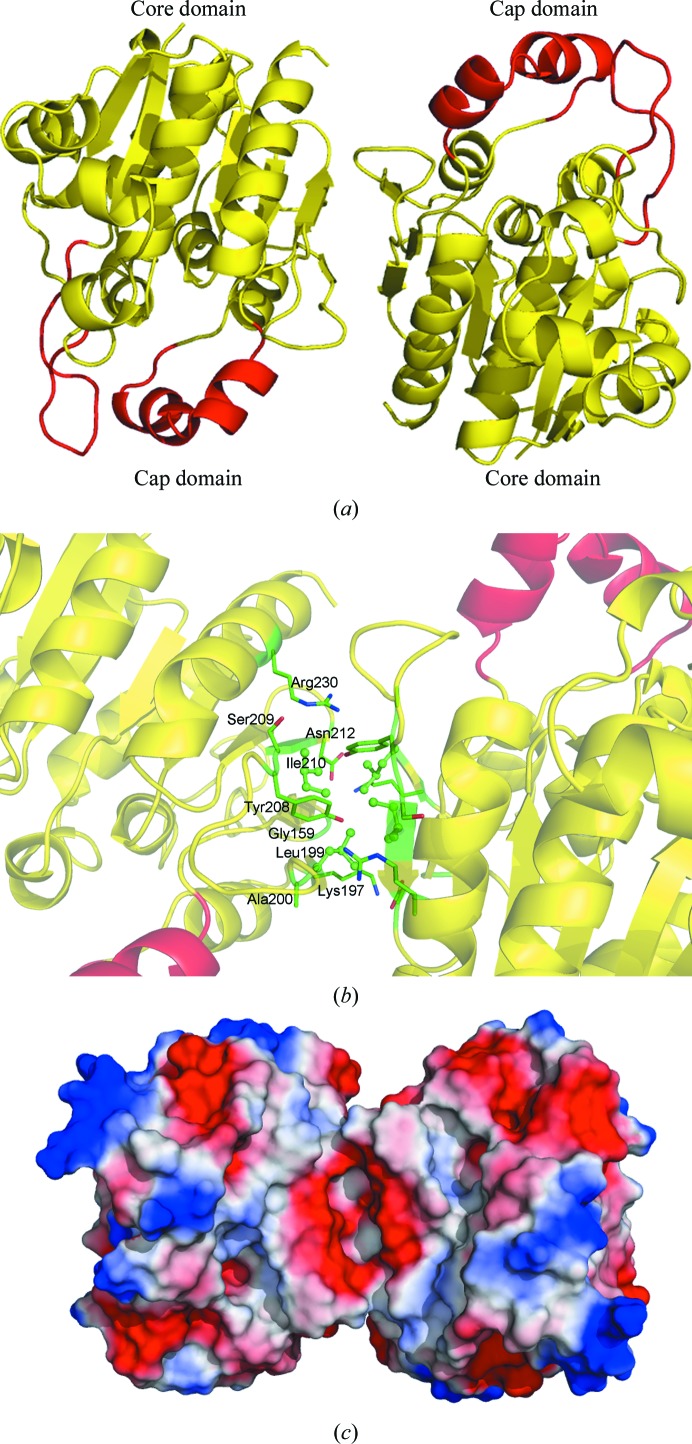
Although the PISA (Krissinel & Henrick, 2007 ▶) results suggested that the proteins were monomeric, the results of gel-filtration chromatography (Liu et al., 2007 ▶) and dynamic light scattering (data not shown) demonstrated that Hsp33 exists as a dimer in solution, which is a characteristic common to yeast Hsp33 and Hsp31 (Graille et al., 2004 ▶; Wilson et al., 2004 ▶). In the crystal, the asymmetric unit contains two copies of the molecule related by a local twofold-symmetric axis (Fig. 2 ▶ a). The dimer interface buries about 1100 Å2, which involves contacts between strands β6, β7, β8 and helix α13 of each monomer. These contacts consist of eight hydrogen bonds and 69 nonbonded contacts, as evaluated by PDBsum (Laskowski et al., 2005 ▶). In detail, the hydrophobic residues Leu199 and Ile210 of each monomer form a hydrophobic patch at the centre of the dimer interface. The residues Gly159, Lys197, Ala200, Tyr208, Ser209, Asp212 and Arg230 contribute to inter-subunit hydrogen bonds and several nonbonded contacts which further stabilize the interface (Fig. 2 ▶ b).
Figure 2.
The dimeric interface. (a) Cartoon representation of the homodimer of Hsp33. (b) A close-up view of the dimeric interface. The hydrophobic residues are shown as ball-and-stick models and the polar and charged residues are shown as sticks. (c) The electrostatic surface of the dimer. Each view was generated with PyMOL (DeLano, 2002 ▶).
Like the Hsp31 proteins from E. coli (Quigley et al., 2003 ▶) and S. cerevisiae (Wilson et al., 2004 ▶), Hsp33 possesses a negatively charged saddle-shaped groove on one side of the dimer interface and a smaller groove on the opposite side (Fig. 2 ▶ c). Yet, compared with Hsp31 from E. coli and S. cerevisiae, yeast Hsp33 has fewer negatively charged residues in the saddle-shaped groove.
3.3. Comparison of yeast Hsp33 and Hsp31
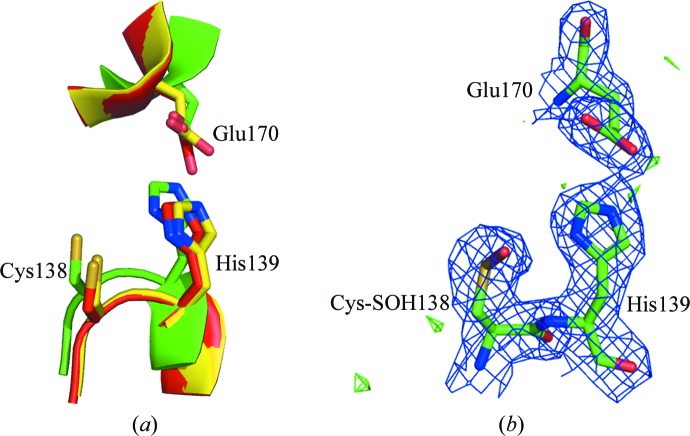
As a member of the Hsp31 family, Hsp33 possesses an α/β-hydrolase fold and the same components and arrangement of a putative Cys138–His139–Glu170 catalytic triad as found in yeast Hsp31 and E. coli Hsp31 (Fig. 3 ▶ a), suggesting that Hsp33 is a cysteine protease. The electron-density maps indicated that Cys138 is oxidized, which is a common feature of this conserved cysteine in all members of the DJ-1/ThiJ/PfpI superfamily (Blackinton et al., 2009 ▶; Wilson et al., 2004 ▶). In our structure, the Cys138 residues in both chains were oxidized to cysteine sulfenic acid (Cys-SOH; Fig. 3 ▶ b).
Figure 3.
The active site. (a) Superposition of the catalytic triads of yeast Hsp33 (yellow), yeast Hsp31 (red) and E. coli Hsp31 (green). Only the Hsp33 numbering is indicated. (b) The electron density around Cys-SOH138 in the catalytic triad of yeast Hsp33. 2F o − F c electron density contoured at 1.0σ (0.28 e Å−3) is shown in blue and F o − F c electron density contoured at 3.0σ (0.17 e Å−3) is shown in green.
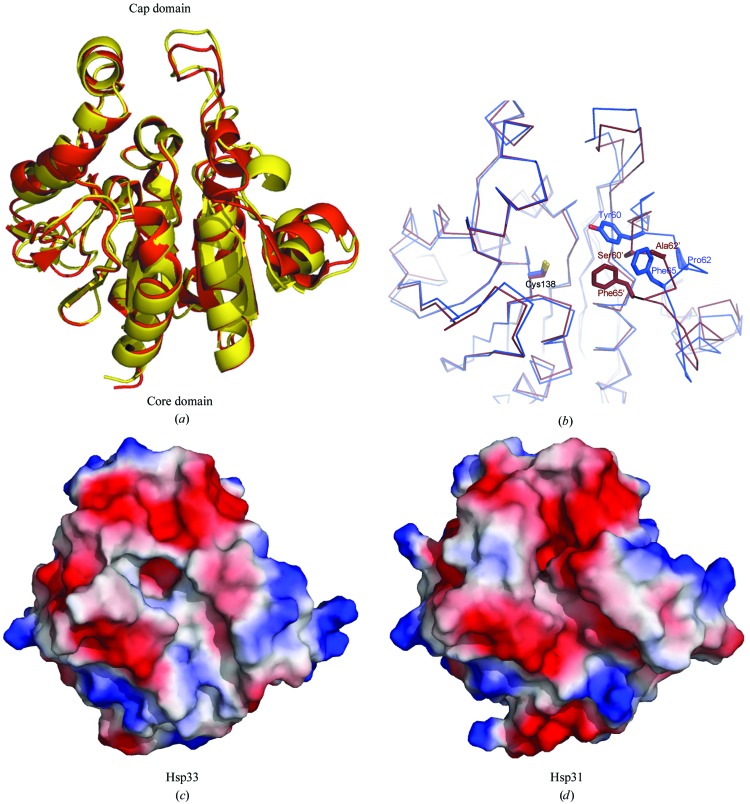
Superposition of Hsp33 and Hsp31 shows that the overall structures of these two proteins are very similar (with a root-mean-square deviation of 1.29 Å for 234 Cα atoms; Fig. 4 ▶ a), with the exception of the α2–α3 helices of the core domain. Structural comparison suggests that Ser60′ and Ala62′ in Hsp31 (corresponding to Tyr60 and Pro62 in Hsp33) probably contribute the most to the structural differences. They cause a shift in the position of the phenyl ring of Phe65 by about 3.5 Å (Fig. 4 ▶ b). As a result, the size and orientation of the active-size pocket differs markedly between the two proteins (Figs. 4 ▶ c and 4 ▶ d). The area and volume of the pocket in Hsp33 are 330 Å2 and 500 Å3, respectively, compared with 240 Å2 and 250 Å3 for Hsp31, as evaluated using CASTp (Dundas et al., 2006 ▶). These differences are likely to cause their substrate specificities to differ.
Figure 4.
Structural comparison of yeast Hsp33 and Hsp31. (a) Superimposition of the structures of Hsp33 (yellow) and Hsp31 (red). (b) Comparison of the active-site pocket between Hsp33 (blue) and Hsp31 (brown). The different residues are presented as sticks. The electrostatic surface of (c) Hsp33 and (d) Hsp31, showing the differences in the size and orientation of the active pocket. All figures were made with PyMOL (DeLano, 2002 ▶).
In conclusion, yeast Hsp33 and Hsp31 share the same fold, consisting of a cap domain and a core domain, and contain a conserved putative catalytic triad, suggesting that they have similar aminopeptidase activities. Some conformational differences were observed in helices α2–α3 of the core domain, which give Hsp33 a wider active-site pocket than Hsp31 and thus probably a different substrate specificity.
Supplementary Material
PDB reference: Hsp33/YOR391Cp, 3mii
Acknowledgments
We are grateful to the developers of the CCP4 suite, ESPript, MolProbity and PyMOL. This work was supported by projects 2006CB910202 and 2006CB806501 from the Ministry of Science and Technology of China and grant 30870490 from the Chinese National Natural Science Foundation.
References
- Blackinton, J., Lakshminarasimhan, M., Thomas, K. J., Ahmad, R., Greggio, E., Raza, A. S., Cookson, M. R. & Wilson, M. A. (2009). J. Biol. Chem. 284, 6476–6485. [DOI] [PMC free article] [PubMed]
- Chen, V. B., Arendall, W. B., Headd, J. J., Keedy, D. A., Immormino, R. M., Kapral, G. J., Murray, L. W., Richardson, J. S. & Richardson, D. C. (2010). Acta Cryst. D66, 12–21. [DOI] [PMC free article] [PubMed]
- Collaborative Computational Project, Number 4 (1994). Acta Cryst. D50, 760–763.
- Corpet, F. (1988). Nucleic Acids Res. 16, 10881–10890. [DOI] [PMC free article] [PubMed]
- Cremers, C. M., Reichmann, D., Hausmann, J., Ilbert, M. & Jakob, U. (2010). J. Biol. Chem. 285, 11243–11251. [DOI] [PMC free article] [PubMed]
- DeLano, W. (2002). PyMOL. http://www.pymol.org.
- Dundas, J., Ouyang, Z., Tseng, J., Binkowski, A., Turpaz, Y. & Liang, J. (2006). Nucleic Acids Res. 34, W116–W118. [DOI] [PMC free article] [PubMed]
- Emsley, P. & Cowtan, K. (2004). Acta Cryst. D60, 2126–2132. [DOI] [PubMed]
- Engh, R. A. & Huber, R. (1991). Acta Cryst. A47, 392–400.
- Gouet, P., Robert, X. & Courcelle, E. (2003). Nucleic Acids Res. 31, 3320–3323. [DOI] [PMC free article] [PubMed]
- Graille, M., Quevillon-Cheruel, S., Leulliot, N., Zhou, C.-Z., de la Sierra Gallay, I. L., Jacquamet, L., Ferrer, J.-L., Liger, D., Poupon, A., Janin, J. & van Tilbeurgh, H. (2004). Structure, 12, 839–847. [DOI] [PubMed]
- Krissinel, E. & Henrick, K. (2007). J. Mol. Biol. 372, 774–797. [DOI] [PubMed]
- Laskowski, R. A., Chistyakov, V. V. & Thornton, J. M. (2005). Nucleic Acids Res. 33, D266–D268. [DOI] [PMC free article] [PubMed]
- Lee, S.-J., Kim, S. J., Kim, I.-K., Ko, J., Jeong, C.-S., Kim, G.-H., Park, C., Kang, S.-O., Suh, P.-G., Lee, H.-S. & Cha, S.-S. (2003). J. Biol. Chem. 278, 44552–44559. [DOI] [PubMed]
- Leslie, A. G. W. (1999). Acta Cryst. D55, 1696–1702. [DOI] [PubMed]
- Liu, W., Zhou, Y.-Y., Teng, M.-K. & Zhou, C.-Z. (2007). Acta Cryst. F63, 114–116. [DOI] [PMC free article] [PubMed]
- Murshudov, G. N., Vagin, A. A. & Dodson, E. J. (1997). Acta Cryst. D53, 240–255. [DOI] [PubMed]
- Nardini, M. & Dijkstra, B. W. (1999). Curr. Opin. Struct. Biol. 9, 732–737. [DOI] [PubMed]
- Ollis, D. L., Cheah, E., Cygler, M., Dijkstra, B., Frolow, F., Franken, S. M., Harel, M., Remington, S. J., Silman, I., Schrag, J. & Sussman, J. L., Verschueren, K. H. G. & Goldman, A. (1992). Protein Eng. 5, 197–211. [DOI] [PubMed]
- Quigley, P. M., Korotkov, K., Baneyx, F. & Hol, W. G. (2003). Proc. Natl Acad. Sci. USA, 100, 3137–3142. [DOI] [PMC free article] [PubMed]
- Sakaki, K., Tashiro, K., Kuhara, S. & Mihara, K. (2003). J. Biochem. 134, 373–384. [DOI] [PubMed]
- Vagin, A. & Teplyakov, A. (2010). Acta Cryst. D66, 22–25. [DOI] [PubMed]
- Wilson, M. A., St Amour, C. V., Collins, J. L., Ringe, D. & Petsko, G. A. (2004). Proc. Natl Acad. Sci. USA, 101, 1531–1536. [DOI] [PMC free article] [PubMed]
Associated Data
This section collects any data citations, data availability statements, or supplementary materials included in this article.
Supplementary Materials
PDB reference: Hsp33/YOR391Cp, 3mii


