

Abstract
An International Expert Committee made recommendations for using the hemoglobin A1C (A1C) assay as the preferred method for diagnosis of diabetes in nonpregnant individuals. A concentration of ≥ 6.5% was considered as diagnostic. It is the aim of this study to compare the sensitivity of A1C with that of plasma glucose concentrations in subjects with early diabetes or IGT. We chose two groups of subjects who had A1C of ≤ 6.4%. The first group of 89 subjects had family histories of diabetes (MODY or T2DM) and had OGTT and A1C determinations. They included 36 subjects with diabetes or IGT and 53 with normal OGTT. The second group of 58 subjects was screened for diabetes in our Diabetes Clinic by FPG or 2HPG or OGTT and A1C and similar comparisons were made. Subjects with diabetes or IGT, including those with fasting hyperglycemia, had A1C ranging from 5.0 – 6.4%, mean 5.8%. The subjects with normal OGTT had A1C of 4.2 – 6.3%, mean 5.4% or 5.5% for the two groups. A1C may be in the normal range in subjects with diabetes or IGT, including those with fasting hyperglycemia. Approximately one third of subjects with early diabetes and IGT have A1C <5.7%, the cut-point that ADA recommends as indicating the onset of risk of developing diabetes in the future. The results of our study are similar to those obtained by a large Dutch epidemiological study. If our aim is to recognize early diabetic states to apply effective prophylactic procedures to prevent or delay progression to more severe diabetes, A1C is not sufficiently sensitive or reliable for diagnosis of diabetes or IGT. A combination of A1C and plasma glucose determinations, where necessary, are recommended for diagnosis or screening of diabetes or IGT.
Key terms: Hemoglobin A1C, Diagnosis, Diabetes
An International Expert Committee Report (IECR) has made recommendations for using the hemoglobin A1C (A1C) assay as the preferred method for the diagnosis of diabetes in non-pregnant individuals (with few exceptions) (1). Traditional diagnostic tests (e.g., FPG or 2HPG or OGTT) and criteria for their interpretation (2, 3), although deemed valid, were recommended to be discontinued. Advantages of A1C testing compared with FPG and/or 2HPG or OGTT for diagnosis of diabetes that were cited were better index of overall glycemic exposure and risk for long-term complications, less biological variability, less pre-analytic instability, no need for fasting and timed samples, less affected by acute perturbations in glucose levels, convenience for the patient, and ease of sample collection. As with other diagnostic procedures, it was recognized that there is a continuum of increased risk for the development of diabetes with increasing A1C concentrations. Thus, no clear division between non-diabetes and diabetes exists. Nevertheless, a level of 6.5% or greater was considered to be diagnostic of diabetes, if confirmed by a second determination. This particular cut point was selected as the risk for the development of diabetic retinopathy rises steeply at this or higher A1C levels. Little consideration was given to the fact that although microvascular complications, as reflected by retinopathy, are the most specific complications of diabetes, macrovascular complications and diabetic neuropathy are associated with lower elevations of glycemia (4).
The IECR did not discuss the sensitivity of the A1C assay in comparison with presently accepted criteria for the interpretation of FPG, 2HPG, or OGTT in the diagnosis of diabetes, particularly for early diabetic states. The same applies for screening for diabetes or recognition of hyperglycemic states below those considered diagnostic of diabetes, i.e., IGT and IFG and their use in delaying or preventing progression to diabetes. Since publication of the IECR report there has been a series of communications discussing the advantages and limitations of the use of A1C in diagnosis of or screening for diabetes in various population groups (5, 6, 7). It is the aim of this study to compare the sensitivity of A1C with that of the OGTT (or the FPG and 2 HPG levels) in subjects with mild carbohydrate intolerance. In addition, on the basis of our findings, we wish to make suggestions for the use of additional plasma glucose testing procedures in the diagnosis or screening of diabetes, until further comparisons are available.
RESEARCH DESIGN AND METHODS
We include two separate groups of subjects in this report. One group is composed of subjects from a large, long-term study of the natural history of diabetes. In this study we have performed routine OGTTs in apparently healthy first degree relatives of known diabetic patients. We selected 89 subjects who had an OGTT and an A1C determination on the same day and who had an A1C concentration of ≤ 6.4%. As the cutpoint for a diagnosis of diabetes has been proposed as ≥ 6.5% (1, 9), these subjects would not be classified as having diabetes. Twenty-eight subjects with diabetes mellitus and eight subjects with IGT were diagnosed by presently recognized ADA and WHO criteria (2,3). Subjects included 11 individuals with type 2 diabetes and a family history of diabetes and 25 subjects of families with MODY1 (HNF-4a mutations), MODY2 (glucokinase mutation), MODY3 (HNF-1a mutation) and MODY4 (IPF1 mutation). These MODY subjects had a phenotype which in regard to plasma glucose concentration could not be distinguished from type 2 diabetes. Before entering this study many of them had been diagnosed as having T2DM by their primary care physicians. The subjects diagnosed as having diabetes are subdivided into three categories: Group A, 11 subjects with FPG > 126 mg/dl (range of 127-155 mg/dl, mean of 142 mg/dl); Group B, 11 subjects with FPG 100-125 mg/dl (range 100-117 mg/dl, mean of 113 mg/dl); and Group C, 6 subjects with FPG <100 mg/dl (range 81-99 mg/dl, mean of 93 mg/dl). In addition, there is Group D, 8 subjects with IGT (FPG range 88-106 mg/dl, mean of 99 mg/dl); peak plasma glucose range 201-245 mg/dl, mean of 213 mg/dl; 2HPG, range of 147-189 mg/dl, mean of 168 mg/dl. For comparison, we included 53 subjects with normal glucose tolerance who were either members of families with MODY1, MODY2, MODY3, or MODY4 but who were mutation negative or members of families with type 2 diabetes but normal OGTTs (Group E).
Although the phenotype of the MODY subjects was very similar to that of T2DM subjects, except for age and BMI, we added a second group of subjects that was representative of patients seen in a general diabetes clinic. This second group of 58 subjects, not part of the 89 subjects described above, was screened for diabetes or IGT in our Diabetes Clinic because they had one or more risk factors for diabetes. This group which also had A1C concentrations ≤ 6.4% contained 9 diabetic subjects, 17 with IGT, 8 with IFG, and 24 with normal PG levels. We also compared results of plasma glucose concentrations obtained with FPG or 2HPG, or OGTT with A1C concentrations in subjects with A1C ≤ 6.4% for the same reason as stated for the first group. Tables 1 and 2 give information on age, sex, BMI and ethnicity of subjects in the two groups.
Table 1.
Age, Sex, and BMI of 5 Categories of 89 Subjects (all Caucasian)
| (Number) | A (11) | B (11) | C (6) | D (8) | E (53) |
|---|---|---|---|---|---|
| Age Yrs – Mean (Range) | 38.8 (21 – 50) | 42.6 (18 – 81) | 25.5 (20 – 66) | 28.3 (13 – 58) | 30.2 (9 – 56) |
| Sex M/F | 5/6 | 3/8 | 5/1 | 4/4 | 22/31 |
| BMI – Mean / (Range) | 26.6 (19 – 42) | 25.0 (22 – 38) | 25.5 (20 – 32) | 22.4 (19 – 28) | 25.0 (17 – 38) |
Table 2.
Age, Sex, BMI, and Ethnicity of Four Categories of 58 Subjects Screened for Diabetes in Diabetes Clinic Who Had A1C < 6.5%
| (Number) | DM (9) | IGT (17) | IFG (8) | Normal (24) |
|---|---|---|---|---|
| Age Yrs – Mean (Range) | 62.4 (53 – 74) | 44 (22 – 82) | 51 (37 – 69) | 45.4 (24 – 77) |
| Sex M/F | 1/8 | 5/11 | 3/5 | 5/19 |
| BMI – Mean / (Range) | 42.29 (30 – 49) | 38.4 (23 – 59) | 49.7 (34 – 94) | 40.6 (25 – 80) |
| Ethnicity – Caucasian (C) / Black (B) / Unknown (U) – C/B/U | 9/0/0 | 13/1/3 | 7/1/0 | 22/2/0 |
For the OGTT (FPG and samples every 30 minutes for 3 hours) the glucose load used in our research studies has been 1.75 g per kg of ideal body weight (calculated from Metropolitan Life Insurance tables) for the last 60 years. For the FPG, 2HPG or OGTT (FPG and samples every 30 minutes for 2 hours) performed in our Diabetes Clinic, the glucose load was 75 g. Although multiple observations were available for the MODY subjects only one single day’s result was used for each subject. Multiple results were generally consistent with each other.
This study was approved by the University of Michigan Medical Center Institutional Review Board. All 89 subjects or their parents provided written informed consent. Patients from the Diabetes Clinic had their evaluation as part of their routine care.
BIOCHEMICAL ASSAYS
All plasma samples were collected on ice, spun and if not processed immediately stored at -70 °C until assayed. Plasma glucose was measured on a Cobas Mira Plus analyzer using a hexokinase method. Inter-assay variation is 3.15% at 84 mg/dl and 2.8% at 292 mg/dl (n=224). A1c was measured in whole blood immediately using the assay kit Unimate 3 from Roche Diagnostics. A1c and total hemoglobin (Hb) are determined from hemolysate, prepared on-board the cobas Mira Chemistry Analyzer from whole blood. A1C is measured from the hemolysate by a latex enhanced turbidimetric immunoassay. The final test result is determined from the A1C/Hb ratio, including a conversion formula to match a HPLC reference method. The inter-assay variations are 3.7% at 5.7% A1C and 3.8% at 10.7% A1C (n=45).
RESULTS
As shown in Table 3, the 36 subjects in Group 1 with either diabetes (n=28) or IGT (N=8) had a mean A1C concentration of 5.8%. This was true for the 11 subjects with fasting hyperglycemia (Group A, FPG ≥ 126 mg/dl, mean of 142 mg/dl) as well as for the 17 subjects with FPG < 126 mg/dl (Group B and C). A1C concentrations were as low as 5.0% in some subjects. In Group A, 8 of 11 subjects had A1C concentrations < 6.0%. Similar results were found in the subjects with IGT (Group D). As shown in Figure 1 for the respective groups, Groups A, B and C had very similar glucose levels at 1, 1-1/2, and 2 hours during the OGTT. The ½ hour level was somewhat higher for Group A and the 3-hour level was lower for Group C. Similar A1C results were found in the subjects with IGT (Group D). The 53 family members with normal OGTT (Group E) had A1C concentrations ranging from 4.2% - 6.3% with a mean of 5.4%. Of the 53 subjects, 48 had A1C of 4.2% - 5.9%, mean of 5.4%, but five subjects had A1C of 6.1% - 6.3%, mean 6.2%. Among the 53 subjects with normal OGTT, eight had FPG of 106 – 114 mg/dl, mean 111 mg/dl. Their mean A1C was 5.7%.
Table 3.
Range and Mean Fasting Plasma Glucose Levels and Corresponding A1C Concentrations in 89 Study Subjects Who Had Simultaneous OGTT and A1C Determinations and had A1C < 6.5%
| Group 1 | FPG mg/dl | N | FPG mg/dl | A1C% | ||
|---|---|---|---|---|---|---|
| Range | Mean | Range | Mean | |||
| A | Diabetes >126 | 11 | 127-155 | 142 | 5.3 - 6.4 | 5.9 |
| B | Diabetes 100-126 | 11 | 100-117 | 113 | 5.0 - 6.3 | 5.8 |
| C | Diabetes <100 | 6 | 81-99 | 93 | 5.0 - 6.1 | 5.7 |
| D | IGT | 8 | 5.6 – 5.9 | 5.8 | ||
| FPG | 88-106 | 99 | ||||
| Peak | 201-245 | 213 | ||||
| 2HPG | 147-189 | 168 | ||||
| E | Normal OGTT | 53 | 73-114 | 94 | 4.2 - 6.3 | 5.4 |
| Normal with A1C>6.0 | 5 | 80-106 | 96 | 6.1 - 6.3 | 6.2 | |
| Normal with A1C ≤6.0 | 48 | 73-114 | 95 | 4.2 - 5.9 | 5.4 | |
| Normal with FPG>100 | 8 | 106-114 | 111 | 5.1 - 6.3 | 5.7 | |
To convert mg/dl to mmol/l multiply by 0.0555
Figure 1.
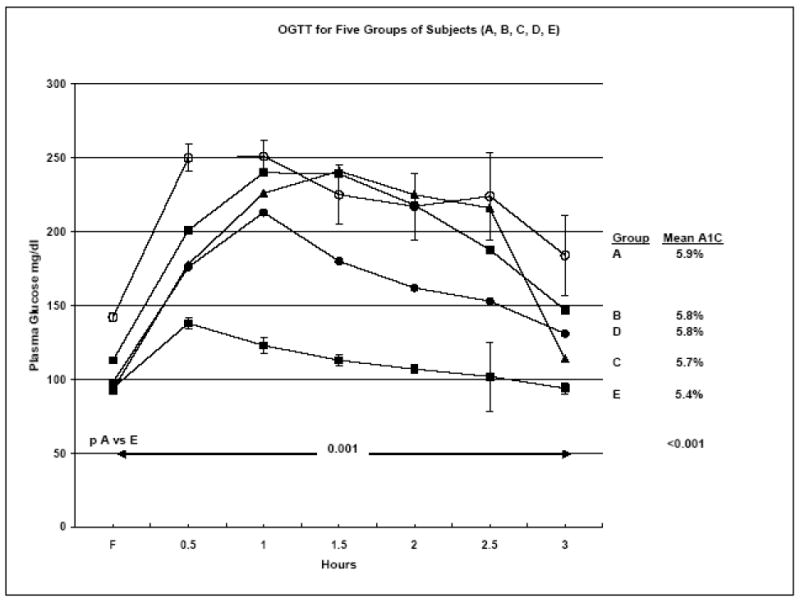
OGTTs for 5 groups of subjects: A: diabetes with FPG > 126 mg/dl; B: diabetes with FPG 100 – 125 mg/dl; C: diabetes with FPG < 100 mg/dl; D: subjects with IGT; and E: subjects with normal OGTT. The figure shows the differences between A and E are significant at all time points at p < 0.001. The same is true for B vs E. For C vs E the difference is p < 0.001 for ½, 1, 1-½, 2, and 2-½ hrs. For D vs E the differences are < .0001 at ½, 1, 1-½, and 2 hr.
The second group of 58 subjects included 9 subjects who were found to have diabetes. For six diabetes subjects the 2HPG ranged from 204-256, mean 224 mg/dl. Four had mild fasting hyperglycemia (131-157 mg/dl, Table 4). One had an OGTT (1-1/2 hr 243, 2 hr 214 mg/dl). Their A1C concentration ranged from 5.1 – 6.0, mean 5.8%. In the IGT group of 17 subjects, the range of 2HPG was 141 – 192, mean 161 mg/dl. In six of them peak levels obtained range from 202 – 231, mean 216 mg/dl. A1C concentration for the 17 subjects was 5.1 – 6.1, mean 5.7%. Eight subjects had IFG by present definition, FPG 110 – 119, mean 115 mg/dl. Their A1C concentration ranged from 5.7 – 6.4, mean 6.0%. The 24 subjects with normal FPG and 2HPG or normal OGTT (N=7) had A1C concentration of 4.8 – 6.2%, mean 5.5%. It is interesting to note that in both groups with normal OGTT 12 subjects had FPG over 100 mg/dl. In this study, none of the subjects was known to have any factors that interfere with the A1C assay.
Table 4.
Range and Mean FPG, 2HPG, or OGTT and Corresponding A1C Concentration for 58 Subjects Screened for Diabetes in Diabetes Clinic and had A1C < 6.5%
| Group 2 | N N |
FPG mg/dl | 2HPG | A1C | |||
|---|---|---|---|---|---|---|---|
| Range | Mean | Range | Mean | Range | Mean | ||
| Diabetes | 9* | 100 - 157 | 122 | 97 – 256 | 200 | 5.1 - 6.4 | 5.8 |
| IGT | 17 | 84 - 116 | 98 | 141 - 192 | 161 | 5.1 – 6.1 | 5.7 |
| Peak PG | 6 | 202 - 231 | 216 | ||||
| IFG | 8 | 110 – 119 | 115 | 80 – 133 | 105 | 5.7 - 6.4 | 6.0 |
| Normal OGTT | 24‡ | 70 – 107 | 89.7 | 51 – 136 | 97.9 | 4.8 - 6.2 | 5.5 |
1 Diabetic subject had OGTT (F - 2 hr: 100, 179, 235, 243, 214 mg/dl) 4 Diabetic subjects had FPG > 126: 131, 132, 135, 157 mg/dl with A1C 5.9, 5.8, 6.0, 6.4%, respectively
Mean OGTT for 7 normal OGTT (F-3 Hr: 90, 127, 131, 109, 98, 72, 77 mg/dl)
Note: An additional subject had IFG and IGT (116 and 144 mg/dl, respectively) and A1C 6.3%.
To convert mg/dl to mmol/l multiply by 0.0555
DISCUSSION
This study addresses the detection of very early defects in glucose metabolism in subjects with very mild diabetes and IGT who are at high risk of developing more severe diabetes with complications but had A1c concentration of ≤ 6.4%. Although the number of subjects studied is limited, the data and conclusions derived from them may have an important impact on the recognition of diabetes in its early stages. A larger number of subjects with similar mild abnormalities will have to be studied for confirmation.
The use of A1C determination is a simple, convenient and reliable method of establishing a diagnosis of diabetes if the results show a concentration of ≥ 6.5% (1). This method can be used for the diagnosis of all types of diabetes, just as it is used for determining the degree of control for all types of diabetes. However, the data in the literature do not disclose an answer to the question of the sensitivity of A1C in diagnosis and screening for diabetes in the large number of subjects with very mild or borderline abnormalities assessed by OGTT. Our data derived from 89 subjects in Group 1 attempt to explore this question. Subjects with the diagnosis of diabetes as documented by fasting hyperglycemia (127 – 155 mg/ dl) had A1C levels from 5.3 - 6.4, mean 5.9% (Table 3). Seven of 11 of these subjects had A1C < 6.0%. This indicates that the diagnosis of diabetes as assessed by OGTT would have been missed in these subjects by reliance on A1C determinations alone. The same applies to subjects with FPG levels < 126 mg/dl but PG levels during the OGTT in the 200 – 300 mg/dl range. The majority had A1C levels < 6.0% and some as low as 5.0%. Engelgau, et al have suggested that the 2-hour post glucose load glucose level is a more sensitive test for the diagnosis of diabetes than is the A1C level (8). All subjects with IGT had A1C levels ≤ 6.0%. The overall results were the same whether the subjects belonged to the MODY or to the type 2 diabetes groups.
The data derived from the 58 subjects of Group 2 gave very similar results to those of group 1 for the subjects with diabetes, IGT, and normal OGTT, respectively. Both the IECR as well as an earlier report by an ad hoc committee (9) recommended that an A1C assay be used in the diagnosis of diabetes. The former report recommended that it be used as the exclusive method (1). The IECR did not discuss the sensitivity of the assay. The report by Saudek and colleagues (9) did not discourage the use of plasma glucose measurements as an additional diagnostic tool, and it presented data from NHANES III which showed that at A1C concentration of 5.6, 6.1 and 6.5% the sensitivities of the test were 83.4, 63.2, and 42.8%, respectively. In light of these results, our findings are not surprising. A contributing reason for the insufficient sensitivity of A1C in diagnosis of diabetes in the lower glycemic range is the choice of the 6.5% cut point. It favors specificity over sensitivity and assumes that diabetes can be defined entirely by the appearance of the long-term complication of diabetic retinopathy. Although microangiopathy is the most specific of the diabetic complications, the development of macrovascular disease and neuropathy, frequent complications of diabetes, can be related to lower blood glucose elevation than in the case with microangiopathy (4).
The IECR states that using both plasma glucose concentration (FPG, or 2HPG, or OGTT) as well as A1C for diagnosis could “easily lead to some confusion” (1). Nevertheless, it is stated that clinicians should be aware of limitations of the A1C determination (e.g., hemolytic anemia, hemoglobinopathies, transfusions, abnormal erythrocyte turnover) and thus should use the traditional plasma glucose means of diagnosing, under these circumstances. A much more common use of the OGTT is its continued use to diagnose or rule-out gestational diabetes. Whether one uses universal or selective screening for gestational diabetes (10,11) it includes a large proportion of the population and dictates that physicans will continue to use the OGTT and should be able to interpret results of FPG, 2HPG, and OGTT in addition to A1C.
The IECR “argues for the elimination of dichotomous subdiabetic classifications, such as prediabetes, IGT and IFG.” We agree completely that the term “prediabetes” should be eliminated from designating groups of individuals in the subdiabetic glycemic range. On the other hand, the subdiabetic classifications of IGT and IFG are of considerable practical usefulness because of the powerful effect of these states on the risk of subsequent development of diabetes. Several studies have shown that the use of intense lifestyle modification and/or administration of metformin (12-14) or troglitazone (15) and rosiglitazone (16) can ameliorate these states and delay or prevent the development of diabetes. Since we have shown that all subjects with IGT had A1C levels ≤ 5.9%, this abnormality cannot be recognized by A1C determinations alone and demonstrates that the continued usefulness of plasma glucose determinations, including the OGTT. The fact that there is a continuum of risk for the development of diabetes based with either the plasma glucose or A1C concentrations from normal to abnormal levels does not detract from the use of the IGT or IFG classifications. Our population of relatives of diabetic patients, whether with normal or abnormal OGTT, showed a continuum of plasma glucose levels and A1C determinations and supports this concept. In our Group 1 of 53 subjects with normal OGTT, there were eight subjects with FPG of 106 – 114 mg/dl. This may be due to the fact that every subject in this group had a family history of diabetes or that a normal FPG may exceed 100 mg/dl.
The upper limit of normal for the A1C determination has been given as 6.05%. In 5 of 53 subjects with normal OGTT and no known MODY mutation, A1C ranges from 6.1% - 6.3% (mean of 6.2%; Table 3, Group E). This makes the identification of individuals with A1C values in this range as having an increased risk for the development of diabetes uncertain. Individuals with levels in this range should be tested either with FPG, 2HPG, or OGTT determinations. The same applies to individuals who are being tested or screened for diabetes because of a strong family history of diabetes, history of gestational diabetes, obesity, hypertension, hyperlipidemia, cardiovascular disease or neuropathy who have A1C levels < 6.5%.
Buell, et al (17) reported that an A1C of 5.8% would be an appropriate cut point above which to proceed to further evaluation. The same conclusion was made by Inue, et al (18). The report of Saudek, et al (9), suggests that an A1C level of 6.0% as a positive screen. IECR recommends effective prevention strategies in subjects with an A1C between 6.0 and 6.5% (1). The new Clinical Practice Recommendations of the American Diabetes Association for “Prevention/Delay of Type 2 Diabetes” (section IV) recommends “patients with IGT, IFG, or an A1C of 5.7 – 6.4% should be referred to an effective ongoing support program for weight loss of 5 – 10% of body weight and an increase in physical activity of at least 150 min/week of moderate activity such as walking” (19). In Asian Indians Mohan, et al, recommend cut points of 6.1, and 6.4% to define diabetes and a value of 5.6% for IGT or IFG with 70% accuracy. They mention that the cut point would have to be as low as 5.0% to identify 97% of all IGT and IFG (5). Among the subjects with IGT studied in this report, 9 of the 25 (36%) individuals had A1C levels below 5.7%. This was also true for 32% of the diabetic subjects. In view of our findings that diabetes or IGT may be associated with A1C levels in the 5.0% - 5.7 or 6.0% range supports our definition of “insufficient sensitivity” and dictates that plasma glucose determinations should be used in the presence of any of the risk factors listed above when the A1C level is below 6.5%. Our findings in 147 subjects are in accord with a large epidemiological study on a general Dutch population of 2,753 subjects aged 40-65 years which found that screening for diabetes with a cut off point of A1c 5.8% would detect 72% of patients with newly diagnosed diabetes and 30% of individuals at high risk of developing diabetes, and 44% of patients with newly diagnosed diabetes had A1c levels < 6.0% (20).
In recent years the use of a complete OGTT has been discouraged and substituted by FPG and 2HPG (a 2-point OGTT). A recent paper suggests that a 1-hr plasma glucose concentration is a better measure for type 2 diabetes risk than the 2-hour plasma glucose concentration (21). This supports the usefulness of obtaining interval levels between the F and 2Hr levels (peak level).
A number of different cut points of A1C have been suggested to detect the onset of risk for developing diabetes in the future, ranging from 5.6% to 6.0% (1, 5, 7, 9, 17-19). Our data show some overlap of A1C concentrations between subjects with normal OGTT and diabetes or IGT. Furthermore, selection of a definite cut point might be applicable to one population but not another one. A1c levels differ across racial and ethnic groups independent of glycemia, with higher levels reported among US racial and ethnic minority groups than among non-Hispanic whites. Differences between extracellular and intracellular glycation, subclinical variation in erythrocyte survival, and genetic factors have all been proposed as causes of these observed differences. Further studies are needed to determine the physiologic basis and clinical impact of this variation. The observed variation casts doubt on whether a single A1c diagnostic cutpoint is appropriate for all US racial and ethnic groups (5,7,22,23). Since there is no consensus of what a valid cut-point for A1C should be while there is for plasma glucose concentration (1) we recommend that plasma glucose determinations (FPG, or 2HPG, or OGTT) be used if a history or clinical situation indicates a high risk for the presence of diabetes and A1C is < 6.5%.
In summary, although an A1C ≥ 6.5% is usually diagnostic for diabetes, A1C may be in the normal range in subjects with diabetes mellitus or IGT and even among subjects with mild fasting hyperglycemia. If the aim is to recognize early diabetic states to apply prophylactic procedures to prevent or delay progression to more severe diabetic states and complications, A1C alone is not a sufficiently reliable tool or sensitive method for diagnosing early diabetes mellitus or IGT and additional plasma glucose determination should be added.
Acknowledgments
This work utilized the Biochemistry Core of the Michigan Diabetes Research and Training Center funded by DK020572 from the National Institute of Diabetes and Digestive and Kidney Diseases; U.S. Public Health Service Grant M-01-RR-00042 to the General Clinical Research Center and CTSA Grant UL1RR024986, all at the University of Michigan. We thank Yugandhar Kalagara for his help in preparing the tables.
Footnotes
Disclosure Statement: The authors have no conflicts to disclose.
Publisher's Disclaimer: This is a PDF file of an unedited manuscript that has been accepted for publication. As a service to our customers we are providing this early version of the manuscript. The manuscript will undergo copyediting, typesetting, and review of the resulting proof before it is published in its final citable form. Please note that during the production process errors may be discovered which could affect the content, and all legal disclaimers that apply to the journal pertain.
References
- 1.International Expert Committee. International Expert Committee report on the role of the A1C assay in the diagnosis of diabetes. Diabetes Care. 2009;32:1327–1334. doi: 10.2337/dc09-9033. [DOI] [PMC free article] [PubMed] [Google Scholar]
- 2.The Expert Committee on the Diagnosis and Classification of Diabetes Mellitus. Report of the Expert Committee on the Diagnosis and Classification of Diabetes Mellitus. Diabetes Care. 1997;20:1183–1197. doi: 10.2337/diacare.20.7.1183. [DOI] [PubMed] [Google Scholar]
- 3.World Health Organization. Part 1: Diagnosis and classification of diabetes mellitus. Geneva: World Health Org; 1999. Definition, diagnosis and classification of diabetes mellitus and its complications: Report of a WHO consultation. [Google Scholar]
- 4.Herman WH. Diabetes epidemiology: guiding clinical and public health practice: the Kelly West Award lecture. Diabetes Care. 2006;30:1912–9. doi: 10.2337/dc07-9924. [DOI] [PubMed] [Google Scholar]
- 5.Mohan V, Vijayachandrika V, Gokulakrishnan K, et al. A1C cut points to define various glucose intolerance groups in Asian Indians. Diabetes Care. 2010;33(3):515–9. doi: 10.2337/dc09-1694. [DOI] [PMC free article] [PubMed] [Google Scholar]
- 6.Cowie CC, Rust KF, Byrd-Holt DD, et al. Prevalence of diabetes and high risk for diabetes using hemoglobin A1c criteria in the U.S. population in 1988-2006. Diabetes Care. 2010;33(3):562–8. doi: 10.2337/dc09-1524. [DOI] [PMC free article] [PubMed] [Google Scholar]
- 7.Christensen DL, Witte DR, Kaduka L, et al. Moving to an A1C-Based Diagnosis of Diabetes Has a Different Impact on Prevalence in Different Ethnic Groups. Diabetes Care. 2010;33(3):580–2. doi: 10.2337/dc09-1843. [DOI] [PMC free article] [PubMed] [Google Scholar]
- 8.Engelgau MM, Thompson TJ, Herman WH, et al. Comparison of fasting and 2-hour glucose and HbA1c levels for diagnosing diabetes. Diagnostic criteria and performance revisited. Diabetes Care. 1997;20:785–91. doi: 10.2337/diacare.20.5.785. [DOI] [PubMed] [Google Scholar]
- 9.Saudek CD, Herman WH, Sacks DB, et al. A new look at screening and diagnosing diabetes mellitus. J Clin Endocrinol Metab. 2008;93:2447–2453. doi: 10.1210/jc.2007-2174. [DOI] [PubMed] [Google Scholar]
- 10.Moses RG, Cheung NW. Point/Counterpoint: Point: Universal screening for gestational diabetes mellitus. Diabetes Care. 2009;32:1349–1351. doi: 10.2337/dc09-0188. [DOI] [PMC free article] [PubMed] [Google Scholar]
- 11.Berger H, Sermer M. Point/Counterpoint: Counterpoint: Selective screening for gestational diabetes mellitus. Diabetes Care. 2009;32:1352–4. doi: 10.2337/dc09-0361. [DOI] [PMC free article] [PubMed] [Google Scholar]
- 12.Tuomilehto J, Lindström J, Eriksson JG, et al. Finnish Diabetes Prevention Study Group. Prevention of type 2 diabetes mellitus by changes in lifestyle among subjects with impaired glucose tolerance. N Engl J Med. 2001;344:1343–1350. doi: 10.1056/NEJM200105033441801. [DOI] [PubMed] [Google Scholar]
- 13.Knowler WC, Barrett-Connor E, Fowler S, et al. The Diabetes Prevention Program Research Group. Reduction in incidence of type 2 diabetes with life-style intervention or metformin. N Engl J Med. 2002;346:393–403. doi: 10.1056/NEJMoa012512. [DOI] [PMC free article] [PubMed] [Google Scholar]
- 14.UK Prospective Diabetes Study (UKPDS) Group. Effect of intensive blood-glucose control with metformin on complications in overweight patients with type 2 diabetes (UKPDS 34) Lancet. 1998;352:854–65. [PubMed] [Google Scholar]
- 15.Buchanan TA, Xiang AH, Peters RK, et al. Preservation of pancreatic β-cell function and prevention of type 2 diabetes by pharmacological treatment of insulin resistance in high-risk hispanic women. Diabetes. 2002;51(9):2796–2803. doi: 10.2337/diabetes.51.9.2796. [DOI] [PubMed] [Google Scholar]
- 16.DREAM (Diabetes REduction Assessment with ramipril and rosiglitazone Medication) Trial Investigators. Gerstein HC, Yusuf S, Bosch J, Pogue J, Sheridan P, Dinccag N, Hanefeld M, Hoogwerf B, Laakso M, Mohan V, Shaw J, Zinman B, Holman RR. Effect of rosiglitazone on the frequency of diabetes in patients with impaired glucose tolerance or impaired fasting glucose: a randomized controlled trial. Lancet. 2006;368(9541):1096–105. doi: 10.1016/S0140-6736(06)69420-8. [DOI] [PubMed] [Google Scholar]
- 17.Buell C, Kermah D, Davidson MB. Utility of A1C for diabetes screening in the 1999-2004 NHANES population. Diabetes Care. 2007;30:2233–5. doi: 10.2337/dc07-0585. [DOI] [PubMed] [Google Scholar]
- 18.Inoue K, Matsumoto M, Kobayashi Y. The combination of fasting plasma glucose and glycosylated hemoglobin predicts type 2 diabetes in Japanese workers. Diabetes Res Clin Pract. 2007;77:451–8. doi: 10.1016/j.diabres.2007.01.024. [DOI] [PubMed] [Google Scholar]
- 19.American Diabetes Association Standards of Medical Care in Diabetes—2010. Diabetes Care. 2010;33(Supp 1):S11–S61. doi: 10.2337/dc10-S011. [DOI] [PMC free article] [PubMed] [Google Scholar]
- 20.van ’t Riet E, Alssema M, Rijkelijkhuizen JM, Kostense PJ, Nijpels G, Dekker JM. Relationship between A1C and glucose levels in the general Dutch population: the new Hoorn study. Diabetes Care. 2010;33(1):61–6. doi: 10.2337/dc09-0677. [DOI] [PMC free article] [PubMed] [Google Scholar]
- 21.Abdul-Ghani MA, Stern MP, Lyssenko V, et al. Minimal Contribution of Fasting Hyperglycemia to the Incidence of Type 2 Diabetes in Subjects With Normal 2-h Plasma Glucose. Diabetes Care. 2010;33(3):557–61. doi: 10.2337/dc09-1145. [DOI] [PMC free article] [PubMed] [Google Scholar]
- 22.Herman WH, Ma Y, Uwaifo G, et al. Diabetes Prevention Program Research Group. Differences in A1C by race and ethnicity among patients with impaired glucose tolerance in the Diabetes Prevention Program. Diabetes Care. 2007;30:2453–7. doi: 10.2337/dc06-2003. [DOI] [PMC free article] [PubMed] [Google Scholar]
- 23.Herman WH, Cohen RM. Hemoglobin A1c: Teaching a New Dog Old Tricks. Ann Int Med. 2010;152 doi: 10.7326/0003-4819-152-12-201006150-00011. in press, June 2010. [DOI] [PubMed] [Google Scholar]