

Abstract
Ras functions as a molecular switch by cycling between the active GTP-bound state and the inactive GDP-bound state. It is known experimentally that there is another GTP-bound state called state 1. We investigate the conformational changes and fluctuations arising from the difference in the coordinations between the switch regions and ligands in the GTP- and GDP-bound states using a total of 830 ns of molecular-dynamics simulations. Our results suggest that the large fluctuations among multiple conformations of switch I in state 1 owing to the absence of coordination between Thr-35 and Mg2+ inhibit the binding of Ras to effectors. Furthermore, we elucidate the conformational heterogeneity in Ras by using principal component analysis, and propose a two-step reaction path from the GDP-bound state to the active GTP-bound state via state 1. This study suggests that state 1 plays an important role in signal transduction as an intermediate state of the nucleotide exchange process, although state 1 itself is an inactive state for signal transduction.
Introduction
H-Ras (hereafter referred to as Ras) is a monomeric guanine nucleotide-binding protein. Ras works as a molecular switch to regulate cell growth by utilizing GTP hydrolysis. Extracellular stimuli induce the exchange of GDP with GTP with the help of guanine nucleotide exchange factor (GEF) and the activation of Ras (1,2) (Fig. S1 in the Supporting Material). The GTP-bound Ras interacts with a variety of effector proteins and transduces signals that lead to cell growth (3–5). The active GTP-bound state is converted to the inactive GDP-bound state by GTP hydrolysis (6,7). Although Ras itself has GTPase activity, its intrinsic GTPase activity is very low. The GTPase activity is enhanced by five orders of magnitude by the binding of GTPase activating protein (GAP) (8,9).
The structures of the active GTP-bound (10) and inactive GDP-bound (11) states have been investigated with the use of x-ray crystallographic analyses. These analyses revealed that large conformational changes between these states are seen in two regions, the so-called switch I and II regions, around a nucleotide-binding site. Fig. 1, A and B, show the switch regions in the active GTP-bound and inactive GDP-bound states, respectively. Switch I consists of residues 30–38, which form loop 2 and a part of the β2 strand, whereas switch II consists of residues 60–72, which form loop 4 and the α2 helix. It is known that the conformational changes arise from the difference in the coordinations of Thr-35 and Gly-60 between the GTP- and GDP-bound states. It is also known that Thr-35 and Gly-60 are conserved in the Ras family, and that mutations of these residues abolish the activity of Ras (12–18).
Figure 1.
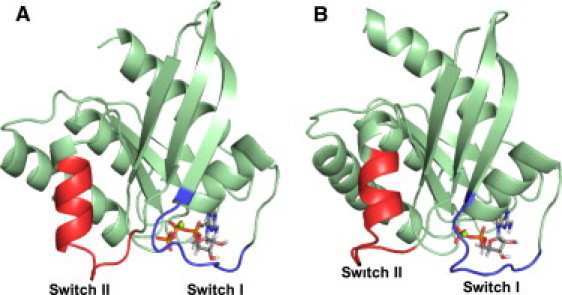
Conformational switches in the GTP-bound (A) and GDP-bound (B) states. Switch I consists of residues 30–38 and switch II consists of residues 60–72. The figures were generated with the open-source version of PyMOL (75).
In addition to the conformational changes, the conformational fluctuations in the GTP- and GDP-bound states have been extensively analyzed in various experiments (12,16,19–30). In particular, backbone 1H-, 13C-, and 15N-NMR spectroscopies have revealed that switches I and II show interconversions among multiple conformations in the GTP-bound state, whereas no such conformational fluctuations are seen in the GDP-bound state (19,20).
Multiple conformations of switches I and II in the GTP-bound Ras in solution have been investigated since the mid-1990s (20–23). High-frequency electron paramagnetic resonance spectra of the GTP-bound Ras binding Mn2+ showed that the interaction between Thr-35 and Mn2+ is transient in solution, although a firm interaction was observed in x-ray structural analyses (21,22). The presence of two conformations of switch I was shown by 31P-NMR spectroscopy of Ras in complex with a GTP analog, GppNHp (23). The existence of the two conformations in the GTP-bound state was also verified by fluorescence resonance energy transfer (24) and time-resolved Fourier transform infrared spectroscopy (25). These two conformation states are called state 1 and state 2 (23). State 2 is the predominant form of Ras observed in x-ray crystallographic analyses (16,23). In contrast, state 1, in which the coordination between Thr-35 and Mg2+ is absent or weak, is the predominant form of Ras variants, such as T35A (16,23,26), T35S (16,26), and G60A (18). The presence of state 1 is also found in Ras family proteins, such as M-Ras (27,28) and RalB (31), and a Rho family protein, Cdc42, bound to a GTP analog known as GMP-PCP (32). For another important residue, known as Gly-60, a hydrogen bond between γ-phosphate and Gly-60 is found in the crystal structures of T35S (16) and Cdc42 (32) (Gly-71 in RalB (31)), whereas the hydrogen bond is absent in G60A (18). However, because of the large fluctuations of switch II in state 1, its detailed structure has not yet been uncovered.
Various researchers have investigated the affinities of state 1 to effectors in an attempt to understand the properties of state 1 (16,18,27,28,33). The affinity to the effectors is substantially low in state 1 of the Ras variants. Ford et al. (18) showed that switches I and II of G60A in state 1 adopt an open conformation in which GTP and Mg2+ are exposed to bulk water. They also showed that G60A is a dominant negative mutant that wastes GEF to activate wild-type Ras by forming the stable complex with GEF. Liao et al. (28) showed that Ras family proteins with a higher population of state 1 exhibit higher dissociation and association rate constants for GTP. They suggested that state 1 is a precursor state of state 2 in the binding of the nucleotide-free state of Ras to GTP. Kalbitzer et al. (33) recently showed that T35S in complex with GEF adopts state 1, whereas T35S with an effector adopts state 2.
The conformational fluctuations in the active GTP-bound and inactive GDP-bound states, and the conformational change between the two states have been investigated theoretically. The fluctuations of the switch regions in the two states have been analyzed with the use of normal-mode analysis (34) and molecular-dynamics (MD) simulations (35). The pathways between the two states have been studied with a targeted MD simulation (36,37) and an accelerated MD simulation (38). The minimum energy pathway between the two states has been analyzed with the conjugate peak refinement method (39,40). The transition between the two states has also been analyzed via an MD simulation of the GDP-bound G12V (41), and the relationship between mechanical force generation and conformational relaxation induced by GTP hydrolysis has also been investigated by MD simulations (42). However, as far as we know, despite these extensive experimental studies, no theoretical studies on state 1 have been performed.
Ras is associated with membranes through the C-terminal farnesylated cysteine in vivo. The farnesylated cysteine is in the hypervariable region (HVR), which is involved in the difference in lateral segregation on the plasma membrane between the GTP- and GDP-bound states (43–45). The roles of HVR in GTP- and GDP-bound Ras have been investigated by both experimental and computational methods (44,46–49). It was found that the interactions between the plasma membrane and the C-terminal region alter the orientation of the catalytic domain of Ras with respect to the membrane. It was shown that the interactions between the membrane and the C-terminal region induce minor but potentially significant motional changes of the catalytic domain, in particular near the C-terminal region and switch II (49). Although the effects of the membrane are of considerable interest, the structure, fluctuations, and reactions in Ras even in the absence of the membrane still remain to be established.
In this work, we investigate the relationship between the conformational heterogeneity in the switch regions and the reaction cycle of Ras without the membrane using MD simulations and principal component analysis (PCA). First, we analyze the conformational difference between the active GTP-bound state (i.e., state 2) and the inactive GDP-bound state, and the conformational fluctuations in the two states. As mentioned above, several different groups (34–42) have described the conformational fluctuations and changes between the two states. In this study, however, we analyze the conformations of these states to comprehensively investigate the conformational heterogeneity of Ras not only in state 2 and the GDP-bound state, but also in state 1. Second, analyses of the conformational fluctuations of state 1 and the conformational change between states 1 and 2 are presented. We find that the open conformation with large fluctuations of switch I is induced by the absence of the coordination between Thr-35 and Mg2+. In addition, it is shown that the difference in the conformation of switch II in the GTP-bound state is caused by the difference in the coordination between Gly-60 and the γ-phosphate. Finally, we analyze the conformational heterogeneity in the switch regions in the GTP- and GDP-bound states with PCA. PCA describes collective coordinates related to the conformational displacements (50–60). The results suggest that the conformational change from the GDP-bound state to the active GTP-bound state takes place via open conformations like state 1.
Materials and Methods
We performed MD simulations for the GTP- and GDP-bound states. Table S1 summarizes the notations and coordinations in the states calculated in this study. As mentioned in the Introduction, Ras in state 2 (hereafter referred to as the GTP2 state) has coordinations between Thr-35 and Mg2+, and between Gly-60 and γ-phosphate. In contrast to the GTP2 state, the coordination between Thr-35 and Mg2+ is absent in state 1. We analyzed state 1 with and without the hydrogen bond between Gly-60 and γ-phosphate. These two kinds of state 1 are referred to as the GTP1w/HB and GTP1w/oHB state, respectively. The initial structure for the GTP2 state was obtained from the x-ray structure (PDB ID 5P21 (10)). The structure of loop 2 in the GTP1w/HB state was derived from homology modeling based on the x-ray structure of M-Ras (PDB ID 1X1S (27)). The initial structure of the remaining region in the GTP1w/HB state was taken from the GTP2 state (PDB ID 5P21). The initial structure for the GTP1w/oHB state was taken from the x-ray structure of the GTP-bound G60A (PDB ID 1XCM (18)). For the GTP1w/oHB state, an analog of cysteine in residue 118 in 1XCM was replaced with a cysteine and Lys-167 was truncated. The initial structure for the GDP-bound state (referred to as the GDP state) was obtained from the x-ray structure (PDB ID 4Q21 (11)).
All MD simulations were performed with the Gromacs 4 program (61). Amber ff03 (62) was used for the proteins and ions, and TIP3P (63) was used for water molecules. The parameters for guanine nucleotides were as determined by Meagher et al. (64). All of the systems were solvated in water boxes. Counterions were added for charge neutralization. The systems are listed in Table S2. The particle mesh Ewald method with cubic interpolation was applied to the long-range electrostatic interactions, and the short-range Coulomb and the van der Waals interactions decay smoothly to zero between 10 Å to 12 Å. Bonds involving hydrogen atoms were constrained with the SHAKE algorithm. The system was equilibrated for 500 ps at 300K under NVT conditions and run for 2 ns under NPT conditions at 0.1 MPa. The box lengths were adjusted by performing the equilibration run under NPT conditions (Table S2). After the initial equilibration period, an additional equilibration run was carried out for 3 ns under NVT conditions at 300K with a Nose-Hoover thermostat. The time constants for the temperature and pressure couplings to the bath were 0.1 ps and 1 ps, respectively. Each product run was performed for 50 ns for the GTP2, GTP1w/HB, and GDP states, and for 70 ns for the GTP1w/oHB state. The equilibration and product runs were performed with a time step of 2 fs. We performed several independent MD simulations from different initial structures representing these states to sample their broad configuration space. Three independent MD runs for the GTP2 state and four MD runs for the GTP1w/HB, GTP1w/oHB, and GDP states were performed, and thus we carried out 830 ns of MD simulations in total. The overall Cα root mean-square deviation (RMSD) remained below 3.5 Å for all product runs in each state (Fig. S2). In addition, the root mean-square fluctuations (RMSFs) of the Cα atoms were smaller than 1.0 Å for the nonloop regions, as shown in Fig. S3.
We carried out PCA by using all of the trajectories for the four states (i.e., the GTP1w/HB, GTP1w/oHB, GTP2, and GDP states) to examine the conformational displacements among these states. The details of the PCA calculations are given in the Supporting Material.
We used our previously developed TRAJAN program package (65) to analyze the structural and dynamic properties. The PCA, RMSD, RMSF, and backbone dihedral angles presented in this study were calculated with the TRAJAN program package.
Results and Discussion
Differences in conformation and conformational fluctuations between active GTP-bound and inactive GDP-bound states
The representative structures of switches I and II in the GTP2 states are shown in Fig. 2, A and B, respectively. The water molecules at the nucleotide-binding site are shown in Fig. S4. Mg2+ binds to the side-chain oxygen atoms of Thr-35 and Ser-17, the β- and γ-phosphates, and two water molecules. The γ-phosphate binds to the side chain of Lys-16, the backbone nitrogen atom of Gly-60, and water molecules, although the hydrogen bond between the γ-phosphate and Gly-60 is occasionally interrupted by the insertion of a water molecule. The hydrogen bond between Gly-60 and the γ-phosphate gives loop 4 a helical form in which Gln-61 and Glu-62 form weak hydrogen bonds. The first turn of the α2 helix is distorted because of the helical form of loop 4.
Figure 2.

Configurations of switches I and II in the GTP2 (A and B), GDP (C and D), GTP1w/HB (E and F), and GTP1w/oHB (G and H) states. The sphere represents Mg2+. The figures were generated with the open-source version of PyMOL (75).
Fig. 2, C and D, show the structures of the switches in the GDP state. In the GDP state the γ-phosphate is lost due to GTP hydrolysis. As a result, the coordination of Mg2+ to the γ-phosphate is replaced with one to a water molecule. In addition, the coordination of Thr-35 to Mg2+ is absent. Instead, Thr-35 forms a weak hydrogen bond with the carboxylate group of Asp-33 via the side-chain oxygen atom, and thus a turn is formed in loop 2 in the GDP state. In switch II, the hydrogen bond between Gly-60 and the γ-phosphate is absent and Gly-60 is totally solvent-exposed. Furthermore, the hydrogen bonds in Gln-61 and Glu-62 are absent, and loop 4 is exposed to bulk water. In contrast to the GTP2 state, the first turn of the α2 helix is stable. These conformational differences between the states caused by the change in coordinations of Thr-35-Mg2+ and Gly-60-γ-phosphate are found in loop 2, loop 4, and the α2 helix (Fig. S5 A).
The conformational difference in loop 2 results in the different backbone dihedral angles of residues Pro-34-Ile-36 (Fig. 3 A). Residues Pro-34-Thr-35 adopt an extended form (ψ ∼180) and Ile-36 adopts a wound form (−120 < ψ < 0) in the GTP2 state. By contrast, in the GDP state, residues Pro-34-Thr-35 adopt a wound form and Ile-36 adopts an extended form. The conformational difference in loop 4 leads to the different dihedral angles of residues Ala-59-Ser-65 and the backbone hydrogen bonds between these states (Fig. 3 B and Fig. S6). In the GTP2 state, residues other than Ala-59 and Glu-61 in loop 4 switch to a wound form due to the hydrogen bonds of Gly-60, Gln-61, and Glu-62. In the GDP state, residues Ala-59-Glu-62 adopt an extended form as well as a wound form and show an interconversion between these forms, whereas residues Glu-63-Ser-65 show a stable extended form (Fig. S7 A). Thus, in contrast to the GTP2 state, stable α-helical hydrogen bonds are formed in the α2 helix.
Figure 3.
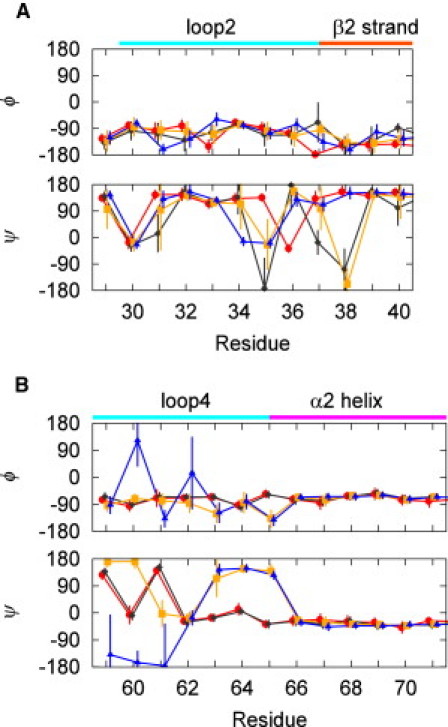
Backbone ϕ and ψ dihedral angles of the residues in switch I (A) and switch II (B). The upper and lower graphs display the ϕ and ψ angles, respectively. The circles, diamonds, squares, and triangles show the angles in the GTP2, GTP1w/HB, GTP1w/oHB, and GDP states, respectively. The error bars represent the standard deviations.
The differences in the backbone conformation induce changes in the conformations of the side chains. In particular, large conformational changes in the side chains are found at Tyr-32, Thr-35, and Tyr-64 (Fig. 2, A–D). The different orientations of these side chains between the GTP2 and GDP states were previously observed in x-ray structural analyses (10,11,29). It is also known that the side chains of Tyr-32 and Tyr-64 are involved in binding to effectors (66,67) and GEF (68). Our results show that the extensive rearrangements of the side chains in switches I and II are caused by the difference in the coordinations, i.e., Thr-35-Mg2+ and Gly-60-γ-phosphate, between the two states.
Fig. 4, A and B, show the RMSF of the Cα atoms in switches I and II, respectively. The fluctuation of switch I in the GDP state is similar to that in the GTP2 state, although the fluctuations of Thr-35 and Ile-36 in the GDP state are larger than those in the GTP2 state because of the absence of the coordination between Thr-35 and Mg2+. The fluctuations of loop 4 in the GDP state are more than twice that in the GTP2 state. The large fluctuations of loop 4 in the GDP-bound state are attributed to the two conformations of residues Ala-59-Glu-62. On the other hand, the fluctuation of the α2 helix in the GTP2 state is slightly larger than that in the GDP state due to the distortion of the first turn of the α2 helix in the GTP2 state. The difference in the coordinations, i.e., Thr-35-Mg2+ and Gly-60-γ-phosphate, causes the change in the conformational fluctuations and the conformational changes in switches I and II.
Figure 4.
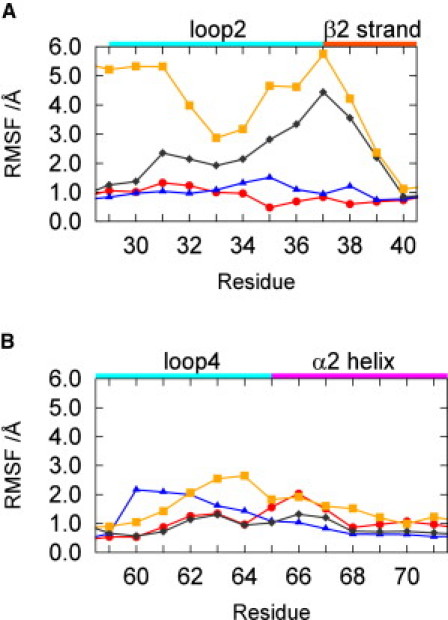
RMSF of the Cα atoms in (A) switch I and (B) switch II. The circles, diamonds, squares, and triangles show the RMSF in the GTP2, GTP1w/HB, GTP1w/oHB, and GDP states, respectively.
Experimental studies have shown the large fluctuations of the switch regions in the GTP-bound state (19,20). In the GTP2 state, however, the fluctuations of switches I and II are not significantly larger than those of the other loops because of the stable coordinations of Thr-35-Mg2+ and Gly-60-γ-phosphate (Fig. S3). Our results show that the large experimentally observed fluctuations of switches I and II in the GTP-bound state are not due to intrinsic fluctuations in the GTP2 state only, but rather to the interconversion between different conformational states, as shown below.
Differences in conformation and conformational fluctuation between state 1 and state 2
The representative structures of switch I in the GTP1w/HB and GTP1w/oHB states are shown in Fig. 2, E and G, respectively. In both the GTP1w/HB and GTP1w/oHB states, the coordination between Thr-35 and Mg2+ is lost and Mg2+ forms a bond with a water molecule in the bulk water (Fig. S4, C and D). The absence of this coordination results in an overall conformational change of loop 2, i.e., the steric hindrance between Pro-34 and the γ-phosphate, the orientational change of the side chain of Tyr-32, and the change in the hydrogen bonds between loop 2 and the ribose of GTP. The hydrogen bonds between loop 2 and the ribose are very weak in the GTP1w/HB and GTP1w/oHB states, whereas the ribose forms stable hydrogen bonds with Var-29 and Asp-30 in both the GTP2 and GDP states (Fig. S4). The orientational change of Tyr-32 (20,23) and the break of the hydrogen bonds between the ribose and loop 2 (27) in state 1 have indeed been observed experimentally. The overall conformational change of loop 2 facilitates an open conformation of the β2-β3 sheet, as shown in Fig. S5 B. Fig. 3 A shows the backbone dihedral angles for switch I in the GTP1w/HB, GTP1w/oHB, and GTP2 states. The difference in the coordination of Thr-35-Mg2+ between the GTP2 state and state 1 causes the difference in the dihedral angles of residues Pro-34-Asp-38. Fig. 3 A also shows that the dispersions of the dihedral angles in switch I in the GTP1w/HB and GTP1w/oHB states are much larger than those in the GTP2 state. The large dispersions in these states are attributed to the existence of both an extended form and a wound form in the residues of switch I (Fig. S7, B–G).
Next, we analyzed the conformation of switch II. Fig. 2, F and H, display the structures of switch II in the GTP1w/HB and GTP1w/oHB states, respectively. The hydrogen bond between Gly-60 and the γ-phosphate is present in the GTP1w/HB state, whereas it is replaced by bonds to water molecules in the GTP1w/oHB state. Fig. S5 B shows that switch II in the GTP1w/HB state adopts a closed conformation as the GTP2 state, whereas switch II in the GTP1w/oHB state adopts an open conformation as the GDP state. The difference in the conformation arises from the difference in the coordination of Gly-60 to the γ-phosphate. This conformational change results in a difference in the dihedral angles between these states (Fig. 3 B). The dihedral angles in the GTP1w/HB state are similar to those in the GTP2 state, whereas the dihedral angles in the GTP1w/oHB state are similar to those in the GDP state. The conformational difference also results in different backbone hydrogen bonds in loop 4 and the α2 helix (Fig. S6). Furthermore, a difference in the orientations of the side chains in switch II between the GTP1w/HB and GTP1wo/HB states is found (Fig. 2, B, F, and H).
We analyzed the RMSF of the GTP1w/HB and GTP1w/oHB states. Fig. 4 A shows that the fluctuations of switch I in the GTP1w/HB and GTP1w/oHB states are significantly larger than those in the GTP2 and GDP states. Furthermore, in the GTP1w/HB and GTP1w/oHB states the fluctuations of switch I are large in comparison with the other loops (Fig. S3). These large fluctuations of switch I in the GTP1w/HB and GTP1w/oHB states are attributed to the existence of two forms in the residues of switch I caused by the absence of the coordination of Thr-35-Mg2+. It is known that switch I is the recognition region for various effectors (e.g., PI3Kγ RBD and Raf RBD (69–71)), and residues Glu-37-Ser-39 form an interprotein β-sheet with the effector. It is also known that the affinity of state 1 to the effector is low (16,18,27). Our study suggests that the large fluctuations of switch I in the GTP1w/HB and GTP1w/oHB states inhibit the formation of the β-sheet with the effectors.
Fig. 4 also shows that the fluctuation of loop 4 in the GTP1w/oHB state is larger than that in the GTP1w/HB state because of the absence of coordination between Gly-60 and the γ-phosphate. This result shows that the conformational fluctuation of switch II depends on the coordination between Gly-60 and the γ-phosphate. We also found that the fluctuation of loop 4 in the GTP1w/oHB state is not significantly larger than those of the other loops (Fig. S3). It is known from structural analyses of T35S that the conformational fluctuation of switch II in state 1 is as large as that of switch I (16). It is conceivable, therefore, that the large experimentally observed fluctuations of switch II in state 1 are attributable to the interconversion between the GTP1w/oHB and GTP1w/HB states rather than the fluctuation of loop 4 in the GTP1w/oHB state.
PCA of the GTP- and GDP-bound states
The above results show that the change in the coordinations of Thr-35 and Gly-60 leads to the conformational heterogeneity in Ras. We calculated the PCA of the four states (i.e., the GTP1w/HB, GTP1w/oHB, GTP2, and GDP states) to examine the conformational displacement among these states. The first three PC subspaces describe 33.1%, 26.4%, and 11.3% of the total displacement. Because the first two PCs account for almost 60% of the variance, we will discuss the conformational changes in the states by using these two PCs below. Fig. 5 A and Fig. S8 A show that the first PC is mainly related to the open-closed movements of loops 2 and 4, and the distortion of the first turn of the α2 helix, which is induced by changes in the coordinations between Thr-35 and Mg2+ and between Gly-60 and γ-phosphate. The second PC corresponds to the open-closed movements of loop 2 and the β2 strand, which are attributed to changes in the interaction between Pro-34 and the γ-phosphate, and in the backbone hydrogen bonds in the β2-β3 sheet (Fig. 5 B and Fig. S8 B).
Figure 5.
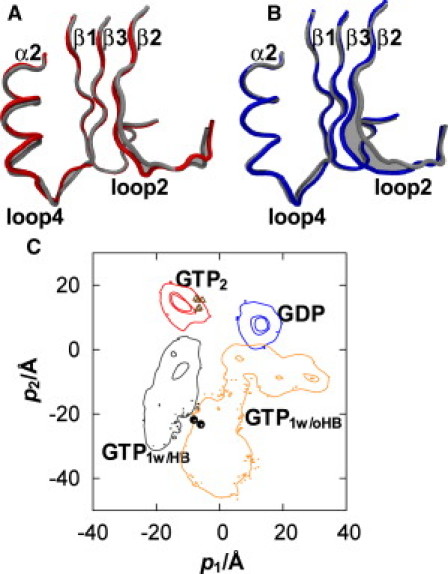
The first (A) and second (B) PCs of the four states. The structure averaged over the four states is shown as the thin tube. The shades represent the first and second PCs as displacements from the averaged structure. The projections of the GTP2, GTP1w/HB, GTP1w/oHB, and GDP states onto the first and second PCs are shown with the contour lines (C). The x-ray structures of the GTP-bound Ras in a complex with the effectors and nucleotide-free Ras binding to GEF are shown by triangles and circles, respectively.
We analyzed the conformational differences of Ras with the first two PCs, i.e., the projection of the displacement vector between an instantaneous structure in state n and the structure averaged over the four states onto the k-th PC (Fig. S9). The details of the calculation of the projection are given in the Supporting Material. Fig. 5 C shows the distributions of the projections for the four states. The distributions of all of the states are located at different positions on the PCA map with respect to the two PCs. This indicates the conformational differences of switches I and II among the four states caused by the differences in the coordinations, i.e., Thr-35-Mg2+ and Gly-60-γ-phosphate. The distribution also shows the extent of the fluctuation in each state: the narrow distributions of the GTP2 and GDP states represent their small fluctuations, whereas the wide distributions of the GTP1w/HB and GTP1w/oHB states indicate their large fluctuations.
We also calculated the projections on the PCA map of the x-ray structures when Ras binds to effectors, i.e., RalGDS (70), PI3Kγ RBD (71), and GAP (72). Because the conformations of the complexes between the GTP-bound Ras and the effectors are very similar to that in the GTP2 state, the positions of these states (shown by triangles in Fig. 5 C) are located inside the distribution of the GTP2 state. The projections of the x-ray structures of the nucleotide-free state binding to GEF (1,73) were also calculated. As shown by circles in Fig. 5 C, the position of the GEF-bound nucleotide-free state is located between the distributions of the GTP1w/HB and GTP1w/oHB states. The GEF-bound nucleotide-free state adopts an open conformation for switch I, which is similar to those in the GTP1w/HB and GTP1w/oHB states (1,73). We calculated the structure with p1- and p2-values corresponding to the x-ray structure of the GEF-bound nucleotide-free state and the structure averaged over the four states (Fig. S10 A). Although the four-state averaged structure adopts a closed conformation, the predicted structure corresponding to the experimental GEF-bound nucleotide-free state adopts an open conformation. Fig. S10 A demonstrates that similarities are evident between the x-ray structure of the GEF-bound nucleotide-free state and the structure predicted with p1- and p2-values corresponding to the experimental structure.
The above results show that the conformational change among these four states can be reproduced qualitatively by the two major axes. Based on the distributions of the four states calculated from the MD simulations and the positions of the experimentally observed states, we propose a two-step reaction path for the nucleotide exchange process, i.e., from the GDP state to the GTP2 state. The first step is the path from the GDP state to the GEF-bound nucleotide-free state, which is characterized by the opening of switch I, particularly the β2 strand. As shown in Fig. S10 B, the conformation of the backbone of the β2 strand changes from an extended form to a wound form in this step. We also find that the opening of switch I causes a change in the coordinations of Asp-30 and Glu-37. In the GDP state, the backbone atom of Asp-30 binds to the ribose, and the side chain of Glu-37 forms weak hydrogen bonds with Ala-59 and Arg-68. In contrast, the hydrogen bonds of Asp-30 and Glu-37 are lost in the calculated GEF-bound nucleotide-free state. It should be noted that in a real system, the side-chain atoms of Asp-30 and Glu-37 form salt bridges with GEF (73). The salt bridges between switch I and GEF facilitate the opening of switch I, and thus a helical hairpin of GEF is inserted into the space created by the opening of switch I.
In the second step, the GEF-bound nucleotide-free state is converted to the GTP2 state via a state with an open conformation to allow the binding of GTP and Mg2+. The second step is characterized by the closing of switch I, i.e., the conversion from state 1 to state 2 (Fig. S10 B). The backbone of the β2 strand is converted into an extended form, and thus the β2-β3 sheet is reformed. In addition, the change in coordination between the ribose and Asp-30 is found along the path at the second step: the ribose forms a weak hydrogen bond with the side chain of Asp-30 at an early stage and eventually binds to the backbone of Asp-30. In the second step, the side chain of Asp-30 becomes solvent-exposed, and the backbone of Asp-30 moves near to the nucleotide (Fig. S4 A). Therefore, the coordinations involving the residues in switch I, particularly Asp-30, could be utilized as a marker to probe the conformational change in the nucleotide exchange process.
The reaction path suggested in Fig. 5 C is in agreement with a recently proposed mechanism wherein state 1 is involved in the nucleotide exchange process (28,33). Kalbitzer et al. (33) demonstrated that state 1 adopts the open conformation that interacts with GEF. Liao et al. (28) showed that the association rate of GTP to state 1 is higher than that to the GTP2 state, due to the open conformation. These experimental results are in agreement with our findings that the exchange of the nucleotide takes place through a state with an open conformation like state 1. Furthermore, our results are consistent with a recent theoretical finding that the direct path from the GDP state to the GTP2 state has a large energy barrier that is difficult to overcome with conventional and accelerated MD simulations (38). The results also show that our approach, which involves searching for reaction coordinates by using PCA in several states, can be used to analyze slow processes involving cooperative conformational changes, such as the nucleotide exchange process.
Conclusions
We investigated the relationship between the conformational heterogeneity in Ras and its reaction cycle by using MD simulations and PCA. First, we analyzed the changes in the conformations between the active GTP-bound state (i.e., state 2) and the inactive GDP-bound state. We showed that the conformational differences in switches I and II arise from the difference in the coordinations (i.e., Thr-35-Mg2+ and Gly-60-γ-phosphate). We also showed that the difference in these coordinations results in the conformational differences in the side chains, in particular Tyr-32 and Tyr-64, which are key residues in the binding of Ras to the effectors (66–68).
We also investigated the conformational differences between state 1 (i.e., the GTP1w/HB and GTP1w/oHB states) and state 2 (i.e., the GTP2 state). We found that switch I in the GTP1w/HB and GTP1w/oHB states adopts multiple conformations caused by the absence of the coordination between Thr-35 and Mg2+. Our results suggest that the large fluctuations among the multiple conformations of switch I in the GTP1w/HB and GTP1w/oHB states inhibit the formation of complexes with effectors (16,18,27). We found that the breakage of the hydrogen bond between Gly-60 and the γ-phosphate causes the conformational difference in the secondary structure of switch II between the GTP1w/HB and GTP1w/oHB states. We also found conformational differences in the side chains in switches I and II between these states. We attribute the large fluctuations of switch II in the GTP-bound state to the interconversion between the two different conformations characterized by the presence or absence of the coordination of Gly-60-γ-phosphate.
The conformational heterogeneity among all four states (i.e., the GTP1w/HB, GTP1w/oHB, GTP2, and GDP states) was investigated in terms of PCA. The distributions of the states to different positions on the PCA map with respect to the first two PCs illustrate the conformational heterogeneity in Ras. We also calculated the loci on the PCA map of the x-ray structures for Ras bound to effectors and the GEF-bound nucleotide-free state. The results suggest a two-step nucleotide exchange reaction path from the GDP-bound state to the GTP-bound state via a conformation like state 1. The two steps are characterized by the opening and closing of switch I, respectively. This path is consistent with a recently proposed mechanism wherein state 1 is involved in the nucleotide exchange process (28,33).
It is known that state 1 itself is inactive with respect to signal transduction. However, our suggest that state 1 plays an essential role in controlling signal transduction, not only as a resting state but also as an intermediate state to the active GTP-bound state. Further studies are required to elucidate the physiological importance of state 1 in the function of Ras. In addition, the effects of the membrane and HVR on the conformation of state 1 and the nucleotide exchange process should be examined in future studies.
Acknowledgments
Note added in proof: The complete tertiary structures of H-RasT35S were published in a recent study (74). That study revealed that Ras in state 1 adopts two distinct structures: form 1 and form 2. The deviations between the two forms arise from the difference in the interactions between Gly-60 and the γ-phosphate, and between the ribose and switch I. These observed forms would be related to the GTP1w/oHB and GTP1w/HB states discussed in this study.
We thank Prof. T. Kataoka, Dr. F. Shima, and Dr. Y. Arai for their input, and Dr. M. Higashi, Dr. T. Sumikama, and Dr. T. Yagasaki for critical readings of the manuscript.
This research was supported in part by the Next Generation Super Computing project, and Grant-in-Aid for Scientific Research (Nos. 18066018 and 22350013). The calculations were carried out mainly by the supercomputers in the Research Center for Computational Science, Institute for Molecular Science (Okazaki, Japan).
Supporting Material
References
- 1.Boriack-Sjodin P.A., Margarit S.M., Kuriyan J. The structural basis of the activation of Ras by Sos. Nature. 1998;394:337–343. doi: 10.1038/28548. [DOI] [PubMed] [Google Scholar]
- 2.Vetter I.R., Wittinghofer A. The guanine nucleotide-binding switch in three dimensions. Science. 2001;294:1299–1304. doi: 10.1126/science.1062023. [DOI] [PubMed] [Google Scholar]
- 3.Barbacid M. Ras genes. Annu. Rev. Biochem. 1987;56:779–827. doi: 10.1146/annurev.bi.56.070187.004023. [DOI] [PubMed] [Google Scholar]
- 4.Lowy D.R., Willumsen B.M. Function and regulation of ras. Annu. Rev. Biochem. 1993;62:851–891. doi: 10.1146/annurev.bi.62.070193.004223. [DOI] [PubMed] [Google Scholar]
- 5.Vojtek A.B., Der C.J. Increasing complexity of the Ras signaling pathway. J. Biol. Chem. 1998;273:19925–19928. doi: 10.1074/jbc.273.32.19925. [DOI] [PubMed] [Google Scholar]
- 6.Bourne H.R., Sanders D.A., McCormick F. The GTPase superfamily: a conserved switch for diverse cell functions. Nature. 1990;348:125–132. doi: 10.1038/348125a0. [DOI] [PubMed] [Google Scholar]
- 7.Bourne H.R., Sanders D.A., McCormick F. The GTPase superfamily: conserved structure and molecular mechanism. Nature. 1991;349:117–127. doi: 10.1038/349117a0. [DOI] [PubMed] [Google Scholar]
- 8.Gideon P., John J., Wittinghofer A. Mutational and kinetic analyses of the GTPase-activating protein (GAP)-p21 interaction: the C-terminal domain of GAP is not sufficient for full activity. Mol. Cell. Biol. 1992;12:2050–2056. doi: 10.1128/mcb.12.5.2050. [DOI] [PMC free article] [PubMed] [Google Scholar]
- 9.Sermon B.A., Lowe P.N., Eccleston J.F. The importance of two conserved arginine residues for catalysis by the ras GTPase-activating protein, neurofibromin. J. Biol. Chem. 1998;273:9480–9485. doi: 10.1074/jbc.273.16.9480. [DOI] [PubMed] [Google Scholar]
- 10.Pai E.F., Krengel U., Wittinghofer A. Refined crystal structure of the triphosphate conformation of H-ras p21 at 1.35 A resolution: implications for the mechanism of GTP hydrolysis. EMBO J. 1990;9:2351–2359. doi: 10.1002/j.1460-2075.1990.tb07409.x. [DOI] [PMC free article] [PubMed] [Google Scholar]
- 11.Milburn M.V., Tong L., Kim S.H. Molecular switch for signal transduction: structural differences between active and inactive forms of protooncogenic ras proteins. Science. 1990;247:939–945. doi: 10.1126/science.2406906. [DOI] [PubMed] [Google Scholar]
- 12.White M.A., Nicolette C., Wigler M.H. Multiple Ras functions can contribute to mammalian cell transformation. Cell. 1995;80:533–541. doi: 10.1016/0092-8674(95)90507-3. [DOI] [PubMed] [Google Scholar]
- 13.Sung Y.J., Carter M., Hwang Y.W. Mutagenesis of the H-ras p21 at glycine-60 residue disrupts GTP-induced conformational change. Biochemistry. 1995;34:3470–3477. doi: 10.1021/bi00010a040. [DOI] [PubMed] [Google Scholar]
- 14.Hwang M.C.C., Sung Y.J., Hwang Y.W. The differential effects of the Gly-60 to Ala mutation on the interaction of H-Ras p21 with different downstream targets. J. Biol. Chem. 1996;271:8196–8202. doi: 10.1074/jbc.271.14.8196. [DOI] [PubMed] [Google Scholar]
- 15.Rodriguez-Viciana P., Warne P.H., Downward J. Role of phosphoinositide 3-OH kinase in cell transformation and control of the actin cytoskeleton by Ras. Cell. 1997;89:457–467. doi: 10.1016/s0092-8674(00)80226-3. [DOI] [PubMed] [Google Scholar]
- 16.Spoerner M., Herrmann C., Wittinghofer A. Dynamic properties of the Ras switch I region and its importance for binding to effectors. Proc. Natl. Acad. Sci. USA. 2001;98:4944–4949. doi: 10.1073/pnas.081441398. [DOI] [PMC free article] [PubMed] [Google Scholar]
- 17.Fiordalisi J.J., Holly S.P., Cox A.D. A distinct class of dominant negative Ras mutants: cytosolic GTP-bound Ras effector domain mutants that inhibit Ras signaling and transformation and enhance cell adhesion. J. Biol. Chem. 2002;277:10813–10823. doi: 10.1074/jbc.M107684200. [DOI] [PubMed] [Google Scholar]
- 18.Ford B., Skowronek K., Nassar N. Structure of the G60A mutant of Ras: implications for the dominant negative effect. J. Biol. Chem. 2005;280:25697–25705. doi: 10.1074/jbc.M502240200. [DOI] [PubMed] [Google Scholar]
- 19.Kraulis P.J., Domaille P.J., Laue E.D. Solution structure and dynamics of Ras P21⋅Gdp determined by heteronuclear 3-dimensional and 4-dimensional NMR-spectroscopy. Biochemistry. 1994;33:3515–3531. doi: 10.1021/bi00178a008. [DOI] [PubMed] [Google Scholar]
- 20.Ito Y., Yamasaki K., Miyazawa T. Regional polysterism in the GTP-bound form of the human c-Ha-Ras protein. Biochemistry. 1997;36:9109–9119. doi: 10.1021/bi970296u. [DOI] [PubMed] [Google Scholar]
- 21.Halkides C.J., Bellew B.F., Singel D.J. High frequency (139.5 GHz) electron paramagnetic resonance spectroscopy of the GTP form of p21 ras with selective O-17 labeling of threonine. Biochemistry. 1996;35:12194–12200. doi: 10.1021/bi9605954. [DOI] [PubMed] [Google Scholar]
- 22.Bellew B.F., Halkides C.J., Singel D.J. High frequency (139.5 GHz) electron paramagnetic resonance characterization of Mn(II)-(H2O)-O-17 interactions in GDP and GTP forms of p21 ras. Biochemistry. 1996;35:12186–12193. doi: 10.1021/bi960594b. [DOI] [PubMed] [Google Scholar]
- 23.Geyer M., Schweins T., Kalbitzer H.R. Conformational transitions in p21(ras) and in its complexes with the effector protein Raf-RBD and the GTPase activating protein GAP. Biochemistry. 1996;35:10308–10320. doi: 10.1021/bi952858k. [DOI] [PubMed] [Google Scholar]
- 24.Arai Y., Iwane A.H., Yanagida T. Dynamic polymorphism of Ras observed by single molecule FRET is the basis for molecular recognition. Biochem. Biophys. Res. Commun. 2006;343:809–815. doi: 10.1016/j.bbrc.2006.03.031. [DOI] [PubMed] [Google Scholar]
- 25.Kötting C., Kallenbach A., Gerwert K. Surface change of Ras enabling effector binding monitored in real time at atomic resolution. ChemBioChem. 2007;8:781–787. doi: 10.1002/cbic.200600552. [DOI] [PubMed] [Google Scholar]
- 26.Spoerner M., Wittinghofer A., Kalbitzer H.R. Perturbation of the conformational equilibria in Ras by selective mutations as studied by 31P NMR spectroscopy. FEBS Lett. 2004;578:305–310. doi: 10.1016/j.febslet.2004.11.020. [DOI] [PubMed] [Google Scholar]
- 27.Ye M., Shima F., Kataoka T. Crystal structure of M-Ras reveals a GTP-bound “off” state conformation of Ras family small GTPases. J. Biol. Chem. 2005;280:31267–31275. doi: 10.1074/jbc.M505503200. [DOI] [PubMed] [Google Scholar]
- 28.Liao J.L., Shima F., Kataoka T. Two conformational states of Ras GTPase exhibit differential GTP-binding kinetics. Biochem. Biophys. Res. Commun. 2008;369:327–332. doi: 10.1016/j.bbrc.2008.01.169. [DOI] [PubMed] [Google Scholar]
- 29.Scheidig A.J., Burmester C., Goody R.S. The pre-hydrolysis state of p21(ras) in complex with GTP: new insights into the role of water molecules in the GTP hydrolysis reaction of ras-like proteins. Structure. 1999;7:1311–1324. doi: 10.1016/s0969-2126(00)80021-0. [DOI] [PubMed] [Google Scholar]
- 30.Murakoshi H., Iino R., Kusumi A. Single-molecule imaging analysis of Ras activation in living cells. Proc. Natl. Acad. Sci. USA. 2004;101:7317–7322. doi: 10.1073/pnas.0401354101. [DOI] [PMC free article] [PubMed] [Google Scholar]
- 31.Fenwick R.B., Prasannan S., Owen D. Solution structure and dynamics of the small GTPase RalB in its active conformation: significance for effector protein binding. Biochemistry. 2009;48:2192–2206. doi: 10.1021/bi802129d. [DOI] [PubMed] [Google Scholar]
- 32.Phillips M.J., Calero G., Cerione R.A. Effector proteins exert an important influence on the signaling-active state of the small GTPase Cdc42. J. Biol. Chem. 2008;283:14153–14164. doi: 10.1074/jbc.M706271200. [DOI] [PMC free article] [PubMed] [Google Scholar]
- 33.Kalbitzer H.R., Spoerner M., Kremer W. Fundamental link between folding states and functional states of proteins. J. Am. Chem. Soc. 2009;131:16714–16719. doi: 10.1021/ja904314q. [DOI] [PubMed] [Google Scholar]
- 34.Ma J.P., Karplus M. Ligand-induced conformational changes in ras p21: a normal mode and energy minimization analysis. J. Mol. Biol. 1997;274:114–131. doi: 10.1006/jmbi.1997.1313. [DOI] [PubMed] [Google Scholar]
- 35.Díaz J.F., Wroblowski B., Engelborghs Y. Molecular dynamics simulation of the solution structures of Ha-ras-p21 GDP and GTP complexes: flexibility, possible hinges, and levers of the conformational transition. Biochemistry. 1995;34:12038–12047. doi: 10.1021/bi00037a047. [DOI] [PubMed] [Google Scholar]
- 36.Díaz J.F., Wroblowski B., Engelborghs Y. Calculation of pathways for the conformational transition between the GTP- and GDP-bound states of the Ha-ras-p21 protein: calculations with explicit solvent simulations and comparison with calculations in vacuum. Proteins. 1997;28:434–451. [PubMed] [Google Scholar]
- 37.Ma J.P., Karplus M. Molecular switch in signal transduction: reaction paths of the conformational changes in ras p21. Proc. Natl. Acad. Sci. USA. 1997;94:11905–11910. doi: 10.1073/pnas.94.22.11905. [DOI] [PMC free article] [PubMed] [Google Scholar]
- 38.Grant B.J., Gorfe A.A., McCammon J.A. Ras conformational switching: simulating nucleotide-dependent conformational transitions with accelerated molecular dynamics. PLOS Comput. Biol. 2009;5:e1000325. doi: 10.1371/journal.pcbi.1000325. [DOI] [PMC free article] [PubMed] [Google Scholar]
- 39.Nóe F., Ille F., Fischer S. Automated computation of low-energry pathways for complex Rearrangements in proteins: Application to the conformational switch of ras p21. Proteins. 2005;59:534–544. doi: 10.1002/prot.20422. [DOI] [PubMed] [Google Scholar]
- 40.Nóe F., Krachtus D., Fischer S. Transition networks for the comprehensive characterization of complex conformational change in proteins. J. Chem. Theory Comput. 2006;2:840–857. doi: 10.1021/ct050162r. [DOI] [PubMed] [Google Scholar]
- 41.Gorfe A.A., Grant B.J., McCammon J.A. Mapping the nucleotide and isoform-dependent structural and dynamical features of Ras proteins. Structure. 2008;16:885–896. doi: 10.1016/j.str.2008.03.009. [DOI] [PMC free article] [PubMed] [Google Scholar]
- 42.Kosztin I., Bruinsma R., Schulten K. Mechanical force generation by G proteins. Proc. Natl. Acad. Sci. USA. 2002;99:3575–3580. doi: 10.1073/pnas.052209199. [DOI] [PMC free article] [PubMed] [Google Scholar]
- 43.Prior I.A., Muncke C., Hancock J.F. Direct visualization of Ras proteins in spatially distinct cell surface microdomains. J. Cell Biol. 2003;160:165–170. doi: 10.1083/jcb.200209091. [DOI] [PMC free article] [PubMed] [Google Scholar]
- 44.Abankwa D., Gorfe A.A., Hancock J.F. Ras nanoclusters: molecular structure and assembly. Semin. Cell Dev. Biol. 2007;18:599–607. doi: 10.1016/j.semcdb.2007.08.003. [DOI] [PMC free article] [PubMed] [Google Scholar]
- 45.Prior I.A., Harding A., Hancock J.F. GTP-dependent segregation of H-ras from lipid rafts is required for biological activity. Nat. Cell Biol. 2001;3:368–375. doi: 10.1038/35070050. [DOI] [PubMed] [Google Scholar]
- 46.Abankwa D., Gorfe A.A., Hancock J.F. Mechanisms of Ras membrane organization and signalling: Ras on a rocker. Cell Cycle. 2008;7:2667–2673. doi: 10.4161/cc.7.17.6596. [DOI] [PMC free article] [PubMed] [Google Scholar]
- 47.Abankwa D., Gorfe A.A., Hancock J.F. Ras membrane orientation and nanodomain localization generate isoform diversity. Proc. Natl. Acad. Sci. USA. 2010;107:1130–1135. doi: 10.1073/pnas.0903907107. [DOI] [PMC free article] [PubMed] [Google Scholar]
- 48.Abankwa D., Hanzal-Bayer M., Hancock J.F. A novel switch region regulates H-ras membrane orientation and signal output. EMBO J. 2008;27:727–735. doi: 10.1038/emboj.2008.10. [DOI] [PMC free article] [PubMed] [Google Scholar]
- 49.Gorfe A.A., Hanzal-Bayer M., McCammon J.A. Structure and dynamics of the full-length lipid-modified H-Ras protein in a 1,2-dimyristoylglycero-3-phosphocholine bilayer. J. Med. Chem. 2007;50:674–684. doi: 10.1021/jm061053f. [DOI] [PubMed] [Google Scholar]
- 50.Karplus M., Kushick J.N. Method for estimating the configurational entropy of macromolecules. Macromolecules. 1981;14:325–332. [Google Scholar]
- 51.Levy R.M., Karplus M., Perahia D. Evaluation of the configurational entropy for proteins—application to molecular-dynamics simulations of an α-helix. Macromolecules. 1984;17:1370–1374. [Google Scholar]
- 52.Levy R.M., Rojas O.D., Friesner R.A. Quasi-harmonic method for calculating vibrational-spectra from classical simulations on multidimensional anharmonic potential surfaces. J. Phys. Chem. 1984;88:4233–4238. [Google Scholar]
- 53.Kidera A., Go N. Refinement of protein dynamic structure: normal mode refinement. Proc. Natl. Acad. Sci. USA. 1990;87:3718–3722. doi: 10.1073/pnas.87.10.3718. [DOI] [PMC free article] [PubMed] [Google Scholar]
- 54.Ichiye T., Karplus M. Collective motions in proteins: a covariance analysis of atomic fluctuations in molecular dynamics and normal mode simulations. Proteins. 1991;11:205–217. doi: 10.1002/prot.340110305. [DOI] [PubMed] [Google Scholar]
- 55.Kitao A., Hirata F., Go N. The effects of solvent on the conformation and the collective motions of protein—normal mode analysis and molecular-dynamics simulations of melittin in water and in vacuum. Chem. Phys. 1991;158:447–472. [Google Scholar]
- 56.García A.E. Large-amplitude nonlinear motions in proteins. Phys. Rev. Lett. 1992;68:2696–2699. doi: 10.1103/PhysRevLett.68.2696. [DOI] [PubMed] [Google Scholar]
- 57.Amadei A., Linssen A.B.M., Berendsen H.J.C. Essential dynamics of proteins. Proteins. 1993;17:412–425. doi: 10.1002/prot.340170408. [DOI] [PubMed] [Google Scholar]
- 58.Brooks B.R., Janezic D., Karplus M. Harmonic-analysis of large systems. 1. Methodology. J. Comput. Chem. 1995;16:1522–1542. [Google Scholar]
- 59.Janezic D., Brooks B.R. Harmonic-analysis of large systems. 2. Comparison of different protein models. J. Comput. Chem. 1995;16:1543–1553. [Google Scholar]
- 60.Janezic D., Venable R.M., Brooks B.R. Harmonic-analysis of large systems. 3. Comparison with molecular-dynamics. J. Comput. Chem. 1995;16:1554–1566. [Google Scholar]
- 61.Hess B., Kutzner C., Lindahl E. GROMACS 4: algorithms for highly efficient, load-balanced, and scalable molecular simulation. J. Chem. Theory Comput. 2008;4:435–447. doi: 10.1021/ct700301q. [DOI] [PubMed] [Google Scholar]
- 62.Duan Y., Wu C., Kollman P. A point-charge force field for molecular mechanics simulations of proteins based on condensed-phase quantum mechanical calculations. J. Comput. Chem. 2003;24:1999–2012. doi: 10.1002/jcc.10349. [DOI] [PubMed] [Google Scholar]
- 63.Jorgensen W.L., Chandrasekhar J., Klein M.L. Comparison of simple potential functions for simulating liquid water. J. Chem. Phys. 1983;79:926–935. [Google Scholar]
- 64.Meagher K.L., Redman L.T., Carlson H.A. Development of polyphosphate parameters for use with the AMBER force field. J. Comput. Chem. 2003;24:1016–1025. doi: 10.1002/jcc.10262. [DOI] [PubMed] [Google Scholar]
- 65.Kobayashi, C. and S. Saito. 2010. TRAJAN: the next generation supercomputer project, grand challenges in next-generation integrated nanoscience. http://pal.ims.ac.jp/trajan/.
- 66.Sydor J.R., Engelhard M., Herrmann C. Transient kinetic studies on the interaction of Ras and the Ras-binding domain of c-Raf-1 reveal rapid equilibration of the complex. Biochemistry. 1998;37:14292–14299. doi: 10.1021/bi980764f. [DOI] [PubMed] [Google Scholar]
- 67.Stieglitz B., Bee C., Herrmann C. Novel type of Ras effector interaction established between tumour suppressor NORE1A and Ras switch II. EMBO J. 2008;27:1995–2005. doi: 10.1038/emboj.2008.125. [DOI] [PMC free article] [PubMed] [Google Scholar]
- 68.Hall B.E., Yang S.S., Bar-Sagi D. Structure-based mutagenesis reveals distinct functions for Ras switch 1 and switch 2 in Sos-catalyzed guanine nucleotide exchange. J. Biol. Chem. 2001;276:27629–27637. doi: 10.1074/jbc.M101727200. [DOI] [PubMed] [Google Scholar]
- 69.Nassar N., Horn G., Wittinghofer A. Ras/Rap effector specificity determined by charge reversal. Nat. Struct. Biol. 1996;3:723–729. doi: 10.1038/nsb0896-723. [DOI] [PubMed] [Google Scholar]
- 70.Huang L., Hofer F., Kim S.H. Structural basis for the interaction of Ras with RalGDS. Nat. Struct. Biol. 1998;5:422–426. doi: 10.1038/nsb0698-422. [DOI] [PubMed] [Google Scholar]
- 71.Pacold M.E., Suire S., Williams R.L. Crystal structure and functional analysis of Ras binding to its effector phosphoinositide 3-kinase γ. Cell. 2000;103:931–943. doi: 10.1016/s0092-8674(00)00196-3. [DOI] [PubMed] [Google Scholar]
- 72.Scheffzek K., Ahmadian M.R., Wittinghofer A. The Ras-RasGAP complex: structural basis for GTPase activation and its loss in oncogenic Ras mutants. Science. 1997;277:333–338. doi: 10.1126/science.277.5324.333. [DOI] [PubMed] [Google Scholar]
- 73.Margarit S.M., Sondermann H., Kuriyan J. Structural evidence for feedback activation by Ras.GTP of the Ras-specific nucleotide exchange factor SOS. Cell. 2003;112:685–695. doi: 10.1016/s0092-8674(03)00149-1. [DOI] [PubMed] [Google Scholar]
- 74.Shima F., Ijiri Y., Kataoka T. Structural basis for conformational dynamics of GTP-bound Ras protein. J. Biol. Chem. 2010;285:22696–22705. doi: 10.1074/jbc.M110.125161. [DOI] [PMC free article] [PubMed] [Google Scholar]
- 75.DeLano,W. L. 2008. The PyMOL molecular graphics system. DeLano Scientific LLC, Palo Alto, CA. http://www.pymol.org.
Associated Data
This section collects any data citations, data availability statements, or supplementary materials included in this article.