

Abstract
We present investigations on volume regulation and beading shape transitions in PC12 neurites, conducted using a flow-chamber technique. By disrupting the cell cytoskeleton with specific drugs, we investigate the role of its individual components in the volume regulation response. We find that microtubule disruption increases both swelling rate and maximum volume attained, but does not affect the ability of the neurite to recover its initial volume. In addition, investigation of axonal beading—also known as pearling instability—provides additional clues on the mechanical state of the neurite. We conclude that volume recovery is driven by passive diffusion of osmolites, and propose that the initial swelling phase is mechanically slowed down by microtubules. Our experiments provide a framework to investigate the role of cytoskeletal mechanics in volume homeostasis.
Introduction
The ability of living cells to regulate their volume is a ubiquitous homeostatic feature in biology (1,2). Because water readily permeates through the cellular membrane, alterations in extracellular osmolarity can change the concentration of all cytoskeletal components with severe consequences for metabolism. Not surprisingly, one finds several mechanisms involved in volume regulation. In particular, many eukaryotic cell types display a short-term volume regulation response to sudden alterations in external osmolarity—the so-called regulatory volume decrease (RVD) and regulatory volume increase (RVI) (2,3). It is generally accepted that these require the passive diffusion of ions and hydrostatic pressure is assumed to be negligible (2–4), with the argument that they would make the membrane burst (1). However, though the maximal pressures sustained by lipid bilayers are very low, the cell membrane is connected to the cytoskeleton, with the biopolymer gel spanning across the cell interior (5–7).
Because the cytoskeleton is viscoelastic and contractile (8–11) (also in PC12 neurites (12)), it may provide a mechanical memory of the initial state as well as a driving force for volume relaxation (13–20). Though it has been argued that the cytoskeleton is too weak—typical shear moduli are up to 10 kPa (8,10)—to sustain osmotic pressures (up to approximately MPa) (7), neurons under hypoosmotic shock sustain strong pressures for several hours (21) and swelling of erythrocytes increases and approach perfect osmometer behavior after disruption of the spectrin-actin cytoskeleton (22). Moreover, the bulk elastic modulus—which is more relevant than the shear modulus upon volume change—is expected to be 1–2 orders-of-magnitude higher (23). In addition, volume changes may also modify cell elasticity, as observed for hyperosmotic shocks (24). Apart from mechanical effects, biochemical interactions between actin filaments and ion channels may couple strain of the actin cortex to changes in channel activity (2,25). The fact that the actin cortex is disrupted when hypoosmotic swelling begins (26,27) seems to be due to an influx of Ca2+ (28) through mechanosensitive ion channels activated by membrane stretching (29,30). Microtubules, too, can play a signaling role, and are known to regulate acto-myosin contractility (31). To clarify the role of the cytoskeleton in volume regulation, one must discern between pure mechanical and mechanosensing responses—a difficult task requiring direct measurements of membrane tension.
In this work, we study volume regulation in PC12 neurites, axonlike cylindrical protrusions extended by PC12 cells (32,33). Their simple cylindrical geometry and low amount of invaginated membrane allows better volume and area calculations from images. They also have a well-defined, highly organized cytoskeletal structure similar to that of axons. It has been shown that PC12 neurites as well as axons are viscoelastic and respond to external stretching forces via a relaxation process with a characteristic timescale (12). Moreover, an exceptional feature of axons and neurites is their ability to undergo sudden shape transformations in response to an applied mechanical tension (20,34,35), an instability known as “axonal beading” to biologists and “pearling instability” to physicists. In what follows, we discuss experiments aimed at investigating the role played by membrane tension and cytoskeleton in shape transformations and volume regulation in neurites exposed to sudden osmotic perturbations. We also introduce a mathematical model combining volume-dependent permeabilities and viscoelastic forces.
Experimental Setup and Methods
Flow chamber
The experiments have been carried out using a flow-chamber technique. A schematic of the setup is shown in Fig. 1. A stainless-steel block and two coverslips are used to form a 10 × 5 × 1 mm chamber. Cells adhere on the bottom coverslip. One duct of the chamber is connected to a peristaltic pump to generate flow rates, in the range of 2–4 μl/s. Switching of media using the valve reaches 90% of its final value in ∼10 s, as verified using an absorbing dye. The chamber, the valve, and the stainless-steel tubes are embedded in an aluminum block with controlled temperature. A constant flow of prewarmed medium is maintained throughout an experiment.
Figure 1.
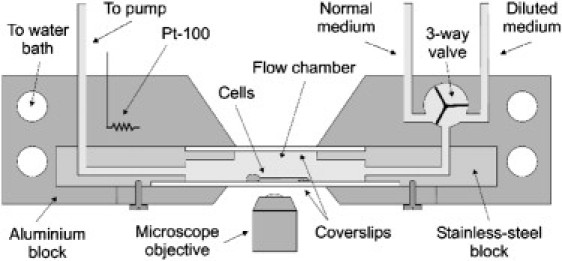
Schematic diagram of the flow-chamber setup.
Cell culture
PC12 cells are from the German Collection of Microorganisms and Cell Lines (36). They are plated on collagen-coated slides and cultured in RPMI-1640 medium (Gibco, Billings, MT) with 10% fetal bovine serum and 5% horse serum in presence of nerve growth factor (Sigma-Aldrich Chemie, Munich, Germany) for 4–5 days (37). Such young neurites are known not to have intermediate filaments (33).
Experimental procedure
Before an experiment, the slide with the adherent cells is transferred to the flow-chamber. Cells are allowed to stabilize for ∼5 min in normal medium with 25 mM HEPES buffer. Experiments are performed by switching from the normal medium to medium diluted with deionized water or vice versa. The cell response is observed with an Axiovert 135 microscope (Carl Zeiss, Jena, Germany) configured for phase-contrast imaging.
Image analysis
The volume and area of the neurites are analyzed from the recordings using a home-developed edge-detection program. Edge-pixels are recognized along the neurite by detecting the local maxima in the gradient of intensity across the neurite. After edge detection, the neurite volume and surface area are computed assuming axial symmetry for the neurite shape. Axial symmetry is verified by comparing the two detected boundaries of several neurites and is found to be a good approximation for straight neurites which are attached only at the two extremities. Only such neurites were selected for the experiments.
Drug-induced cytoskeletal perturbation
A complication in these experiments arises due to the neurites becoming fragile or losing their cylindrical geometry on cytoskeletal perturbation. This precluded experiments with the actin-disrupting drug Latrunculin, which induces detachment of the growth cone. In the case of the microtubule-disrupting drug Nocodazole (NOC) (38), which induces shape irregularities after ∼10 min exposure, we let the drug act for 5 min before performing the hypoosmotic shock. NOC concentration was 10 μg/mL throughout. In contrast, the myosin blocking drug Blebbistatin (39) did not significantly alter neurite shape. Thus, to ensure its effect, we incubated neurites at 37° for 1 h at a high concentration (50 μM) before transferring them to the experiment chamber and performing the experiment at a lower concentration of 20 μM.
Experimental Results
Volume dynamics
We begin all experiments with a hypoosmotic shock imposed by switching from normal medium with a solute concentration C0 = 300 mM to a lower external value Ce (the continuous flow ensures constant external concentration at all times). For an intuitive measure of the shock strength, we will normalize the external osmolarity by its initial value and denote it by C = Ce/C0. Fig. 2 shows typical responses for three different values of C at 36°C. For mild shocks (C = 0.8, C = 0.7), the volume increases at a roughly constant rate initially until it reaches a maximum value Vmax. Subsequently, the volume recovers almost back to V0 with a typical regulatory volume decrease response (RVD). The volume recovery is roughly exponential with a characteristic time τ, which is independent of neurite length. For strong shocks, C = 0.5, the recovery is faster and there is often an undershoot, where the volume goes below its initial value.
Figure 2.
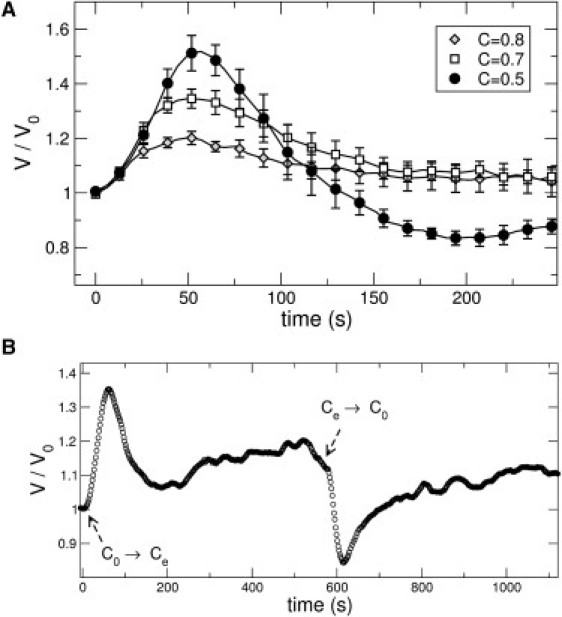
(A) Swelling and recovery after a hypoosmotic shock performed at time t = 0. Normalized volume V/V0 as a function of time at 36°C. Symbols indicate mean values over several experiments and error bars correspond to mean ± SE. The respective dilutions are C = 0.5 (solid circles, n = 6), C = 0.7 (open squares, n = 7), and C = 0.8 (open diamonds, n = 4). (B) The full observed response when the neurite is subjected to a hypoosmotic shock and a subsequent hyperosmotic shock, at times indicated in the figure. Such cycles can be repeated up to five times in a given neurite before the ends detach.
Once the volume stabilizes to the lower external osmolarity Ce (within ∼10 min), we perform a hyperosmotic shock by switching back to normal medium with concentration C0. The neurite shrinks, reaches a minimum volume Vmin, and then comes back to its initial volume in an RVI response as shown in Fig. 2 B.
Nonlinear swelling response
Fig. 3 A shows the initial rate of change of volume divided by the initial area, , as a function of the initial osmotic pressure difference
Assuming zero hydrostatic pressure and neglecting changes in internal osmolarity gives the following expression for the initial swelling rate,
| (1) |
where Lp is the hydraulic permeability. From the average value at C = 0.7, we obtain an osmotic permeability
(where δW is the molar density of water), which is approximately two orders-of-magnitude lower than the literature values for lipidic membranes and most biological cells (1,40–42) even after blockage of water channels (43). Moreover, as can be seen from Fig. 3 A, the expected linear dependence is contradicted by the strong nonlinear response observed for both hypo- and hyperosmotic shocks.
Figure 3.
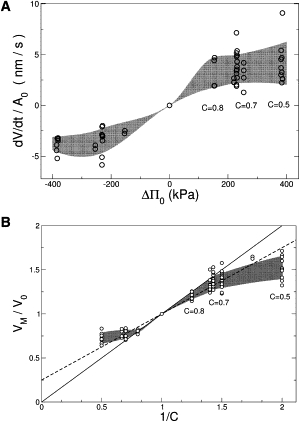
(A) Initial swelling speed as a function of the initial osmotic pressure difference ΔΠ0. (Shaded region) Guide to the eye. Note the nonlinear response to strong hypo- as well as hyperosmotic shocks. (B) Maximum change in relative volume VM/V0 as a function of the inverse external concentration 1/C (here VM stands for Vmax or Vmin, as the case may be). (Shaded region) Guide to the eye. The lines correspond to perfect osmometers with dead volume Vdead = 0.25 V0 (dashed) and Vdead = 0 (solid).
We now turn to the maximum (minimum) volume attained in a hypoosmotic (hyperosmotic) shock. The maximum (minimum) volume Vmax (Vmin) is to a good approximation proportional to the initial volume V0 (data not shown (44)). Thus, we look at the relative maximum volume Vmax/V0 in order to minimize the effect of neurite diameter. As shown in Fig. 3 B, the maximum volume increases nonlinearly with the initial osmotic pressure difference ΔΠ0. The data is contrasted to the perfect osmometer equation, corresponding to a constant total amount of internal osmolites and zero hydrostatic pressure,
| (2) |
where the dead volume Vdead represents nonaqueous internal volume. Mammalian cells have, on the average, a cytosolic protein concentration of ∼20% (5). According to electron microscopy studies (33), the noncytosolic volume of PC12 neurite is comprised mostly of microtubules and organelles and amounts to Vdead = 25% V0. The solid region in Fig. 3 B corresponds to V > V0/C for hypoosmotic shocks and to V < V0/C for hyperosmotic shocks; penetrating this region would require work against the osmotic gradient. For mild shocks, C = 0.7 and (hyperosmotic) C ≤ 1.4, neurites swell as much as perfect osmometers with a dead volume of 25%. Therefore, any ion leakages or hydrostatic pressures are negligible during the swelling phase. However, at strong shocks (hypoosmotic C = 0.5 or hyperosmotic C = 2), neurites swell significantly less than a perfect osmometer would. Thus, upon strong osmotic perturbations either ions leak or a sustained hydrostatic pressure develops.
Volume regulation under cytoskeleton disruption
The axonal cytoskeleton may be expected to contribute to the volume response in several ways. As discussed in the Introduction, a mechanical as well as a signaling role is conceivable. To assess the role of individual components of the cytoskeleton, we treat neurites with the myosin-blocking drug Blebbistatin (BLE) (39) and the microtubule-disrupting drug Nocodazole (NOC) (38). Because these are all diluted in dimethylsulfoxide (DMSO), a compound known to alter ion channels, we also perform control experiments in presence of DMSO. Actin disruption using Latrunculin-A were also attempted. Although low shocks did not show any clear variation from control, higher shocks (C = 0.5) were not possible, because neurites tend to detach easily after treatment.
Fig. 4 A shows mean responses of drug-treated neurites to hypoosmotic shocks. In presence of NOC, the initial swelling rate for strong shocks at C = 0.5 increases markedly, but it barely changes for C = 0.7 (see Fig. 4 B). With BLE, we observe a weaker but still significant effect. For both drugs, the relationship between swelling rate and initial osmotic pressure difference approaches the naively expected linear dependence given by Eq. 1. NOC-induced disruption of microtubules also has a strong effect on the maximum volume Vmax attained for C = 0.5, as shown in Fig. 4 C. Neither BLE-treatment nor DMSO alone has a significant effect on the maximum volume. For mild dilutions, C = 0.7, nocodazole has no effect—consistent with the fact that neurites swell like a perfect osmometer with 25% dead volume. Importantly, the cytoskeleton-disrupting drugs do not affect the ability of the neurite to perform RVD. As can be seen in Fig. 4 A, the volume fully relaxes back to its initial value.
Figure 4.
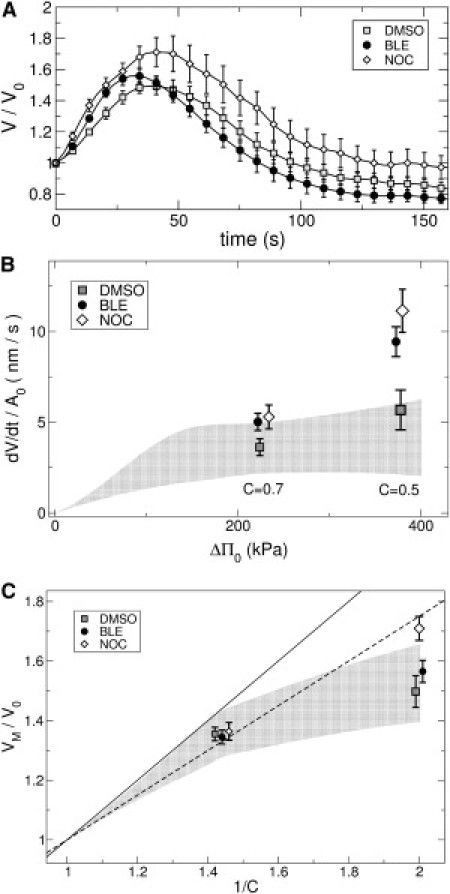
(A) Comparison of different drug treatments. (Symbols) Mean values over several experiments. (Error bars) Mean ± SE. All experiments were performed at temperature T = 33°C and dilution C = 0.5. (Squares) DMSO control (n = 5). (Circles) BLE (n = 7). (Diamonds) NOC (n = 5). (B) Swelling speed as a function of the initial osmotic pressure difference ΔΠ0. (Squares) DMSO control (n = 5 for C = 0.5, n = 14 for C = 0.7). (Circles) Blebbistatin (n = 7, n = 13). (Diamonds) Nocodazole (n = 8, n = 14). (Shaded region) Guide to the eye, corresponding to the experiments without drugs shown in Fig. 3A. Data for all drugs is shown as mean ± SE. (C) Maximum relative volume VM/V0 as a function of the osmotic pressure difference in presence of cytoskeleton-disrupting drugs. (Shaded region) Data without drugs, as in Fig. 3B.
The effect of temperature: Arrhenius behavior
We now address the influence of temperature in the dynamics of volume regulation. For simplicity, we describe the recovery time by fitting single exponentials. As shown in Fig. 5, lowering the temperature from 35 to 15°C slows down the volume dynamics by an order of magnitude. The dashed line is an Arrhenius-like equation
where k depends on temperature as the rate constant of a thermally activated process. This yields an activation energy ΔG ∼ 30 RT, a typical order of magnitude for biological processes (45).
Figure 5.
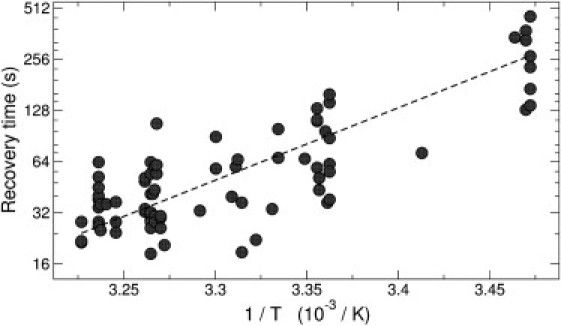
Recovery time as a function of inverse temperature. (Dashed line) Least-squares fit to an Arrhenius form τ ∝ eΔG/RT.
Beading
When PC12 neurites or chick dorsal root ganglia neurons are subjected to strong hypoosmotic shocks, they undergo a shape transformation (20) (see Fig. 6 and Supplementary Movie), resembling beading of nerves subjected to stretch injuries (34,35,46) and traumatic brain injuries (47). The beading dynamics provides important clues regarding volume dynamics. It shows that there is a build-up of membrane tension, which in turn indicates a buildup of Laplace pressure. Moreover, a critical volume increase for the shape instability and its large wavelength (20) tells us that the cytoskeleton must be playing a stabilizing role via its elastic nature. A simple discussion of the beading mechanism is presented as Supporting Material.
Figure 6.
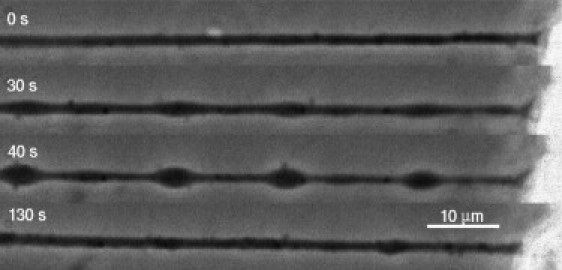
Beading instability induced by a hypoosmotic shock (C = 0.5) (see Supplementary Movie). Bar, 10 μm.
Tension relaxes before volume
It can be seen in Fig. 7 that beading vanishes while RVD is still taking place, suggesting that tension may not be necessary for RVD. To confirm this, we combine the hypoosmotic shock with a hydrodynamic measurement of neurite tension. Under the influence of a flow-induced drag force, the neurite takes the form of a catenary and elongates until it reaches a final equilibrium shape in ∼1 min. The curvature provides a measure of the tension in the axon (48).
Figure 7.
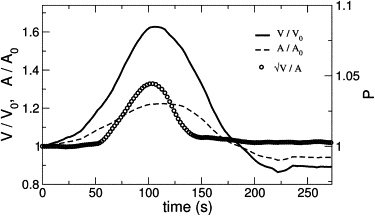
Swelling-induced beading instability. Relative volume V/V0, area A/A0 and shape parameter as a function of time. Hypoosmotic shock strength is C = 0.5. The instability vanishes before the volume recovers, as indicated by the shape parameter curve.
After a hypoosmotic shock, the neurite shortens until it becomes almost straight (see Fig. 8). The beading sets in during this straightening phase and the maximum beading amplitude occurs when the neurite is straight, revealing a buildup of tension during the swelling phase. Subsequently, a relaxation phase sets in where beading and tension decrease. Importantly, curvature (and thus neurite tension) relaxes even faster than the shape parameter (Fig. 8). Because in turn beading vanishes before the volume (Fig. 7), we may conclude that neurite tension is at its rest value during RVD.
Figure 8.
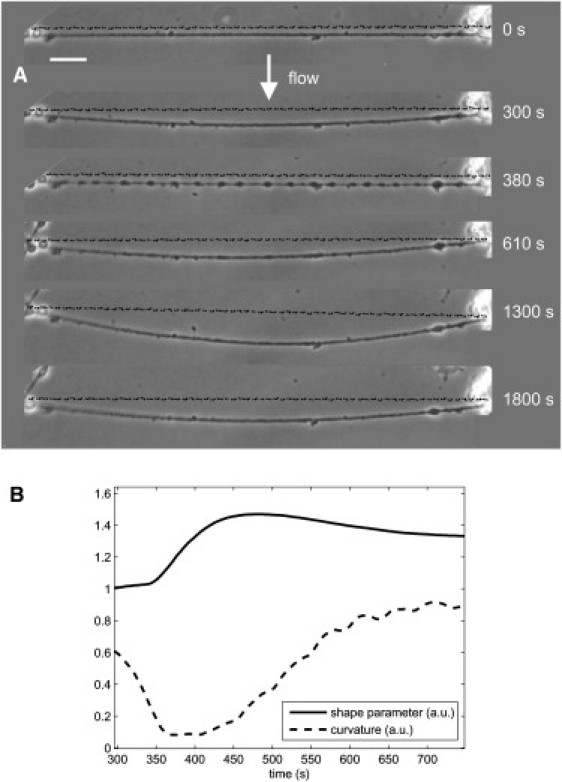
Neurite deformations induced by the combined effect of a hypoosmotic shock and a constant laminar flow (perpendicular to the neurite). (A) The temperature is 25°C and the shock strength is C = 0.7. Laminar flow is started at t = 20 s. After the neurite undergoes viscoelastic relaxation and attains a steady state, a hypoosmotic shock is applied at t = 320 s. As the neurite swells and beads it also straightens, indicating a buildup of longitudinal tension. (Straight, dashed lines) For comparison of curvature. Bar, 10 μm. (B) Measuring shape parameter and curvature as a function of time shows that curvature (and thus tension) relaxes as quickly as beading.
Theory
We model volume regulation in neurites by taking into account both mechanical and osmotic driving forces. For simplicity, we consider only potassium and chloride, the most important osmolites inside the cell. Due to electroneutrality, the flows of Cl− and K+ are coupled as . Our variables are the adimensional quantities
| (3) |
| (4) |
The flow of water through the membrane (1) is given by
| (5) |
where V is the neurite volume, A the neurite area, Lp the hydraulic permeability, Δp the hydrostatic pressure, and the osmotic pressure difference is given by
in terms of external ciex and internal osmolite concentrations ni/V. The typical relaxation time for the volume increase is
where
the osmotic pressure of normal medium. Taking 10−14 m Pa–1 s–1 for the permeability (from Fig. 3 A), we obtain τV = 50 s.
We model ion movement with a passive K+–Cl− cotransport following Hernandez and Cristina (3), neglecting the effect of ion pumps because these are not relevant for the short-term RVD response. Chloride flux is given by the difference in chemical potentials,
| (6) |
We model the RVD response following the standard assumption of a volume-dependent ion channels (2). The permeability G is then zero at the initial volume V0 and nonzero at a significant departure. The existence of these channels and their occurrence in most cell types is a well-established fact, but the mechanism of volume sensing is not yet understood. For the purpose of modeling, we treat these channels as black boxes, which instantaneously respond to cell volume. We write
with a typical order-of-magnitude |G| and an adimensional function g(V). For the chloride relaxation time
we expect a value of 10–100 s, taking typical values for ion conductivities (1). The volume-dependent permeability function g(V) jumps from zero to a finite value at a critical threshold volume; otherwise, its form is not known, and different expressions have been used in the literature (3,17). In our experiments, the critical volume is ∼1.2 V0, as can be seen in Fig. 2. We obtain good results with the simple expression
where θ(…) is the step function.
Finally, assuming external ion concentrations to jump instantaneously at time t = 0 from ciex(0) to Cciex(0), the full system can be written as
| (7) |
| (8) |
with the parameters
We take the following physiological values for the ion concentrations (1):
The adimensional constants then become ϕ = 0.25, β ≃ 0.05, and α ≃ 0.5.
Zero pressure model
The standard assumption in modeling volume regulation is to set the hydrostatic pressure to zero (3), Δp = 0. With this Ansatz we can solve the equations for the volume response V(t). As shown in Fig. 9, the model reproduces the timescales for swelling and recovery as well as the maximum volume. Interestingly it reproduces the undershoot at C = 0.5 (see Fig. 2). This can be understood as follows. Ion concentration differences are such that the cell relaxes toward a volume much smaller than the initial one. As a consequence, when the volume reaches its initial value the osmotic difference is not yet zero. Because the RVD loop closes the ion channel (and not the volume channel), once the initial volume is recovered, water keeps flowing out of the cell until it dissipates the osmotic difference, which results in the undershoot. However, the dependence of the swelling rate on osmotic pressure is clearly off. The model gives a linear response—a feature intrinsic to any volume-dependent permeability—whereas experiments show a nonlinear one (Fig. 3 A).
Figure 9.
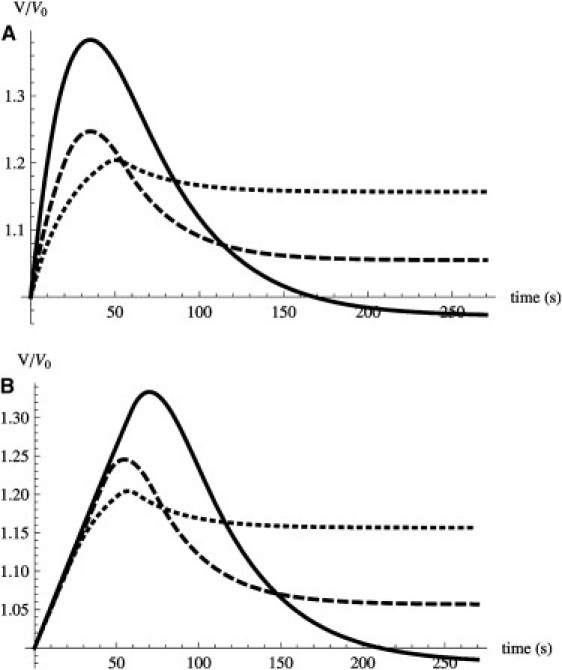
(A) Zero pressure model for external osmolarity C = 0.8 (dotted line), C = 0.7 (dashed line), and C = 0.5 (solid line). (B) Adding nonlinear viscoelasticity as given by Eq. 9 reproduces the trend during the swelling phase. Compare to Figs. 2 and 7.
Viscoelastic model
As shown by our experiments combining hypoosmotic shocks and drag forces (Fig. 8), neurites develop tension while swelling. This suggests that the nonlinear response observed in experiments may come from a nonlinear mechanical response, a ubiquitous feature of cells with structured cytoskeleton (49). We therefore assume that the pressure difference Δp is not zero, but depends on the swelling rate as expected for a viscoelastic element. To reproduce Fig. 3 A, we assume that neurites swell at zero pressure at low rates but develop high pressure at rates faster than a critical value Ω. This can be written as
| (9) |
where Ω is the maximal rate of change of volume at which the neurite can swell without tension, corresponding to ∼5 × 10⁻³ s−1 in our experiments, and η is the stress scale, ∼2 MPa.
As shown in Fig. 9, with this Ansatz the model reproduces the essentially constant swelling rate observed in experiments. The nonlinear mechanical response slows down both swelling and recovery. Interestingly, the peculiar triangular shape of the curves at C=0.5 is much closer to that of experiments (compare to Fig. 2).
Discussion
Initial nonlinear response
The initial response of neurites to hypo- as well as hyperosmotic shocks is a strongly nonlinear function of the external osmotic pressure. Observation of the shape dynamics shows that membrane tension increases markedly at the moment where the nonlinearity arises, hinting at a mechanical phenomenon. Remarkably, after microtubule disruption, neurites behave as perfect-osmometers, and the swelling rate increases linearly with osmotic shock strength. Taking our results together, we propose that microtubules slow down the initial volume change by mechanically opposing the osmotic pressure difference. This is not exactly an elastic response but, rather, a (nonlinear) viscoelastic one, which depends crucially on the swelling rate. The mechanical response of the neurite, as described by Eq. 9, seems to be similar to that of adhering fibroblasts (49,50). At slow strain rates, forces are low; above a critical strain rate, forces sharply increase. From our results, writing the critical rate as a strain, we get
In single fibroblasts, this is indeed the order of magnitude of the critical strain rate where frictional forces increase (49), which in turn agrees with the timescale of active processes (9,11). This suggests that changes in cell shape—including swelling—take place at the rate allowed by spontaneous unbinding of cytoskeletal crosslinks, whereas faster changes are slowed down by friction between cytoskeletal elements. Interestingly, microtubules are largely irrelevant for the mechanical response of round cells (51–53). This is most likely due to the arrangement in interconnected bundles characteristic of neurites, which can increase their stiffness by orders of magnitude.
RVD is driven by ion flow
Our results indicate that mechanical tension is not necessary for volume recovery. The beading modulation vanishes well before the volume recovers, indicating rest membrane tension during RVD. Moreover, in presence of cytoskeleton-perturbing drugs, the volume recovery time τ does not increase, but becomes slightly shorter. This indicates that volume recovery takes place via extrusion of osmolites (3). Indeed, our simple model based on two ionic species suffices to explain the essential features of the volume evolution curves. It captures the broad response and even the tendency to undershoot at large dilutions.
RVD follows an Arrhenius trend as a function of temperature
The timescales involved in the volume responses are temperature-dependent. The recovery time is approximately an order-of-magnitude more temperature-dependent than the initial swelling/shrinking rate, showing an Arrhenius exponential reduction as the temperature is increased.
A dynamic picture of stretch injury
Shape transformations similar to beading have been observed in nerves as a response to stretch injury (34,35). Interestingly, electron microscopy observations of the ultrastructure of stretch-beaded nerves show that microtubules are splayed out in the beads (46), consistent with our picture of a mechanical connection between microtubules and the membrane. The shapes of beaded nerves have been interpreted as equilibrium shapes with a constant curvature (34); however, our results offer an alternative explanation, namely that the shape is dictated by an interplay between hydrodynamics and cytoskeletal viscoelasticity. If so, the shape of beaded nerves would not simply follow from structural properties (as expected for an equilibrium shape), but would also be defined by the precise way stretch-injury takes place, i.e., the rate and extent of loading. Future studies may address this question in detail.
Conclusions
Neurites respond to sudden osmotic pressure changes with a fast volume regulation response. The initial phase is characterized by a nonlinear dependence of swelling rate on the initial osmotic pressure. Cytoskeletal perturbation, especially microtubule disruption, accelerates swelling and increases the maximum volume reached, but does not affect the relaxation phase. Taking our results together, we propose that mechanical forces due to the nonlinear viscosity of the cytoskeleton slow down the initial phase of change of volume.
Acknowledgments
We thank Osvaldo Chara, Pablo Schwarzbaum, Karina Alleva, and Wolfram Hartung for helpful discussions.
Experiments were performed at the Universität Bayreuth, Bayreuth, Germany, with the generous support of Albrecht Ott.
Supporting Material
References
- 1.Weiss T. MIT Press; Cambridge, MA: 1996. Cellular Biophysics. [Google Scholar]
- 2.Lang F., Busch G.L., Häussinger D. Functional significance of cell volume regulatory mechanisms. Physiol. Rev. 1998;78:247–306. doi: 10.1152/physrev.1998.78.1.247. [DOI] [PubMed] [Google Scholar]
- 3.Hernandez J., Cristina E. Modeling cell volume regulation in nonexcitable cells: the roles of the Na+ pump and of cotransport systems. Am. J. Physiol. Cell Physiol. 1998;275:C1067–C1080. doi: 10.1152/ajpcell.1998.275.4.C1067. [DOI] [PubMed] [Google Scholar]
- 4.MacKnight A.D.C. Volume maintenance in isoosmotic conditions. In: Gilles R., Kleinzeller A., Bolis L., editors. Cell Volume Control: Fundamental and Comparative Aspects in Animal Cells. Academic Press; San Diego, CA: 1987. pp. 3–43. [Google Scholar]
- 5.Bray D. 2nd Ed. Garland Publishing; New York: 2001. Cell Movements: From Molecules to Motility. [Google Scholar]
- 6.Alberts B., Bray D., Watson J.D. 3rd Ed. Garland Publishing; New York: 1994. Molecular Biology of the Cell. [Google Scholar]
- 7.Janmey P.A. The cytoskeleton and cell signaling: component localization and mechanical coupling. Physiol. Rev. 1998;78:763–781. doi: 10.1152/physrev.1998.78.3.763. [DOI] [PubMed] [Google Scholar]
- 8.Fabry B., Maksym G.N., Fredberg J.J. Scaling the microrheology of living cells. Phys. Rev. Lett. 2001;87:148102. doi: 10.1103/PhysRevLett.87.148102. [DOI] [PubMed] [Google Scholar]
- 9.Thoumine O., Ott A. Time scale dependent viscoelastic and contractile regimes in fibroblasts probed by microplate manipulation. J. Cell Sci. 1997;110:2109–2116. doi: 10.1242/jcs.110.17.2109. [DOI] [PubMed] [Google Scholar]
- 10.Fernández P., Pullarkat P.A., Ott A. A master relation defines the nonlinear viscoelasticity of single fibroblasts. Biophys. J. 2006;90:3796–3805. doi: 10.1529/biophysj.105.072215. [DOI] [PMC free article] [PubMed] [Google Scholar]
- 11.Pullarkat P.A., Fernández P.A., Ott A. Rheological properties of the Eukaryotic cell cytoskeleton. Phys. Rep. 2007;449:29–53. [Google Scholar]
- 12.Bernal R., Pullarkat P.A., Melo F. Mechanical properties of axons. Phys. Rev. Lett. 2007;99:018301. doi: 10.1103/PhysRevLett.99.018301. [DOI] [PubMed] [Google Scholar]
- 13.Henson J.H. Relationships between the actin cytoskeleton and cell volume regulation. Microsc. Res. Tech. 1999;47:155–162. doi: 10.1002/(SICI)1097-0029(19991015)47:2<155::AID-JEMT7>3.0.CO;2-T. [DOI] [PubMed] [Google Scholar]
- 14.Kleinzeller A. The volume regulation in some animal cells. Arch. Biol. (Liege) 1965;76:217–232. [PubMed] [Google Scholar]
- 15.Cantiello H.F. Role of actin filament organization in cell volume and ion channel regulation. J. Exp. Zool. 1997;279:425–435. doi: 10.1002/(sici)1097-010x(19971201)279:5<425::aid-jez4>3.0.co;2-q. [DOI] [PubMed] [Google Scholar]
- 16.Mills J. The cell cytoskeleton: possible role in volume control. In: R. Gilles, A. Kleinzeller, L. Bolis, editors. Cell Volume Control: Fundamental and Comparative Aspects in Animal Cells. Academic Press; San Diego, CA: 1987. pp. 75–101. [Google Scholar]
- 17.Strieter J., Stephenson J.L., Weinstein A.M. Volume-activated chloride permeability can mediate cell volume regulation in a mathematical model of a tight epithelium. J. Gen. Physiol. 1990;96:319–344. doi: 10.1085/jgp.96.2.319. [DOI] [PMC free article] [PubMed] [Google Scholar]
- 18.Strange K. Cellular volume homeostasis. Adv. Physiol. Educ. 2004;28:155–159. doi: 10.1152/advan.00034.2004. [DOI] [PubMed] [Google Scholar]
- 19.Downey G.P., Grinstein S., Chan C.K. Volume regulation in leukocytes: requirement for an intact cytoskeleton. J. Cell. Physiol. 1995;163:96–104. doi: 10.1002/jcp.1041630111. [DOI] [PubMed] [Google Scholar]
- 20.Pullarkat P.A., Dommersnes P., Ott A. Osmotically driven shape transformations in axons. Phys. Rev. Lett. 2006;96:048104. doi: 10.1103/PhysRevLett.96.048104. [DOI] [PubMed] [Google Scholar]
- 21.Wan X., Harris J.A., Morris C.E. Responses of neurons to extreme osmomechanical stress. J. Membr. Biol. 1995;145:21–31. doi: 10.1007/BF00233304. [DOI] [PubMed] [Google Scholar]
- 22.Heubusch P., Jung C.Y., Green F.A. The osmotic response of human erythrocytes and the membrane cytoskeleton. J. Cell. Physiol. 1985;122:266–272. doi: 10.1002/jcp.1041220216. [DOI] [PubMed] [Google Scholar]
- 23.Mahaffy R.E., Park S., Shih C.K. Quantitative analysis of the viscoelastic properties of thin regions of fibroblasts using atomic force microscopy. Biophys. J. 2004;86:1777–1793. doi: 10.1016/S0006-3495(04)74245-9. [DOI] [PMC free article] [PubMed] [Google Scholar]
- 24.Zhou E.H., Trepat X., Fredberg J.J. Universal behavior of the osmotically compressed cell and its analogy to the colloidal glass transition. Proc. Natl. Acad. Sci. USA. 2009;106:10632–10637. doi: 10.1073/pnas.0901462106. [DOI] [PMC free article] [PubMed] [Google Scholar]
- 25.Suchyna T.M., Besch S.R., Sachs F. Dynamic regulation of mechanosensitive channels: capacitance used to monitor patch tension in real time. Phys. Biol. 2004;1:1–18. doi: 10.1088/1478-3967/1/1/001. [DOI] [PubMed] [Google Scholar]
- 26.D'Alessandro M., Russell D., Lane E.B. Keratin mutations of epidermolysis bullosa simplex alter the kinetics of stress response to osmotic shock. J. Cell Sci. 2002;115:4341–4351. doi: 10.1242/jcs.00120. [DOI] [PubMed] [Google Scholar]
- 27.Cornet M., Delpire E., Gilles R. Relations between cell volume control, microfilaments and microtubules networks in T2 and PC12 cultured cells. J. Physiol. (Paris) 1988;83:43–49. [PubMed] [Google Scholar]
- 28.Light D.B., Attwood A.J., Baumann N.L. Cell swelling increases intracellular calcium in Necturus erythrocytes. J. Cell Sci. 2003;116:101–109. doi: 10.1242/jcs.00202. [DOI] [PubMed] [Google Scholar]
- 29.Arora P.D., Bibby K.J., McCulloch C.A. Slow oscillations of free intracellular calcium ion concentration in human fibroblasts responding to mechanical stretch. J. Cell. Physiol. 1994;161:187–200. doi: 10.1002/jcp.1041610202. [DOI] [PubMed] [Google Scholar]
- 30.Guilak F., Zell R.A., Donahue H.J. Mechanically induced calcium waves in articular chondrocytes are inhibited by gadolinium and amiloride. J. Orthop. Res. 1999;17:421–429. doi: 10.1002/jor.1100170319. [DOI] [PubMed] [Google Scholar]
- 31.Kolodney M.S., Elson E.L. Contraction due to microtubule disruption is associated with increased phosphorylation of myosin regulatory light chain. Proc. Natl. Acad. Sci. USA. 1995;92:10252–10256. doi: 10.1073/pnas.92.22.10252. [DOI] [PMC free article] [PubMed] [Google Scholar]
- 32.Greene L.A., Tischler A.S. Establishment of a noradrenergic clonal line of rat adrenal pheochromocytoma cells which respond to nerve growth factor. Proc. Natl. Acad. Sci. USA. 1976;73:2424–2428. doi: 10.1073/pnas.73.7.2424. [DOI] [PMC free article] [PubMed] [Google Scholar]
- 33.Jacobs J.R., Stevens J.K. Changes in the organization of the neuritic cytoskeleton during nerve growth factor-activated differentiation of PC12 cells: a serial electron microscopic study of the development and control of neurite shape. J. Cell Biol. 1986;103:895–906. doi: 10.1083/jcb.103.3.895. [DOI] [PMC free article] [PubMed] [Google Scholar]
- 34.Markin V.S., Tanelian D.L., Ochs S. Biomechanics of stretch-induced beading. Biophys. J. 1999;76:2852–2860. doi: 10.1016/S0006-3495(99)77439-4. [DOI] [PMC free article] [PubMed] [Google Scholar]
- 35.Ochs S., Pourmand R., Jersild R.A., Jr. Origin of beading constrictions at the axolemma: presence in unmyelinated axons and after β,β′-iminodipropionitrile degradation of the cytoskeleton. Neuroscience. 1996;70:1081–1096. doi: 10.1016/0306-4522(95)00390-8. [DOI] [PubMed] [Google Scholar]
- 36.Drexler H.G., Dirks W., Uphoff C.C. 8th Ed. Braunschweig; Germany: 2001. DSMZ Catalogue of Human and Animal Cell Lines. [Google Scholar]
- 37.Greene L., Sobeih M., Teng K. Methodologies for the culture and experimental use of the PC12 rat pheochromocytoma cell line. In: Banker G., Goslin K., editors. Culturing Nerve Cells. MIT Press; Cambridge, MA: 1991. pp. 207–226. [Google Scholar]
- 38.De Brabander M.J., Van de Veire R.M., Janssen P.A. The effects of methyl (5-(2-thienylcarbonyl)-1H-benzimidazol-2-yl) carbamate, (R 17934; NSC 238159), a new synthetic antitumoral drug interfering with microtubules, on mammalian cells cultured in vitro. Cancer Res. 1976;36:905–916. [PubMed] [Google Scholar]
- 39.Straight A.F., Cheung A., Mitchison T.J. Dissecting temporal and spatial control of cytokinesis with a myosin II Inhibitor. Science. 2003;299:1743–1747. doi: 10.1126/science.1081412. [DOI] [PubMed] [Google Scholar]
- 40.Maric K., Wiesner B., Rosenthal W. Cell volume kinetics of adherent epithelial cells measured by laser scanning reflection microscopy: determination of water permeability changes of renal principal cells. Biophys. J. 2001;80:1783–1790. doi: 10.1016/S0006-3495(01)76148-6. [DOI] [PMC free article] [PubMed] [Google Scholar]
- 41.Huster D., Jin A.J., Gawrisch K. Water permeability of polyunsaturated lipid membranes measured by 17° NMR. Biophys. J. 1997;73:855–864. doi: 10.1016/S0006-3495(97)78118-9. [DOI] [PMC free article] [PubMed] [Google Scholar]
- 42.Lúcio A.D., Santos R.A., Mesquita O.N. Measurements and modeling of water transport and osmoregulation in a single kidney cell using optical tweezers and videomicroscopy. Phys. Rev. E. 2003;68:041906. doi: 10.1103/PhysRevE.68.041906. [DOI] [PubMed] [Google Scholar]
- 43.van Hoek A.N., de Jong M.D., van Os C.H. Effects of dimethylsulfoxide and mercurial sulfhydryl reagents on water and solute permeability of rat kidney brush border membranes. Biochim. Biophys. Acta. 1990;1030:203–210. doi: 10.1016/0005-2736(90)90296-z. [DOI] [PubMed] [Google Scholar]
- 44.Fernández, P. 2006. Mechanics of living cells: nonlinear viscoelasticity of single fibroblasts and shape instabilities in axons. PhD thesis. Universität Bayreuth, Bayreuth, Germany.
- 45.Blumenfeld L.A., Tikhonov A.N. Springer; Berlin: 1994. Biophysical Thermodynamics of Intracellular Processes: Molecular Machines of the Living Cell. [Google Scholar]
- 46.Ochs S., Jersild R.A., Jr., Potter C.G. The beaded form of myelinated nerve fibers. Neuroscience. 1994;61:361–372. doi: 10.1016/0306-4522(94)90237-2. [DOI] [PubMed] [Google Scholar]
- 47.Kilinc D., Gallo G., Barbee K.A. Mechanically-induced membrane poration causes axonal beading and localized cytoskeletal damage. Exp. Neurol. 2008;212:422–430. doi: 10.1016/j.expneurol.2008.04.025. [DOI] [PubMed] [Google Scholar]
- 48.Bernal R., Melo F., Pullarkat P.A. Drag force as a tool to test the active mechanical response of PC12 neurites. Biophys. J. 2009;98:515–523. doi: 10.1016/j.bpj.2009.10.024. [DOI] [PMC free article] [PubMed] [Google Scholar]
- 49.Fernández P., Ott A. Single cell mechanics: stress stiffening and kinematic hardening. Phys. Rev. Lett. 2008;100:238102. doi: 10.1103/PhysRevLett.100.238102. [DOI] [PubMed] [Google Scholar]
- 50.Fernández P., Heymann L., Pullarkat P.A. Shear rheology of a cell monolayer. N. J. Phys. 2007;9:419. [Google Scholar]
- 51.Rotsch C., Radmacher M. Drug-induced changes of cytoskeletal structure and mechanics in fibroblasts: an atomic force microscopy study. Biophys. J. 2000;78:520–535. doi: 10.1016/S0006-3495(00)76614-8. [DOI] [PMC free article] [PubMed] [Google Scholar]
- 52.Stamenović D., Mijailovich S.M., Wang N. Cell prestress. II. Contribution of microtubules. Am. J. Physiol. Cell Physiol. 2002;282:C617–C624. doi: 10.1152/ajpcell.00271.2001. [DOI] [PubMed] [Google Scholar]
- 53.Haga H., Sasaki S., Sambongi T. Elasticity mapping of living fibroblasts by AFM and immunofluorescence observation of the cytoskeleton. Ultramicroscopy. 2000;82:253–258. doi: 10.1016/s0304-3991(99)00157-6. [DOI] [PubMed] [Google Scholar]
Associated Data
This section collects any data citations, data availability statements, or supplementary materials included in this article.