

Abstract
Fat pads dynamically regulate energy storage capacity under energy excess and deficit. This remodeling process is not completely understood, with controversies regarding differences between fat depots and plasticity of adipose cell number. We examined changes of mouse adipose cell-size distributions in epididymal, inguinal, retroperitoneal, and mesenteric fat under both weight gain and loss. With mathematical modeling, we specifically analyzed the recruitment, growth/shrinkage, and loss of adipose cells, including the size dependence of these processes. We found a qualitatively universal adipose tissue remodeling process in all four fat depots: 1), There is continuous recruitment of new cells under weight gain; 2), the growth and shrinkage of larger cells (diameter >50 μm) is proportional to cell surface area; and 3), cell loss occurs under prolonged weight gain, with larger cells more susceptible. The mathematical model gives a predictive integrative picture of adipose tissue remodeling in obesity.
Introduction
Fat mass change results from an energy imbalance between food intake and energy expenditure. Adipose tissue plays the critical role of buffering most of the excess or deficit of energy. However, we still lack a comprehensive understanding about changes of adipose tissues under various conditions such as diet, exercise, and aging (1). The role of plasticity of adipose cell number has been emphasized as a response to energy availability (2), whereas other studies have suggested that the adipose cell number is fixed after a growth period (3,4). Together with cell recruitment, another factor in cell number change is cell loss. In prolonged obesity, hypoxia in adipose tissues induces macrophage infiltration and finally cell death (5). Under weight loss, on the other hand, cell death has been proposed to reduce energy storage capacity, together with shrinking cell-size due to net lipolysis (6,7). If cell death can occur under these different conditions, it is of particular interest to ascertain the cell-size dependence of cell death. In addition to the number plasticity of adipose cells, recent studies have further emphasized the structural and functional differences of the visceral and subcutaneous fat depots (8–10). Fat depot-related differences in gene expression have also been reported (11–14).
Fat mass gain and loss require a remodeling of adipose tissue. The cellular scale processes underlying this remodeling cannot be ascertained from macroscopic measurements such as body weight and fat mass. Microscopic details in adipose tissue remodeling have been examined by estimating mean cell-size and total cell number. These measurements cannot precisely address the relative contribution of hypertrophy (cell-size increase) and hyperplasia (cell number increase), and the plasticity of adipose cell number in adults, because mean cell-size may not be an accurate representation of the state of adipose tissue inasmuch as adipose cell-size distributions are not unimodal (15–17). Furthermore, total cell number is estimated as fat mass divided by the average mass of single adipose cells. An estimate of average cell mass is readily obtained from microscopic cell size distributions. An inaccurate average cell mass can lead to a large error in the estimate of total cell number. In addition to these limitations, intrinsic variations between individuals make it difficult to understand the response of adipose tissues to various conditions. Our recent study combining precise adipose cell-size measurement with mathematical modeling has suggested a new method to examine adipose tissue growth (18). Our analysis quantitatively elucidated the contributions of cell recruitment, growth/shrinkage, and loss, to observed changes of cell-size distributions. Each contribution corresponds to biological processes such as differentiation of adipose precursor cells, lipogenesis, and lipolysis in mature adipose cells, and cell death in adipose tissue remodeling under weight gain or loss.
In this study, we examine changes of mouse adipose cell-size distributions in intraabdominal epididymal, retroperitoneal, and mesenteric fat as well as subcutaneous inguinal fat under a diet change that leads to weight loss, as well as one that leads to weight gain. This is the first, to our knowledge, comprehensive set of measurements of adipose cell-size distributions from multiple fat depots during conditions of both weight gain and loss. We found no fundamental qualitative differences between fat depots in their response to diet changes. Recruitment of new cells and the size-dependence of growth/shrinkage rates are qualitatively the same in different fat depots. Furthermore, we found size-dependent cell loss under a prolonged high-fat diet and under a diet switch from a high-fat to normal diet in all fat depots.
Methods
Experiment
As previously described in Guo et al. (19), seventy-one C57BL/6 mice (male, three months old, and weight 26 ± 1 g) were obtained from The Jackson Laboratory (Bar Harbor, ME) and housed individually on a controlled 12-h light/dark cycle with 21–22°C temperature. All mice were fed an ad libitum standard regular NIH-07 diet (Zeigler Brothers, Gardners, PA), containing 3.79 kcal/g (12% calories from fat, 64% from carbohydrates, and 24% from protein) for two weeks as an adaptation period.
Six mice were euthanized to collect fat pads for baseline measurements. The remaining mice were then randomly assigned to three weight-matched groups:
-
1.
Normal diet group (n = 18) continued on the regular diet.
-
2.
High-fat diet group (n = 24) were fed a high-fat diet, F3282 (Bio-Serv, Frenchtown, NJ), containing 5.45 kcal/g (59% fat, 27% carbohydrate, and 14% protein).
-
3.
Ensure diet group (n = 24) were fed the high-fat diet plus liquid Ensure (Abbott Laboratories, Kent, UK), which had an energy density of 1.06 kcal/ml (22% fat, 64% carbohydrate, and 14% protein).
One mouse in the Ensure diet group died during the experiment. Each group was fed with the corresponding diet for seven weeks. Then, six mice from each group were euthanized to collect fat pads. The remaining animals progressed with the assigned diets through an additional 12 weeks. Here six mice in the high-fat diet group and six mice in the Ensure diet group were switched to the regular diet to examine weight loss effect on fat tissue. After 19 weeks, we euthanized all animals and collected fat pads. All animals received free access to water and food throughout the study. All procedures were approved by the National Institute of Diabetes and Digestive and Kidney Diseases' Animal Care and Use Committee.
Mathematical model
The physical status of a fat pad can be described by the size distribution n(s,t) of adipose cells within the fat pad at a given time t. Here, the size s stands for cell diameter. We developed a mathematical model that can describe the change of adipose cell-size distributions under normal and high-fat diets (18). In particular, the model can describe how many new cells are recruited; how cells grow/shrink depending on their size; and how cells fluctuate their size due to lipid turnover. Here we add one additional term: how cells are removed by cell death depending on their size.
Weight gain
The dynamics of mature adipose cells can be described by a partial differential equation:
| (1) |
First, the recruitment of new cells occurs from differentiation of precursor cells with a constant birth rate b. The postulate of constant fat-cell maturation is enough to describe changes in adipose cell-size distributions because the change in the birth rate is negligible for the time period of this study (18). Note that we assume that newly matured fat cells appear only at a minimal cell size s0 of mature cells because precursor cells are smaller than mature fat cells accumulating lipids (20). This is mathematically described by a Kronecker delta function δ(s − s0).
Second, adipose cells grow via lipogenesis, which may depend on cell-size. After maturation of adipose cells to a specific size, they may be capable of fat accumulation. This assumption is necessary to explain bimodal adipose cell-size distributions (18). The peak at small cell size results from an accumulation of small adipose cells that are not fully mature and therefore unable to increase their size by lipid absorption. In addition to this limiting growth rate of small adipose cells, there may be also an upper growth limit because large adipose cells cannot grow indefinitely. The rise and fall of cell-growth rate depending on cell-size can be described with the general functional form of a product of two sigmoidal functions,
| (2) |
where vm represents the maximal growth rate; sl and su are the lower and upper critical sizes, respectively, which give the half-maximal growth rate; and ηl and ηu give their steepness. Note that we introduced another dimensionless parameter Δ to consider basal growth rate of large adipose cells, which is different from our previous model using a fixed Δ = 1 in Jo et al. (18).
Third, size fluctuation of adipose cells by lipid turnover is considered. For simplicity, the corresponding parameter D is assumed as constant. Finally, to allow for a decrease in total cell number under prolonged high-fat diet, we introduce cell death depending on cell-size. Cell death is not necessary to explain adipose tissue remodeling under a short-term high-fat diet in which total cell number does not decrease (18). This term only switches on when (volume-weighted) average cell-size exceeds a certain critical size as described by the Heaviside step function . Under high-fat diet, it has been reported that larger adipose cells are more susceptible to cell death (21,22). Therefore, we represent the size-dependent death rate as the following sigmoidal function,
| (3) |
where km is the maximal death rate; sk is the characteristic size giving half-maximal death rate; and ηk is the steepness of size dependence. As an alternative model, we also consider a size-independent death rate k(s)=km.
Weight loss
In contrast to weight gain, additional fat-storing capacity is not required under the condition of weight loss; thus, there is no requirement for recruitment of new cells. Rather, net lipolysis occurs and adipose cells shrink their size. In addition, we assumed that cell death of enlarged adipose cells become negligible under this shrinkage of cells. However, cell-size fluctuation by lipid turnover may still remain. Summarizing all these changes, the model under weight loss is
| (4) |
Note that the sign in front of v(s) is the opposite of the sign in Eq. 1 to model shrinkage by lipolysis instead of growth by lipogenesis.
To explain the decrease of total cell number specifically at small adipose cells under weight loss, cell death of small adipose cells with a simpler size-dependent shrinkage rate gives another possibility as an alternative model:
| (5) |
For the size dependence of cell shrinkage, we assume that large cells shrink faster than small cells,
| (6) |
where again vm is the maximal shrinkage rate; sv is the characteristic size giving half-maximal shrinkage rate; and ηv is the steepness of the size dependence. In addition, we assume that cell death starts to occur immediately after diet switch to decrease fat-storing capacity. Therefore, a Heaviside function is not included here, differently from the conditional cell death in Eq. 1 under prolonged weight gain. The preferential cell death of small cells is described by a sigmoidal function,
| (7) |
where km is the maximal death rate; sk is the characteristic size giving half-maximal death rate; and ηk is the steepness of size dependence. Note the distinction between size-dependent cell death in Eqs. 3 and 7: greater susceptibility of cell death of larger cells under prolonged weight gain versus greater susceptibility of cell death of smaller cells under weight loss.
Simulation
For a given set of model parameters, the model describes the evolution of adipose cell-size distribution from an initial distribution n(s, t0) at time t0 to a final distribution n(s,tf) at time tf. We could measure only the final cell-size distribution after tissue dissection of a mouse. To obtain absolute frequencies from relative cell-size frequencies measured by our method (see the Supporting Material), we calibrated them using fat pad mass. This calibration is straightforward for the final cell-size distribution because we measured fat pad mass and corresponding relative cell-size frequencies after tissue dissection. However, we need to estimate initial fat-pad mass and initial relative cell-size frequencies of the mouse killed at the final time point.
First, initial fat-pad mass could be estimated from initial body fat mass measured noninvasively every week using the linear relationship between fat-pad mass and body fat mass (see Fig. S1 in the Supporting Material).
Second, the initial relative cell-size frequencies were guessed from the relative cell-size frequencies of other mice (n = 6) killed at the initial time point. We used all six initial relative cell-size frequencies; they looked similar as shown with their average and standard error in Fig. S2. Then, as an initial distribution, we selected the one that evolved to a final distribution that most closely matched the measured final distribution; this was judged by Bayesian model comparison (described in the Supporting Material) between the six initial distributions.
Data analysis
We presented data as mean ± SE, except where otherwise specified. For statistical comparison, we used nonpaired and paired two-tailed Student's t -test for all results given with P-values.
Results
Growth and shrinkage of adipose tissues under weight gain and loss
C57BL/6 mice were fed a normal chow or high-fat diet for an initial seven-week period, as previously described in Guo et al. (19). To examine the effect of weight gain and loss on adipose tissues, two diet strategies for the following 12 weeks were used: continued high-fat diet and switch to normal diet. The continued high-fat diet increased body fat mass, although the rate of increase was attenuated (Fig. 1 A), whereas the switch to normal diet decreased body fat mass (Fig. 1 B). In addition, we observed corresponding mass changes of four fat depots: epididymal, inguinal, retroperitoneal, and mesenteric fat (Fig. 1 C). Most fat depots showed consistent changes with body fat mass under weight gain and loss. One exception was the decrease of epididymal fat mass from week 7 to 19 despite the continuous high-fat diet, which has also been observed in another study (23).
Figure 1.
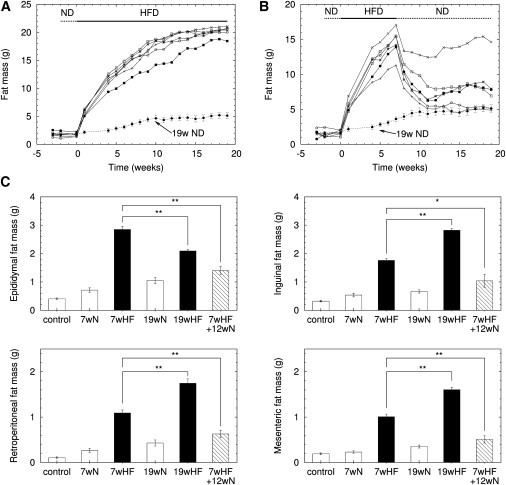
Mass changes of body fat and fat depots under weight gain and loss. After two-week adaptation with normal diet, (A) six mice were fed with a high-fat diet for 19 weeks, and (B) six mice were fed a high-fat diet for the first seven weeks followed by a normal diet during the last 12 weeks. Each symbol represents an individual mouse. The dotted line gives the body fat mass change under 19-week normal diet (n = 6). (C) Fat pad mass changes (n = 6) in epididymal, inguinal, retroperitoneal, and mesenteric fat under given diet: fat pad mass of initial three-month-old, male, C57BL/6 mice (control), after 7-week normal diet (7wN), 7-week high-fat diet (7wHF), 19-week normal diet (19wN), 19-week high-fat diet (19wHF), 7-week high-fat diet plus 12-week normal diet (7wHF+12wN). ∗P < 0.05 and ∗∗P < 0.01.
Changes of adipose cell-size distributions under weight gain and loss
To explore tissue-mass changes in terms of adipose cell-size change and/or cell-number change, we measured sizes of adipose cells (diameter > 25 μm) and obtained their cell-size probability distributions in each fat depot at week 7 and week 19 (Fig. S2, A and B). Based on the cell-size distributions, we calculated the volume-weighted mean cell-size (hypertrophy index), and estimated the total cell number (hyperplasia index) using the mass of the dissected fat pads (Fig. S2 C). Note that we used the volume-weighted mean size rather than the usual number-weighted mean size as the essential adipose tissue function of fat storage is proportional to cell volume. This representation showed that epididymal fat initially has larger adipose cells than inguinal fat (75 ± 4 vs. 59 ± 10 μm, P = 0.003), whereas the inguinal fat has more adipose cells than epididymal fat (7.8 ± 2.9 vs. 4.1 ± 1.0 × 10⁶ cells, P = 0.014).
During the initial seven-week high-fat diet, both adipose cell-size and cell number increased in every fat depot (Table 1). Mean cell-size continued to increase during the additional 12-week high-fat diet. Surprisingly, however, total cell number decreased during the prolonged high-fat diet in all fat depots (Table 1). Therefore, although every fat depot showed similar behaviors of increasing cell-size and decreasing cell number under the prolonged high-fat diet, the relative balance between hypertrophy and hyperplasia determined the phenotype of tissue mass. Compared with the other fat depots, a smaller increase of cell-size and a larger decrease of cell number resulted in the peculiar decrease of epididymal fat mass even under continued high-fat diet. On the other hand, under the weight loss conditions with the diet switch from high-fat to normal, mean cell-size did not change much during the 12-week normal diet, whereas total cell number decreased in all four fat depots (Table 1).
Table 1.
Volume-weighted mean cell-size and total adipose cell number of four fat depots
| Mean cell-size (μm) |
Total cell number (× 106) |
|||||||
|---|---|---|---|---|---|---|---|---|
| Control | 7wHF | 19wHF | 7wHF+12wN | Control | 7wHF | 19wHF | 7wHF+12wN | |
| Epi. | 75 ± 4 | 113 ± 3∗ | 135 ± 5† | 107 ± 10 | 4.1 ± 1.0 | 13.6 ± 1.0∗ | 5.0 ± 0.9† | 4.2 ± 0.6‡ |
| Ing. | 59 ± 10 | 81 ± 13∗ | 118 ± 6† | 79 ± 14 | 7.8 ± 2.9 | 18.0 ± 5.2∗ | 9.1 ± 2.6† | 8.9 ± 2.5‡ |
| Ret. | 74 ± 5 | 111 ± 10∗ | 127 ± 9 | 109 ± 8 | 1.2 ± 0.4 | 6.0 ± 2.3∗ | 5.6 ± 1.7 | 2.0 ± 0.4‡ |
| Mes. | 61 ± 10 | 92 ± 14∗ | 123 ± 14† | 84 ± 12 | 4.6 ± 1.7 | 7.8 ± 1.9 | 5.6 ± 3.3 | 3.1 ± 0.7‡ |
Volume-weighted mean cell-size and total cell number (diameter > 25μm) are calculated from adipose cell-size distributions of epididymal (Epi.), inguinal (Ing.), retroperitoneal (Ret.), and mesenteric (Mes.) fat in control (3 months old, male, C57BL/6 mice) and after 7-week high-fat diet (7wHF), 19-week high-fat diet (19wHF), and 7-week high-fat diet plus 12-week normal diet (7wHF+12wN). Six mice were used for each protocol. Mean ± SD. Student's t -test was done for the comparison between control vs. 7wHF (∗), 7wHF vs. 19wHF (†), and 7wHF vs. 7wHF+12wN (‡) with P < 0.01.
Dynamics of adipose tissue growth under short-term high-fat diet
The cross-sectional snapshots of adipose cell-size distributions resulted from dynamical processes such as recruitment of new cells, and growth and death of existing cells. When fat storage capacity increases to store excess energy, adipose precursor cells mature, and mature adipose cells grow and store the excess energy as schematically illustrated in Fig. 2. On the other hand, adipose cells shrink to release fat during periods of energy scarcity. The growth and shrinkage rates of adipose cells, in general, may depend on cell-size (18). Given initial and final cell-size distributions after seven weeks of high-fat diet, we applied the mathematical model to infer size-dependent adipose cell growth rates that can explain the changes of cell-size distributions (Fig. 3, A and B). Large adipose cells grow faster; for a given time interval, the diameter change of larger adipose cells was bigger than that of smaller adipose cells. However, above a certain critical size, the growth rate attenuated and finally became constant, suggesting that medium-sized adipose cells show the greatest ability to increase their size. The growth rate of large adipose cells (diameter > 50 μm) increased under high-fat diet, compared with normal diet (Fig. 3, A and B: 6 ± 1 vs. 3 ± 1 μm/week (P = 0.005) for epididymal fat, and 4 ± 2 vs. 2 ± 1 μm/week (P = 0.078) for inguinal fat). In addition, the recruitment rate of new adipose cells also increased (Table S1, A and B in the Supporting Material; from 6.6 ± 4.1 to 13.1 ± 2.4 × 10⁵ cells/week (P = 0.007) for epididymal fat, and from 4.5 ± 3.0 to 17.5 ± 8.3 × 10⁵ cells/week (P = 0.005) for inguinal fat).
Figure 2.
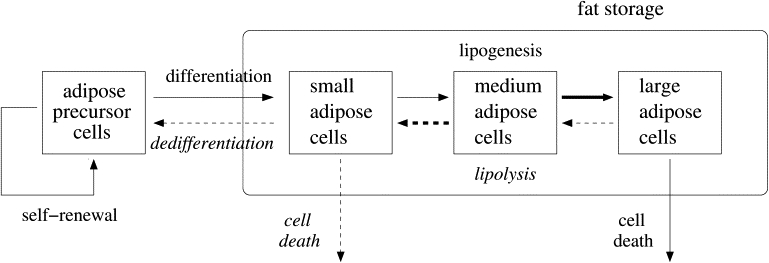
Schematic diagram of adipose tissue remodeling under weight gain (solid lines) and loss (dashed lines and italic fonts). Under energy excess, fat storage capacity increases by recruitment of new adipose cells from differentiation of self-renewing precursor cells, and by enlargement of mature adipose cells through lipogenesis. Prolonged energy excess may induce failure of the energy storage capacity by cell death. On the other hand, under energy deficit, the energy storage shrinks to release fat and adipose cells get smaller through lipolysis. Ultimately, the shrunken cells may exist as precursor cells after dedifferentiation, or they may be actively removed by cell death to reduce the unnecessary energy store capacity under weight loss conditions. The mathematical model considers these possibilities, and size dependences (arrow thickness) of cell growth/shrinkage and death. Although the schematic diagram shows three size categories such as small, medium, and large cells, the model treats cell-size as a continuous variable.
Figure 3.
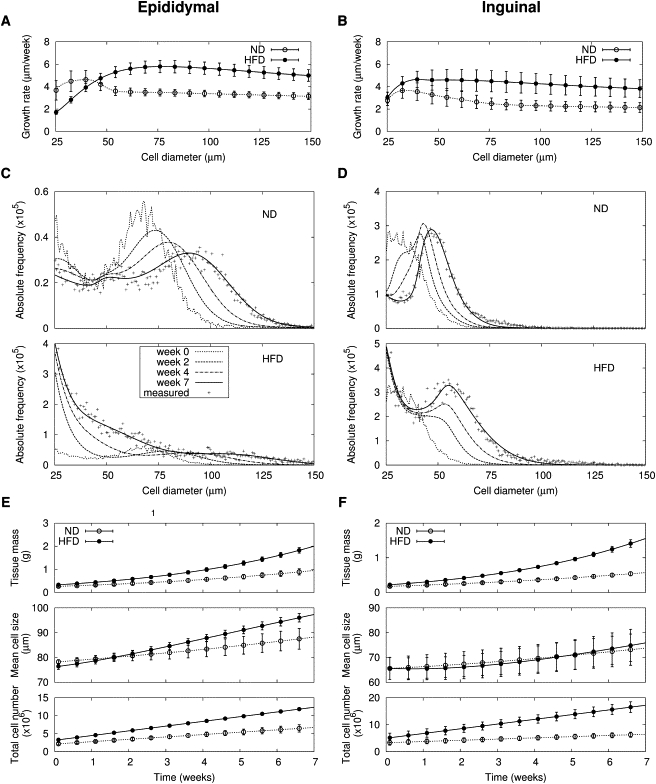
Adipose tissue growth under seven-week normal and high-fat diets. Size-dependent growth rates of adipose cells are deduced from changes of cell-size distributions in (A) epididymal and (B) inguinal fat under normal (ND) and high-fat diets (HFD). The plotted growth rates are mean results estimated from likelihood values of six mice (Table S1, A and B). Changes of adipose cell-size distribution for (C) epididymal and (D) inguinal fat under normal and high-fat diets in a representative mouse among six mice are predicted by the mathematical model. Here the maximum likelihood initial cell-size distributions and model parameters are used (see Methods and the Supporting Material for detail). Note that absolute frequencies of adipose cell size are estimated by using measured relative frequencies of adipose cell size and mass of dissected fat depots. Measured final cell-size distributions are expressed with the plus symbol (+). Based on the model predictions of cell-size distribution, time trajectories of tissue mass, volume-weighted mean cell-size, and total cell number are estimated for (E) epididymal and (F) inguinal fat (n = 6; see the Supporting Material for details of the estimations). Symbols are shown to aid comparison between lines.
Using the Bayesian expectation values of the model parameters (recruitment and growth rates), the mathematical model reconstructed changes of adipose cell-size distributions under both normal and high-fat diet (Fig. 3, C and D). The evolution of cell-size distributions in retroperitoneal and mesenteric fat is similar to those of epididymal and inguinal fat, respectively (Fig. S3). The model can be used to obtain time trajectories of adipose tissue mass, volume-weighted mean cell-size, and total cell number from the predicted changes of adipose cell-size distributions (Fig. 3, E and F). The results show that under high-fat diet, hypertrophy of adipose cells is enhanced only in epididymal and retroperitoneal fat (see also Fig. S3). The model could also explain the changes of adipose cell-size distribution under the high-fat diet plus liquid Ensure (19), instead of the high-fat diet alone. The results were the same as those of the high-fat diet alone (Table S1), demonstrating that our conclusions did not result from a specific high-fat diet.
Cell loss in adipose tissues under long-term high-fat diet
Under a prolonged high-fat diet (19 weeks), fat tissues finally started to show a decrease in total cell number. Although only epididymal fat showed a failure in storing the excess energy in terms of tissue mass (Fig. 1 C), total cell number decreased in all four fat depots during the additional 12 weeks of high-fat diet, compared with cell number at week 7 (Table 1). Cell death may explain the decrease of total cell number, as suggested by hypoxia (5) and macrophage infiltration (23) under long-term high-fat diet. Therefore, we examined the timing and cell-size dependence of cell death in the model.
First, we assumed that hypertrophy of adipose cells may initiate cell death: When volume-weighted mean cell-size reaches a certain critical size , cell death starts to occur (see Eq. 1). We then ascertained the critical size that could optimally explain changes of adipose cell-size distribution under a long-term high-fat diet. The critical size is a little smaller in inguinal fat compared with epididymal fat (106 ± 4 vs. 126 ± 3 μm, P < 0.0001; Table S1).
Second, we examined two possible size dependences of cell death: Larger cells more susceptible to cell death (Model 1) or size-independent cell death (Model 2).
Both of these models could explain the changes of adipose cell-size distributions from week 7 to week 19. From this analysis, we deduced the growth and death rates for both models (Fig. 4, A and B).
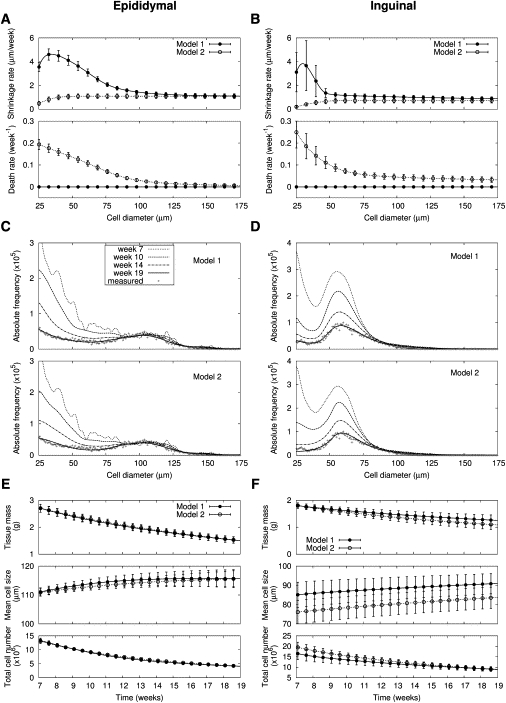
Figure 4.
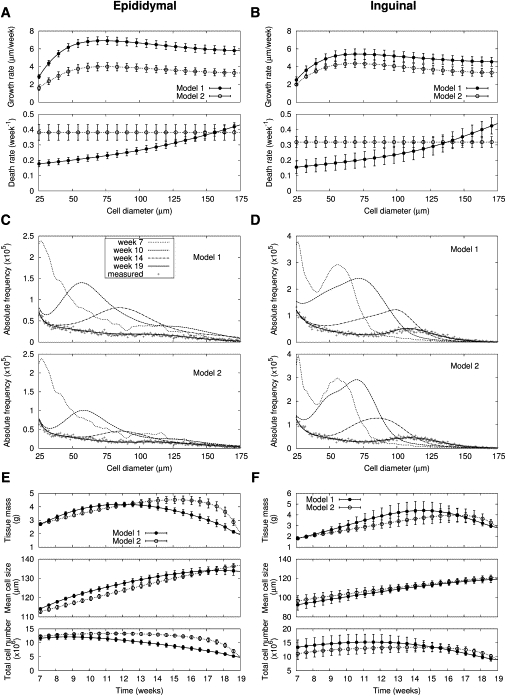
Adipose tissue growth under 19-week high-fat diet. Size-dependent growth and death rates in two models are deduced from changes of cell-size distributions in (A) epididymal and (B) inguinal fat (n = 6; Table S1, A and B). Changes of adipose cell-size distribution for (C) epididymal and (D) inguinal fat under prolonged high-fat diet in a representative mouse among six mice are predicted by two mathematical models. For the initial cell-size distributions at week 7 after high-fat diet and model parameters, the maximum likelihood values are used. Measured final cell-size distributions are expressed with the plus symbol (+). Based on the model predictions of cell-size distribution, time trajectories of tissue mass, volume-weighted mean cell-size, and total cell number are estimated for (E) epididymal and (F) inguinal fat (n = 6). Symbols are shown to aid comparison between lines.
In Model 1, the death rates above basal death rates of small adipose cells are approximately proportional to the square of cell diameter (1.8 for epididymal and 2.0 for inguinal fat) of cell diameter. We infer that the death rate is proportional to cell surface area. The models, incorporating these size-dependent properties of growth and death, described the changes of adipose cell-size distributions from week 7 to 19 completely (Fig. 4, C and D). Although the evolution pattern of cell-size distribution in the two models looked similar, the corresponding time trajectories of tissue mass, mean cell-size, and total cell number are different (Fig. 4, E and F).
In Model 2, cell death started to occur later (17 weeks of high-fat diet; Fig. 4, E and F), which is inconsistent with results (week 12) reported by Strissel et al. (23). Bayesian model comparison quantifying a model's probability for the given data also favors Model 1 (Table S2). Based on Model 1, the growth rate under long-term high-fat diet did not change from short-term high-fat diet (Fig. 3, A and B vs. Fig. 4, A and B). On the other hand, the recruitment rate decreased under this long-term high-fat diet (from 13.1 ± 2.4 to 6.3 ± 3.1 × 10⁵ cells/week (P = 0.002) for epididydimal fat in Table S1 A; and from 17.5 ± 8.3 to 9.3 ± 4.9 × 10⁵ cells/week (P = 0.067) for inguinal fat in Table S1 B). Therefore, the combined effects of cell death and attenuated recruitment of new adipose cells under long-term high-fat diet resulted in a decrease of total cell number and tissue mass. These results were qualitatively the same in retroperitoneal and mesenteric fat (Fig. S4; Table S2, C and D).
Shrinkage of adipose tissues under diet switch from high-fat to normal
When the diet was switched to normal from high-fat after week 7, mice lost fat mass (Fig. 1 B). As mentioned previously, the decrease of total cell number (diameter > 25 μm) mainly accounted for the weight loss, along with a small decrease of adipose cell-size (Table 1). Therefore, we checked if size-dependent shrinkage of adipose cells could explain the changes of cell-size distributions under this weight loss condition (Model 1). Here, recruitment of new cells was neglected because additional energy-storage capacity is not necessary for this condition of negative energy balance. As for the growth rate of adipose cells under normal diet (Fig. 3, A and B), medium-sized cells showed a higher shrinkage rate than larger cells, and the shrinkage rate was independent of size for cells larger than 100-μm diameter (Fig. 5, A and B). Note that the size dependence is qualitatively the same as that of growth rate under normal diet (Fig. 3, A and B) except for the sign; a negative sign of growth is interpreted as shrinkage (Eqs. 1 and 4).
Figure 5.
Adipose tissue shrinkage under switch to 12-week normal diet after seven-week high-fat diet. Size-dependent shrinkage and death rates in two models are deduced from changes of cell-size distributions in (A) epididymal and (B) inguinal fat (n = 6; Table S1, A and B). Note that cell death is absent in the Model 1. Changes of adipose cell-size distribution for (C) epididymal and (D) inguinal fat under the diet switch in a representative mouse among six mice are predicted by two mathematical models. For the initial cell-size distributions at week 7 after high-fat diet and model parameters, the maximum likelihood values are used. Measured final cell-size distributions are expressed with the plus symbol (+). Here shrunken cells below the minimal diameter 25 μm are removed. Based on the model predictions of cell-size distribution, time trajectories of tissue mass, volume-weighted mean cell-size, and total cell number are estimated for (E) epididymal and (F) inguinal fat (n = 6). Symbols are shown to aid comparison between lines.
After the 12 weeks of normal diet, therefore, extensive shrinkage of small and medium-sized cells resulted in the final adipose cell-size distributions (Fig. 5, C and D). Particularly in epididymal fat, a bump, which was absent in the initial cell-size distributions, clearly appeared in the final cell-size distributions with the significant loss of small adipose cells. Here, the decrease of total cell number (of diameter > 25 μm) represented removal of shrunken cells below the lower size window of 25 μm. The decrease of total adipose cell number predominantly at small cells could also be explained by cell death of small cells (Model 2). With the assumptions that larger cells shrink faster and smaller cells are more susceptible to cell death (Fig. 5, A and B), we could also fully describe the changes of adipose cell-size distribution under weight loss (Fig. 5, C and D). Time trajectories of tissue mass, mean cell-size, and total cell number from both models were similar between two models (Fig. 5, E and F). However, Bayesian model comparison favors Model 1 excluding cell death of small cells (Table S3). Again, these results were qualitatively the same in retroperitoneal and mesenteric fat (Fig. S5).
Discussion
We developed a general model to describe changes of adipose cell-size distribution in various fat depots under various diet conditions, and examined adipose tissue remodeling under weight gain and loss. Considering the limited studies about size dependence of cell growth (24), its deduction from changes of cell-size distributions is a significant finding. With regard to the size dependence of the growth rate of adipose cells, large cells grow faster than small cells in terms of diameter change. However, larger adipose cells above a certain critical size (50 μm diameter) show a size-independent growth rate, implying that their growth rate is proportional to their surface area. This also applies to the shrinkage rate of adipose cells under negative energy balance. Therefore, the larger adipose cells show the same diameter changes independent of their size with absorbing/releasing fat proportional to their cell surface area. This characteristic makes larger adipose cells inefficient at storing and releasing fat because the lipogenesis and lipolysis rate per unit volume decreases inversely with cell diameter, although larger adipose cells can still absorb/release a greater amount of fat per cell. In other words, many small adipose cells can absorb/release more fat than few large adipose cells for a given total adipose tissue volume. In addition, the enhanced growth rate of larger adipose cells under high-fat diet compared with normal diet may be related to extracellular matrix remodeling, which can increase flexibility of adipose cell hypertrophy (25).
We found that the decrease of total adipose cell number under 19 weeks of high-fat diet was due to cell loss of mainly large adipose cells along with attenuated recruitment of new adipose cells. In obesity, cell death at large adipose cells has been suggested as due to macrophage infiltration (21,23) and the fragility of enlarged adipose cells (22). In addition, the death of large adipose cells has been proposed to result from necrosis (26,27). On the other hand, under weight loss conditions, total adipose cell number also decreased. We could explain the corresponding changes of adipose cell-size distribution with size-dependent shrinkage of adipose cells. Therefore, the decrease of total cell number (diameter > 25 μm) can be interpreted simply as removal of shrunken cells which escape below the lower measurement window threshold of 25 μm. An electron microscope study has observed deflated adipose cells which decreased their volume with lipid depletion but retained membrane surface under prolonged caloric deprivation (28). When fat storage capacity is required to increase again, they can reappear within the size window. However, we could also explain the changes of adipose cell-size distributions under weight loss with cell death of small adipose cells, although this is less likely according to our Bayesian model comparison than the size-dependent shrinkage model. Considering the positive roles of apoptosis (29), it may contribute to an active decrease in lipid storage together with the size decrease of adipose cells by lipolysis under negative energy balance condition. Although the size dependence of cell death under weight loss has not been studied, apoptosis of preadipocytes has been reported (30). Note that cell death excludes the possibility of recycling of adipose cells.
Controversy still exists regarding the role of plasticity of adipose cell number in energy excess and scarcity (2–4,31). Although the controversy may result from experimental differences of species, fat depots, and age of animals, part of the reason may be simply that it is difficult to measure total cell number. In our study, we analyzed changes of cell-size distributions themselves in addition to the integrated information encompassed by total cell number. Our results support the plasticity of adipose cell number: Adipose tissues appear to recruit new cells to enlarge energy storage capacity under energy excess conditions. However, we cannot definitively conclude that adipose cell number decreases under energy scarcity conditions because we could not measure all the small adipose cells below 25 μm diameter. Although we observed that total adipose cell number (diameter > 25 μm) decreased under weight loss, the shrunken adipose cells that release fat may continue to exist as unobserved cells below the size limit of diameter (25 μm).
Prolonged positive energy balance led to cell loss in epididymal fat that was so severe that the depot mass decreased despite ongoing increase of cell-size. This simultaneous cell loss along with hypertrophy was consistently found in all fat depots. Thus, adipose tissue remodeling can have the consequence of limiting body fat storage with whole-body effects on energy partitioning and metabolism. We have recently observed that as adult male C57BL/6 mice gain weight on prolonged high-fat diet, an increasing proportion of the weight gain is deposited as fat-free mass (32). We can now offer a mechanistic interpretation of this observation in the context of adipose tissue remodeling. During prolonged positive energy balance, the body fat storage capacity may become limited as large adipose cells are preferentially lost and recruitment of new adipose cells is attenuated. Then the surplus energy must be repartitioned toward deposition of fat-free mass and whole-body fat utilization increases to dispose of the fat that would have otherwise been stored in adipose tissue.
Structural and functional differences among fat depots, as well as differences in gene expression, have been highlighted (9–14). It has been suggested that the different characteristics of respective fat depots are due to location (33) and an intrinsic difference in adipocytes (8,34). In addition, Joe et al. (31) reported that visceral (perigonadal) and subcutaneous (inguinal) fat responded differently to a high-fat diet: The former grows mostly by hypertrophy, whereas the latter grows by hyperplasia, proposing an explanation for different metabolic consequences of visceral fat expansion versus subcutaneous fat expansion. However, we found that the remodeling processes of adipose tissues during diet changes are qualitatively the same in every fat depot, although detailed quantitative changes of tissue mass and adipose cell-size distribution look different in different fat depots.
Here it is of interest that mesenteric fat was similar to subcutaneous inguinal fat, and was different from other intraabdominal epididymal and retroperitoneal fat. This is consistent with a report observing that human preadipocytes from mesenteric fat have similar genome-wide expression profiles (genes involved in lipid metabolism and development) compared to those from subcutaneous fat (34). The phenotypic differences between fat depots originated from initial differences (cell-size and number) before diet interventions and small quantitative differences of remodeling, rather than fundamental functional differences of response to diet among fat depots, because their recruitment rates of new cells and size-dependent growth/shrinkage and death rates were qualitatively the same.
The mathematical model allowed us to understand adipose tissue remodeling under various dietary conditions in terms of recruitment, growth/shrinkage, and death of adipose cells, which are not easily feasible to measure in experiment. However, it remains to incorporate energy metabolism ultimately in the model so that recruitment, growth/shrinkage, and death rates dynamically vary depending on the status of energy availability or scarcity. Such a complete model, that does not need to treat weight gain and loss conditions separately, would predict the adaptation of fat tissue (energy buffering system) for varying diet conditions. An interesting example of dynamic changes of adipose tissue under changes in energy environment may be the cyclical weight gain and loss of hibernators (35).
Acknowledgments
We thank Arthur Sherman for a critical reading of the manuscript.
This work was supported by funding from the intramural research program of the National Institutes of Health, National Institute of Diabetes and Digestive and Kidney Diseases.
Supporting Material
References
- 1.Lee M.J., Wu Y., Fried S.K. Adipose tissue remodeling in pathophysiology of obesity. Curr. Opin. Clin. Nutr. Metab. Care. 2010;13:371–376. doi: 10.1097/MCO.0b013e32833aabef. [DOI] [PMC free article] [PubMed] [Google Scholar]
- 2.Bertrand H.A., Stacy C., Maeda H. Plasticity of fat cell number. J. Nutr. 1984;114:127–131. doi: 10.1093/jn/114.1.127. [DOI] [PubMed] [Google Scholar]
- 3.Spalding K.L., Arner E., Arner P. Dynamics of fat cell turnover in humans. Nature. 2008;453:783–787. doi: 10.1038/nature06902. [DOI] [PubMed] [Google Scholar]
- 4.Hirsch J., Han P.W. Cellularity of rat adipose tissue: effects of growth, starvation, and obesity. J. Lipid Res. 1969;10:77–82. [PubMed] [Google Scholar]
- 5.Ye J. Emerging role of adipose tissue hypoxia in obesity and insulin resistance. Int. J. Obes. (Lond) 2009;33:54–66. doi: 10.1038/ijo.2008.229. [DOI] [PMC free article] [PubMed] [Google Scholar]
- 6.Prins J.B., Walker N.I., Cameron D.P. Apoptosis of human adipocytes in vitro. Biochem. Biophys. Res. Commun. 1994;201:500–507. doi: 10.1006/bbrc.1994.1730. [DOI] [PubMed] [Google Scholar]
- 7.Miller W.H., Faust I.M., Hirsch J. Effects of severe long-term food deprivation and refeeding on adipose tissue cells in the rats. Am. J. Physiol. Endocrinol. Metab. 1980;245:E74–E80. doi: 10.1152/ajpendo.1983.245.1.E74. [DOI] [PubMed] [Google Scholar]
- 8.Tran T.T., Yamamoto Y., Kahn C.R. Beneficial effects of subcutaneous fat transplantation on metabolism. Cell Metab. 2008;7:410–420. doi: 10.1016/j.cmet.2008.04.004. [DOI] [PMC free article] [PubMed] [Google Scholar]
- 9.Hamdy O., Porramatikul S., Al-Ozairi E. Metabolic obesity: the paradox between visceral and subcutaneous fat. Curr. Diabetes Rev. 2006;2:367–373. doi: 10.2174/1573399810602040367. [DOI] [PubMed] [Google Scholar]
- 10.Ibrahim M.M. Subcutaneous and visceral adipose tissue: structural and functional differences. Obes. Rev. 2010;11:11–18. doi: 10.1111/j.1467-789X.2009.00623.x. [DOI] [PubMed] [Google Scholar]
- 11.Perrini S., Laviola L., Giorgino F. Fat depot-related differences in gene expression, adiponectin secretion, and insulin action and signaling in human adipocytes differentiated in vitro from precursor stromal cells. Diabetologia. 2008;51:155–164. doi: 10.1007/s00125-007-0841-7. [DOI] [PubMed] [Google Scholar]
- 12.Einstein F.H., Atzmon G., Barzilai N. Differential responses of visceral and subcutaneous fat depots to nutrients. Diabetes. 2005;54:672–678. doi: 10.2337/diabetes.54.3.672. [DOI] [PubMed] [Google Scholar]
- 13.Palou M., Priego T., Picó C. Gene expression patterns in visceral and subcutaneous adipose depots in rats are linked to their morphologic features. Cell. Physiol. Biochem. 2009;24:547–556. doi: 10.1159/000257511. [DOI] [PubMed] [Google Scholar]
- 14.Yamamoto Y., Gesta S., Kahn C.R. Adipose depots possess unique developmental gene signatures. Obesity (Silver Spring) 2010;18:872–878. doi: 10.1038/oby.2009.512. [DOI] [PMC free article] [PubMed] [Google Scholar]
- 15.McLaughlin T., Sherman A., Cushman S.W. Enhanced proportion of small adipose cells in insulin-resistant vs insulin-sensitive obese individuals implicates impaired adipogenesis. Diabetologia. 2007;50:1707–1715. doi: 10.1007/s00125-007-0708-y. [DOI] [PubMed] [Google Scholar]
- 16.DeMartinis F.D., Francendese A. Very small fat cell populations: mammalian occurrence and effect of age. J. Lipid Res. 1982;23:1107–1120. [PubMed] [Google Scholar]
- 17.Smith S.R., Xie H., Bray G.A. Pioglitazone changes the distribution of adipocyte size in Type 2 diabetes. Adipocytes. 2006;2:11–22. [Google Scholar]
- 18.Jo J., Gavrilova O., Periwal V. Hypertrophy and/or hyperplasia: dynamics of adipose tissue growth. PLOS Comput. Biol. 2009;5:e1000324. doi: 10.1371/journal.pcbi.1000324. [DOI] [PMC free article] [PubMed] [Google Scholar]
- 19.Guo J., Jou W., Hall K.D. Persistent diet-induced obesity in male C57BL/6 mice resulting from temporary obesigenic diets. PLoS ONE. 2009;4:e5370. doi: 10.1371/journal.pone.0005370. [DOI] [PMC free article] [PubMed] [Google Scholar]
- 20.Napolitano L. The differentiation of white adipose cells: an electron microscope study. J. Cell Biol. 1963;18:663–679. doi: 10.1083/jcb.18.3.663. [DOI] [PMC free article] [PubMed] [Google Scholar]
- 21.Weisberg S.P., McCann D., Ferrante A.W., Jr. Obesity is associated with macrophage accumulation in adipose tissue. J. Clin. Invest. 2003;112:1796–1808. doi: 10.1172/JCI19246. [DOI] [PMC free article] [PubMed] [Google Scholar]
- 22.Monteiro R., de Castro P.M., Azevedo I. Adipocyte size and liability to cell death. Obes. Surg. 2006;16:804–806. doi: 10.1381/096089206777346600. [DOI] [PubMed] [Google Scholar]
- 23.Strissel K.J., Stancheva Z., Obin M.S. Adipocyte death, adipose tissue remodeling, and obesity complications. Diabetes. 2007;56:2910–2918. doi: 10.2337/db07-0767. [DOI] [PubMed] [Google Scholar]
- 24.Tzur A., Kafri R., Kirschner M.W. Cell growth and size homeostasis in proliferating animal cells. Science. 2009;325:167–171. doi: 10.1126/science.1174294. [DOI] [PMC free article] [PubMed] [Google Scholar]
- 25.Khan T., Muise E.S., Scherer P.E. Metabolic dysregulation and adipose tissue fibrosis: role of collagen VI. Mol. Cell. Biol. 2009;29:1575–1591. doi: 10.1128/MCB.01300-08. [DOI] [PMC free article] [PubMed] [Google Scholar]
- 26.Ochi M., Sawada T., Hattori T. Morphology and cell dynamics of adipose tissue in hypothalamic obese mice. Am. J. Physiol. 1988;254:R740–R745. doi: 10.1152/ajpregu.1988.254.5.R740. [DOI] [PubMed] [Google Scholar]
- 27.Cinti S., Mitchell G., Obin M.S. Adipocyte death defines macrophage localization and function in adipose tissue of obese mice and humans. J. Lipid Res. 2005;46:2347–2355. doi: 10.1194/jlr.M500294-JLR200. [DOI] [PubMed] [Google Scholar]
- 28.Simon T.L., Williamson J.R. The fate of lipid-depleted fat cells. An ultrastructural study of the effects of prolonged caloric deprivation on fat cells and other tissues of the rat. Arch. Pathol. 1967;83:162–168. [PubMed] [Google Scholar]
- 29.Carson D.A., Ribeiro J.M. Apoptosis and disease. Lancet. 1993;341:1251–1254. doi: 10.1016/0140-6736(93)91154-e. [DOI] [PubMed] [Google Scholar]
- 30.Niesler C.U., Siddle K., Prins J.B. Human preadipocytes display a depot-specific susceptibility to apoptosis. Diabetes. 1998;47:1365–1368. doi: 10.2337/diab.47.8.1365. [DOI] [PubMed] [Google Scholar]
- 31.Joe A.W.B., Yi L., Rossi F.M. Depot-specific differences in adipogenic progenitor abundance and proliferative response to high-fat diet. Stem Cells. 2009;27:2563–2570. doi: 10.1002/stem.190. [DOI] [PubMed] [Google Scholar]
- 32.Guo J., Hall K.D. Estimating the continuous-time dynamics of energy and fat metabolism in mice. PLOS Comput. Biol. 2009;5:e1000511. doi: 10.1371/journal.pcbi.1000511. [DOI] [PMC free article] [PubMed] [Google Scholar]
- 33.Meade C.J., Ashwell M. Site differences in fat cells of New Zealand obese mice—a transplantation study. Metabolism. 1980;29:854–858. doi: 10.1016/0026-0495(80)90124-9. [DOI] [PubMed] [Google Scholar]
- 34.Tchkonia T., Lenburg M., Kirkland J.L. Identification of depot-specific human fat cell progenitors through distinct expression profiles and developmental gene patterns. Am. J. Physiol. Endocrinol. Metab. 2007;292:E298–E307. doi: 10.1152/ajpendo.00202.2006. [DOI] [PubMed] [Google Scholar]
- 35.Dark J., Stern J.S., Zucker I. Adipose tissue dynamics during cyclic weight loss and weight gain of ground squirrels. Am. J. Physiol. 1989;256:R1286–R1292. doi: 10.1152/ajpregu.1989.256.6.R1286. [DOI] [PubMed] [Google Scholar]
Associated Data
This section collects any data citations, data availability statements, or supplementary materials included in this article.