

Abstract
The Kras protein, a member of the Ras family of bio-switches that are frequently mutated in cancer and developmental disorders, becomes functional when anchored to the inner surface of the plasma membrane. It is well known that membrane attachment involves the farnesylated and poylcationic C-terminus of the protein. However, little is known about the structure of the complex and the specific protein-lipid interactions that are responsible for the binding. On the basis of data from extensive (>0.55 μs) molecular dynamics simulations of multiple Kras anchors in bilayers of POPC/POPG lipids (4:1 ratio), we show that, as expected, Kras is tethered to the bilayer surface by specific lysine-POPG salt bridges and by nonspecific farnesyl-phospholipid van der Waals interactions. Unexpectedly, however, only the C-terminal five of the eight Kras Lys side chains were found to directly interact with the bilayer, with the N-terminal ones staying in water. Furthermore, the positively charged Kras anchors pull the negatively charged POPG lipids together, leading to the clustering of the POPG lipids around the proteins. This selective Kras-POPG interaction is directly related to the specific geometry of the backbone, which exists in two major conformational states: 1), a stable native-like ensemble of structures characterized by an extended geometry with a pseudohelical turn; and 2), less stable nonnative ensembles of conformers characterized by severely bent geometries. Finally, although the interface-bound anchor has little effect on the overall structure of the bilayer, it induces local thinning within a persistence length of ∼12 Å. Our results thus go beyond documenting how Kras attaches to a mixed bilayer of charged and neutral lipids; they highlight a fascinating process of protein-induced lipid sorting coupled with the (re)shaping of a surface-bound protein by the host lipids.
Introduction
Covalent modification of amino acids by specific lipids is essential for membrane binding and function of many signaling proteins, such as the Ras GTPases (1–3). The three most commonly expressed Ras proteins in humans—Nras, Hras, and Kras—are farnesylated at a C-terminal cysteine. Nras and Hras achieve high-affinity membrane binding through additional lipid modification, whereas Kras has a stretch of eight lysine residues immediately upstream of the farnesylated Cys (3,4).
Ras proteins function as molecular switches in signaling pathways that control crucial cell-fate decisions, such as the decision to proliferate, differentiate, or die (5). Although they have nearly identical catalytic machineries (6), individual Ras proteins mediate distinct signaling pathways (7,8) and are linked to distinct cancers and developmental disorders (9–15). An overwhelming body of research suggests that the way in which Ras proteins organize on the plasma membrane plays a key role in specifying their function (16–21). To unravel this fascinating link between membrane targeting and functional diversity, an atomic-level understanding of how each Ras protein partitions into membranes is required. Recent computational and experimental studies on the insertion of Nras and Hras anchors into model membranes yielded useful insights into some of the basic structural and thermodynamic features of Ras-membrane association (18,22–32). For example, membrane insertion was found to be driven by the hydrophobic effect associated with the removal of the apolar groups from water and their subsequent van der Waals (vdW) interactions with the bilayer hydrophobic core. However, the specific localization of the different components of the anchor was shown to be tuned by anchor-phospholipid hydrogen bonds (HBs) (7,8,27). Similar studies for Kras have not been performed, which is surprising given the status of Kras as the most frequently mutated protein in Ras-related diseases (10,14,33).
To fill this gap, we performed extensive all-atom molecular dynamics (MD) simulations (for a total of ∼0.55 μs) of 2-oleoyl-1-palmitoyl-sn-glycero-3-phosphocholine (POPC) bilayers containing 23% (molar ratio) 2-oleoyl-1-palmitoyl-sn-glycero-3-phosphoglycerol (POPG) lipids and multiple Kras anchors. We found that Kras is tethered to the mixed bilayer through nonspecific vdW interactions between its farnesyl tail and the phospholipid hydrocarbon tails, and specific Coulomb interactions between five of its eight Lys residues and the negatively charged POPG phosphates. The interfacial localization of the peptide induces local thinning but has little effect on the average thickness of the whole bilayer. The preferential Lys-POPG interactions led to the formation of POPG microclusters around the Kras anchor and sculpting of the backbone into an ensemble of pseudohelical extended conformations.
Methods
Two explicit solvent MD simulations were carried out in the tensionless NPT ensemble (T = 310 K, and P = 1.01325 atm) with the recently updated CHARMM36 (C36) force field (34): 1), a small bilayer of 80 POPC and 24 POPG lipids containing a Kras anchor at each leaflet (simulation S); and 2), a fourfold larger bilayer consisting of 416 lipids and eight Kras anchors (simulation L). The equilibrium structural properties of these bilayers were compared with data from previously reported 70 ns and 120 ns MD simulations carried out under identical conditions and lipid composition, but without the Kras anchors (35). The NAMD program (36) was used for the simulations, and VMD (37) was used for visualization.
Initial models
The initial model for simulation S was obtained by inserting one Kras peptide into each leaflet of a 32 ns snapshot taken from a previously equilibrated POPC/POPG bilayer (35). The orientation and insertion depth of the peptides were determined based on lessons from a constant area POPC/POPG/Kras simulation (A. A. Gorfe, unpublished) carried out with the CHARMM27 force field (38). In that simulation, insertion was accelerated by applying an external biasing potential on the terminal methyl carbons of the farnesyl chain during the initial stage of the simulation, as described in Supporting Material. The biasing approach built on previous studies in which insertion of 5–7 lipid tail carbons of N and Hras anchors into the hydrophobic core of DMPC bilayers led to insertion and stabilization in <20 ns of simulation time (18,23–26). The initial model for L was prepared by assembling four copies of a 100 ns snapshot of S into a bilayer of 320 POPC, 96 POPG, and eight Kras anchors (a total of 129,164 atoms).
MD simulation
Each system was minimized for 2000 steps with lipid and peptide nonhydrogen atoms fixed, and for another 2000 steps with only the phosphorous and Cα atoms harmonically restrained (k = 4 kcal mol−1 Å−2). This was followed by a 200 ps equilibration and by another three 100 ps equilibrations with k scaled by 0.75, 0.5, and 0.25. The production simulations were run for the durations listed in Table 1 using an integration time step, δt, of 2 fs (δt was 1 fs during the equilibration) with all bonds involving hydrogen constrained by SHAKE. The NAMD multi-time-stepping procedure was used with the bonded and nonbonded forces computed every δt and the particle mesh Ewald calculations performed every 2δt, and with a step cycle of 10. The cutoffs for the nonbonded interactions and the pair-list updates were 12 and 14 Å, respectively, with the switch function turned on at 10 Å.
Table 1.
Ensemble-averaged bilayer properties and protein-bilayer interactions (mean ± SD)
| Sim | POPC:POPG:Kras | Atoms | Length [ns] | 〈AL〉∗ [Å2] | 〈DP-P〉† [Å] | 〈DC2-C2〉‡ [Å] | 〈NHB〉§ per peptide |
〈NC〉¶ per peptide |
||
|---|---|---|---|---|---|---|---|---|---|---|
| POPC | POPG | POPC | POPG | |||||||
| S | 80:24:2 | 32,291(32,524) | 300(70) | 63.4 ± 1.5 | 38.9 ± 0.7 | 27.9 ± 0.7 | 3.6 ± 1.3 | 3.6 ± 1.0 | 7.1 ± 2.0 | 3.1 ± 1.5 |
| (63.6 ± 1.2) | (39.7 ± 0.6) | (28.2 ± 0.3) | ||||||||
| L | 320:96:8 | 129,164(130,096) | 250(120) | 64.9 ± 0.8 | 38.8 ± 0.4 | 27.9 ± 0.4 | 3.6 ± 0.6 | 3.4 ± 0.7 | 6.3 ± 1.1 | 3.6 ± 0.8 |
| (64.4 ± 0.8) | (39.1 ± 0.4) | (28.2 ± 0.3) | ||||||||
Data for the peptide-free bilayers shown in parentheses were obtained from Janosi and Gorfe (35). The first 130 ns of trajectory S and 30 ns of L were excluded (see text). DP-P represents the bilayer thickness calculated as the average distance along the membrane normal between the COMs of the phosphorus atoms at the two leaflets, AL is the area per lipid obtained from the area of the simulation box divided by the number of lipids per leaflet, and DC2-C2 is the hydrophobic thickness calculated as the average distance along the membrane normal between the COMs of the first methyl carbon atoms at the two leaflets.
AL is corrected for the area occupied by the bound peptide(s) at each leaflet approximating the area of a peptide as being equal to the area of a POPC molecule.
Respectively in S and L: 〈DP-P (POPC)〉 = 39.0 ± 0.7 and 39.0 ± 0.4; 〈DP-P (POPG)〉 = 38. 6 ± 1.0 and 38.1 ± 0.6.
Respectively in S and L: 〈DC2-C2 (POPC)〉 = 28.0 ± 0.7 and 28.0 ± 0.4; 〈DC2-C2 (POPG)〉 = 27. 8 ± 0.9 and 27. 5 ± 0.4.
NHB is the number of Kras-bilayer HBs defined by a donor-acceptor distance cutoff of 3.1 Å and donor-hydrogen-acceptor angle cutoff of 150°.
NC is the number of peptide-bilayer vdW contacts defined as the number of POPC and POPG tail carbons within 4 Å of any farnesyl tail carbon.
Analysis
Standard procedures and available tools were used for some analyses, such as to calculate the HBs and radial distribution functions. However, since the Kras anchor lacks internal interaction, standard structure analysis techniques, such as root mean-square deviation (RMSD) or contact map, are of little value. Therefore, it was necessary to define a small number of suitable reaction coordinates (RCs) that characterize the flexible structure. As the majority of the peptides adopted a pseudohelical geometry during the simulations (visual inspection), the end-to-end distance (dbb, the distance between the first and last Cα atoms) was chosen to measure the overall compactness of the peptide structure. To define a second RC, we first compared each conformer with every other based on their pairwise Cα RMSD (pRMSD). The resulting frequency distribution was used to gauge the diversity of the simulated conformers. This is useful because if the distribution is Gaussian, then backbone properties such as the RMSD calculated over all residues can serve as a good RC. Otherwise, an iterative pRMSD calculation on subsets of residues can be used to search for a segment whose shape can group the available conformers into a few distinct clusters. In this work, the distribution of the pRMSD yielded two not-well-separated clusters of conformations. Therefore, after tests with various sequence lengths, we searched for a four-residue segment (residues 1–4, 2–5, etc.) whose pRMSD distribution yields clearly separated clusters. Residues 7–10 satisfied this criterion, and the dihedral angle defined by the virtual bonds linking the Cα atoms of these residues (Ω) was chosen as the second RC. A combined analysis of Ω and dbb led to the classification of the simulated Kras anchor structures into multiple well-populated conformational states (an example of the relationship between the global measure dbb and the local measure Ω is given in Fig. S1).
Results and Discussion
Insertion of Kras into the POPC/POPG bilayer
The 11-residue polycationic Kras membrane anchor (residues 175–185) is composed of eight lysines, a serine, a threonine, and a farnesylated cysteine (Fig. 1 A). This peptide may spontaneously insert into the negatively charged POPC/POPG bilayer, but this may require a prohibitively long simulation time, as suggested by previous experiences with the apolar Nras and Hras anchors (24,26). The rate-limiting step for insertion likely involves the transfer of the hydrophobic farnesyl tail across the polar bilayer surface. Therefore, this process was accelerated by an external biasing force that was turned off after about half of the farnesyl tail's carbon atoms were transferred into the bilayer hydrophobic core (see Materials and Methods). The subsequent nonspecific interaction of the inserted carbons with the bilayer led to a full insertion of the farnesyl moiety within ∼20 ns of subsequent bias-free simulation (Supporting Material). However, obtaining a stable bilayer-distribution for the rest of the amino acids would require a much longer simulation time, since in addition to the electrostatic-driven initial docking of the peptide to the bilayer surface, it involves a slow, perhaps diffusion-limited, reorganization of lipids and peptides.
Figure 1.

(A) Sequence and extended structure of the Kras anchor, with the backbone colored by the residue type shown at the top. Nonlipid modified side-chain oxygens are in red, nitrogens are in blue, and carbons are in light green. The farnesylated cysteine (Farn) is in yellow. Sequence numberings used here (1–11) and in the full-length protein (175–185) are also indicated. (B) Side view of a snapshot from simulation S with a single Kras anchor per leaflet colored by residue type. The bilayer is represented by silver-colored sticks apart from the headgroups shown in black (POPC) and red (POPG) space-filling models. (C) Top view of a snapshot from simulation L with the same color code as in B. Water and hydrogen atoms were omitted for clarity.
Convergence and validation of the simulations
MD simulations of single-component bilayers equilibrate reasonably fast, typically within tens of nanoseconds, because the isotropic interactions do not significantly change by lipid self-diffusion. In multicomponent bilayers, the anisotropic interlipid interactions that depend on the diffusion of the constituent lipids may require hundreds of nanoseconds to fully equilibrate. To determine whether the bilayers in simulations S and L had equilibrated, we monitored the bilayer thickness (DP-P) measured by the head-to-head distance along the bilayer normal using the POPC and POPG lipid types alone or in combination. As shown in Fig. 2 A, the DP-P plots plateaued after ∼60 and ∼30 ns in S and L, respectively. The hydrophobic thickness (DC2-C2; see legend of Table 1) and the area per lipid (AL) yielded very similar profiles.
Figure 2.
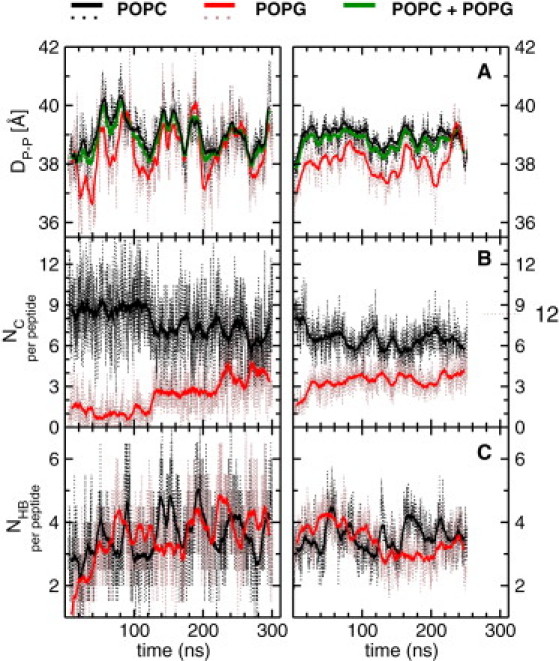
Time evolution of bilayer thickness and peptide-bilayer interactions during simulations S (left) and L (right): (A) bilayer thickness (DP-P), (B) number of carbon-carbon contacts per peptide (NC), and (C) number of HBs per peptide (NHB). Dotted and solid lines indicate the instantaneous values and running averages, respectively. Note that S and L equilibrated after ∼130 ns and 30 ns, respectively. Thus, data from the first 130 ns of S and 30 ns of L were excluded in subsequent analyses. See legend of Table 1 for definitions of DP-P, NC, and NHB.
A stringent test of system equilibration is to monitor peptide-lipid interactions that might lead to the formation of Kras/lipid microclusters, an inherently slow process that depends on the rate of diffusion of individual lipids and/or peptides. To that end, in Fig. 2, B and C, we plot the time evolutions of the numbers of peptide-lipid vdW contacts (NC) at the hydrophobic core and HBs (NHB) at the headgroup, calculated separately for the POPC and POPG lipids (see legend of Table 1 for definitions of vdW contacts and HBs). At the start of S, both NC and NHB are dominated by the more-abundant POPC (Fig. 2, B and C, left). Subsequently, NHB(Kras-POPC) and NHB(Kras-POPG) both equilibrate to ∼3.5 within ∼20 ns and 60 ns, respectively (Fig. 2 C, left). However, NC continues to be dominated by the POPC lipids until ∼130 ns, where NC(Kras-POPC) is reduced by ∼2 concomitantly with a dramatic increase in NC(Kras-POPG) (Fig. 2 B, left). The large system L behaves as if it is a continuation of S (it was started from a 100 ns snapshot of S), such that the NHBs continue to fluctuate around ∼3.5 (i.e., the equilibrium value already attained in S), whereas NC(Kras-POPC) and NC(Kras-POPG) undergo sharp transitions at ∼30 ns to equilibrium values similar to those observed for S, namely, ∼3.5 and 6.3 (Fig. 2, B and C, right).
Overall, both the small and large systems equilibrated very well and yielded very similar final averages. The only major difference is the smaller fluctuations in the latter (Fig. 2), likely due to the better statistics in the larger system, which is to be expected from statistical mechanical considerations. As a result, the ensemble-averaged thicknesses (〈DP-P〉 and 〈DC2-C2〉) and area per lipid (〈AL〉) are very similar in the two systems, as are 〈NC〉 and 〈NHB〉 (Table 1). Moreover, 〈DP-P〉, 〈DC2-C2〉, and 〈AL〉 are all within error of the corresponding value in the peptide-free simulations (Table 1), suggesting that Kras insertion has a negligible effect on the overall structure of the bilayer.
Structure of bilayer-bound Kras anchor (a two-state model)
The structure of the Kras anchor is not known. Sequence-based algorithms predicted no secondary structure content, and visual inspection and HB analyses of the simulated structures suggested few intrapeptide interactions. The stable peptide-bilayer interactions (Fig. 2), especially the HBs, imply a stable backbone orientation but say little about its three-dimensional structure. The question remains: Can the bilayer-bound Kras anchor be characterized by a few well-defined structural ensembles?
To answer this question, we pooled together all conformers sampled every 2 ps from both S (two peptides) and L (eight), and generated a single set of ∼1.2 million conformers. The frequency distribution of the pRMSDs among these conformers suggests the presence of two major clusters with a significant population of intermediates (Fig. 3 A, black line). As described in Materials and Methods, we defined two other RCs to further analyze the backbone structure: 1), the end-to-end distance, dbb; and 2), the dihedral angle, Ω, defined by the Cα atoms of residues 7–10. The density plots of the conformers in the Ω/dbb plane yielded two distributions: one at Ω ≈ −150 ± 60°/13 Å < dbb < 21Å and another at Ω ≈ 50 ± 30°/8 Å < dbb < 18 Å. The first has a single sharp peak around Ω ∼ −165°/dbb ∼ 18.0 Å, whereas the second has several peaks, including at Ω ∼60°/dbb ∼10 Å and Ω ∼80°/dbb ∼ 13.5 Å. The contours in Fig. 3 C summarize these data, and Fig. 2 D provides examples of conformers at the maxima of the three peaks.
Figure 3.
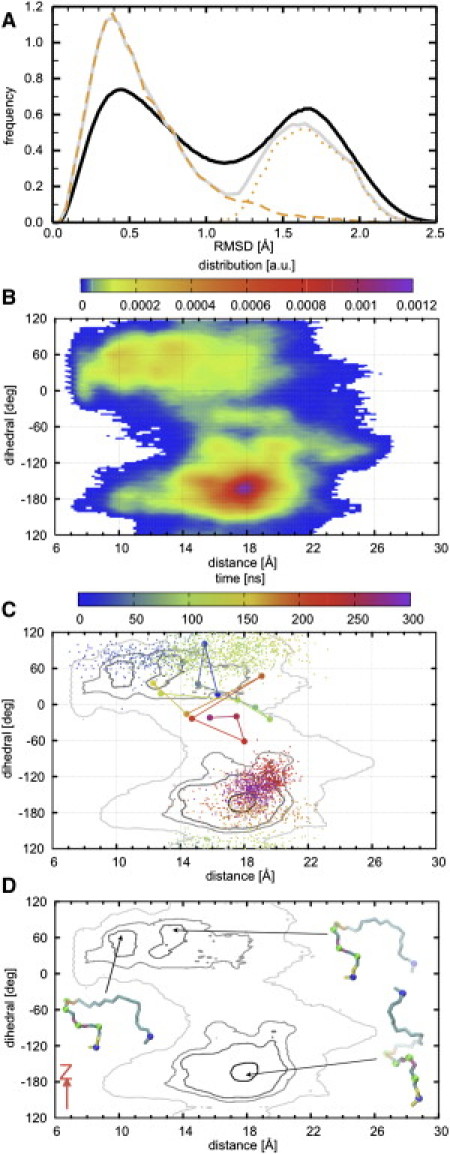
(A) RMSD analysis of the peptide backbone. (B) Density distribution of ∼1.2 million structures based on a dihedral angle Ω defined by the Cα atoms of residues 7–10 and a backbone end-to-end distance (dbb) (see Materials and Methods). (C) Contour plot of the distribution in B, where light gray represents the low-density population and black represents the high-density population. (D) Representative structures at the three central maxima. Shown in A are the pRMSD (black) and the RMSD from the structure located at the maximum of the distribution of panel D (equivalently at the bottom of the deepest minimum) of all conformers (gray) and of conformers with Ω > 135° or Ω < −20° (orange dash) and −20° ≤ Ω ≤ 135° (orange dot). In C, the transition between population basins (across Ω ≈ 135°) is illustrated by dots representing Ω/dbb coordinates from 0.1-ns-separated snapshots of one peptide in S, whereas an attempt to transition (across Ω ≈ −20°) is illustrated by a solid line connecting Ω/dbb coordinates (circles) from 20-ns-separated snapshots of one peptide in L. The trajectories are color-coded from blue (0 ns) to purple (300 ns). In D, bonds are colored as in Fig 1, whereas Cα atoms of residues 7–10 (which define Ω) are in green beads and those of residues 1 and 11 (which define dbb) are in blue beads. The backbone structures in the two upper minima have similar Ω (although the one to the left is more compact) and both lie roughly parallel to the membrane plane. The most frequently sampled conformation within the high-density contour at the bottom of the density plot spirals along the membrane normal (z-axis, shown in red) with its N-terminus pointing away from the bilayer surface.
Since the probability density (ρ) is related to the free-energy change (ΔG) through ΔG = −RTln(ρ), where R is the gas constant and T is the absolute temperature, the distributions in Fig. 3 A can be regarded as free-energy surfaces, with the peaks representing free-energy wells. With this in mind, and defining the two high-density regions in Fig. 3 B as basins, we can see that the Kras anchor exists in two major conformational states: an ensemble of extended backbone structures with a pseudohelical turn in the middle (state 1), and multiple ensembles of bent conformations (state 2). State 1 is characterized by a deep funnel-shaped well with a rough surface, and state 2 is characterized by multiple shallow wells with a relatively smooth surface. The lack of sufficient sampling by conventional MD (even with long runs, as performed in this work), and therefore the lack of multiple interstate transitions, prevented us from quantifying the relative stability of the peptide in the two states. However, the following considerations suggest that state 1 may be the most stable: First, the different population sizes in the distributions or, equivalently, the different depths of the multiple free-energy wells suggest that the vast majority of the structures sample from state 1. Evidence for this is given by the RMSD with respect to a structure at the bottom of the basin in state 1 (Fig. 3, orange lines), calculated separately for structures with Ω > 135° or Ω < −20° (dashes) and with −20° ≤ Ω ≤ 135° (dots). Second, whereas four out of the eight peptides in L and one out of the two in S were in state 1 for the entire duration of the simulations, the remaining peptides that were originally either in state 2 or in intermediate states made repeated (some successful) attempts to transition to state 1. These interminima transitions are illustrated by the time evolutions of Ω/dbb coordinates for one peptide each from S and L (Fig. 3 C; notice that transitions or attempts to transition occurred only from state 2 to 1).
The simulations are not expected to sample the entire phase space available to the system; however, the wide regions sampled clearly show that the backbone can adopt many different shapes. Therefore, the preponderance of conformations that belong to the two broadly defined conformational states raises the question: What do states 1 and 2 represent? This question is reminiscent of the protein-folding problem, and the remarkable data in Fig. 3 invoke the folding-funnel hypothesis (39,40). According to this hypothesis, conformations at the bottom of a funnel-shaped free-energy surface represent the folded native state, and the denatured state may be characterized by meta-stable conformations populating multiple shallow minima. Analogously, conformers at the bottom of basin 1 represent the most stable native structure of membrane-bound Kras anchor. These structures are devoid of stable internal interactions, are extended apart from a single pseudohelical turn in the middle, and are stabilized by peptide-bilayer interactions (see below). Conformers in basin 2 represent ensembles of nonnative Kras anchor structures. These structures are bent (small end-to-end distance), and contain a dynamic HB between one of the N-terminal Lys side chains and a backbone carbonyl.
Pseudohelical open backbone conformation for enhanced bilayer interaction
Because the shape and orientation of the backbone are expected to affect peptide-bilayer interaction at the interface and possibly even at the hydrophobic core, we wanted to compare the bilayer interactions of the peptide in conformational states 1 and 2. To this end, two sets of peptide/lipid coordinates were derived as follows: If a peptide was located in basin 1 circumscribed by the second outermost contour in Fig. 2, C (or D), the frame from which that peptide was derived was extracted and appended into a file. If the peptide was located in state 2, the frame from which it was derived was extracted and written out in another file. These two very large data files were analyzed to evaluate the protein-lipid interactions in the two states. Fig. 4 displays the distribution of the numbers of Kras-POPC and Kras-POPG HBs in states 1 and 2. The NHB(Kras-POPC)s are similar in the two states. However, not only are there fewer NHB(Kras-POPG)s in state 2, but the multiple peaks in the distribution also suggest dynamic interactions. In short, the peptide in conformational state 1 makes a larger number of HBs and is better suited to preferentially interact with POPG lipids, whereas the anchor in state 2 appears unable to cluster POPG lipids around it. The apparent segregation of POPG by the Kras anchor in conformational state 1 is reminiscent of membrane remodeling by proteins, whereas the stabilization of a specific conformational state of the anchor by the bilayer illustrates one way in which surface bound proteins are sculpted by membranes. Finally, the finding that the most populated backbone conformation is also the most suitable form for membrane binding, and hence is favored by the enthalpy of binding, lends additional support to our earlier conclusion that conformers in state 1 likely represent the native ensemble. Therefore, the following two sections focus on cases in which the peptide is in state 1.
Figure 4.

Distributions of the average number of Kras-POPC and Kras-POPG HBs per peptide. Solid lines represent the interactions when the peptide is in state 1, and dashed lines indicate when it is in state 2 (see text and Fig 3 for the definition of states 1 and 2). In subsequent figures, only frames in which the peptide is in state 1 are used.
Specific Kras-bilayer interactions and protein-induced lipid segregation
It is apparent from the sequence in Fig. 1 A that a combination of vdW and electrostatic forces will attach the Kras anchor to a negatively charged bilayer. We can further infer from the sequence that the farnesyl tail will pack with the phospholipid hydrocarbon chain, whereas the amino group of the Lys side chains will make HBs or salt bridges with phospholipid headgroups. What is the relative importance of the individual residues?
The bilayer localization and therefore the qualitative contribution to binding of the peptide backbone and individual side chains can be gleaned from the number density distributions shown in Fig. 5. The backbone and the Lys side chains populate a wide range of the bilayer transverse dimensions roughly between |z| = 34 Å and |z| = 8 Å. A comparison with the distributions for various groups of POPC and POPG atoms (e.g., phosphate and methyl carbons; Fig. 5, top and middle) reveals that a proportion of the backbone and the Lys side chains is outside the bilayer. On the other hand, the relatively deep insertion of the C-terminal OCH3 and Farn (peak at |z| = 12 Å and |z| = 8 Å, respectively), along with the interfacial localization of Ser and Thr side chains (whose peaks at |z| ≈ 21 Å is close to the peak for PO4 at ∼20 Å), indicate that residues at the C-terminal half of the peptide are either buried or reside at the interface. Thus, the Farn tail and OCH3 are in the hydrophobic core, the neighboring residues are at the water-lipid interface, and residues at the N-terminal half of the peptide are largely in water.
Figure 5.
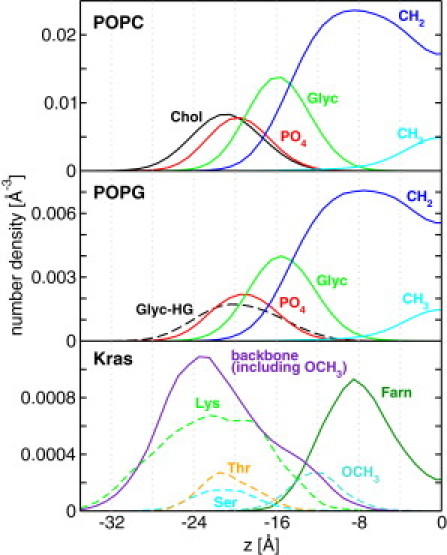
Number density distributions for various components of POPC (top), POPG (middle), and Kras (bottom). Since the distributions are symmetric, only the lower leaflet is shown here.
To further investigate the specific atomic interactions underlying this distribution, we calculated the radial pair distribution functions (g(r)) of phosphate, glycero-ester, and glycerol head oxygen atoms of POPC and POPG around the Nζ atom of each Lys residue, the Oγ of Ser and Oγ1 of Thr, and the amide nitrogen of the backbone. Those with significant interactions (i.e, those with a significant first peak) are shown in Fig. 6. A striking result is that, apart from the sporadic hydrogen bonding of Lys8 and Lys10 with POPC (top panel), the vast majority of the Lys side chains (residues 3, 4, 6, 8, and 10; middle panel) interact with POPG. The C-terminal backbone amides (residues 7–10; bottom panel) and to a limited extent Ser and Thr (not shown) also interact with the POPG phosphates. This is consistent with the Kras-induced segregation of POPG noted above. The salt bridge from Lys8 (square) is the most significant, followed by those from Lys6 and Lys10 (light gray) and Lys3 and Lys4 (dark gray). Interestingly, Lys1 and Lys5 do not interact with the bilayer while Lys2 interacts occasionally (filled circles). The N-terminal Lys1 and Lys2 are far way from the bilayer surface and therefore remain solvated, whereas Lys5 is in the middle of the peptide pseudohelical turn pointing toward the solvent. Another remarkable outcome of the g(r) plots is that the peptides almost exclusively interact with the phosphate oxygens, with only a few HBs with the hydroxyls of the POPG headgroup (typically via Lys3 and Lys4) and with the glycero-ester oxygens (not shown). This is consistent with the interfacial localization of the side chains highlighted by the density distributions (Fig. 5).
Figure 6.

Radial distributions of phosphate oxygens around Lys Nζ (top and middle panels) and the last four backbone amide nitrogens (bottom). The distributions in the middle panel suggest a strong salt bridge with POPG phosphate by Lys8, Lys6, Lys10, Lys3, Lys4, and occasionally Lys2. Lys8 and Lys10 also form occasional HBs with POPC phosphates (top panel).
A number of previous studies have shown that polycationic proteins and peptides, such as the myristoylated alanine-rich C kinase substrate (MARCKS), interact with membrane patches enriched with negatively charged lipids (41–49). Polybasic membrane binding motifs are ubiquitous in biology and are common in small GTPases (50). It is thus intuitive to expect that each positive charge contributes to membrane binding. Yet, our results clearly show that on average only five of the eight lysine residues (excluding 1, 2, and 5) directly interact with the POPG headgroups. One could argue that even when they do not directly interact with phospholipids, the Lys residues could still contribute to affinity by helping to polarize the interfacial region. It is also possible that the now-idle Lys residues would make HBs in the full-length protein or in the presence of a higher concentration of anionic lipids, such as in bilayers containing polyanionic phosphoinositol lipids (e.g., PIP2). This is consistent with the preferential interaction with PIP2 of many polycationic membrane-binding motifs, including MARCKS and the HIV gag protein (51). The preference of the Kras anchor for the negatively charged POPG supports this notion, whereas the fact that each Kras anchor is surrounded disproportionately more by POPG than POPC lipids (Figs. 1, 2, 4, and 5) highlights how proteins recruit specific lipids to maximize their interaction. Clustering involves an initial electrostatics-induced headgroup segregation followed by a slow rearrangement of acyl chains (Fig. 2). Thus, going beyond documenting Kras protein-lipid recognition, these data illustrate a rarely observed phenomenon of protein-induced lipid sorting. A recent report based on a combination of solid-state NMR and replica-exchange MD found that the Nras anchor exists in two dominant conformations that are shaped by peptide-membrane interactions (52). On the basis of that finding and our results, it is tempting to speculate that Ras-induced lipid sorting, as well the existence of at least two dominant structural ensembles, may be a general feature of membrane-bound Ras anchors.
Bilayer structure perturbation
A comparison of the ensemble-averaged bilayer structural properties derived from S and L with those from protein-free simulations (Table 1) clearly shows that Kras binding does not alter the overall structure of the bilayer. This is in part because only the farnesyl tail and the oxomethylated C-terminus penetrate the bilayer hydrophobic core (Figs. 1 and 5). However, when the bilayer thickness is calculated for the POPC and POPG lipids located at a distance dCOM-P away from the center of mass (COM) of residues 7–10 Cα atoms (in slices of 0.1 Å in the x-y plane), we find that Kras significantly perturbs the structure of lipids to within ∼12 Å (Fig. 7 A), with the POPG lipids that preferentially solvate the peptide being affected the most. Similar local thinning is frequently seen in studies of membrane binding by (usually cationic) antimicrobial peptides (53–56), and is consistent with the proposed membrane-thinning effect of interface-bound molecules (57). The Kras anchor thinned the bilayer primarily by pushing down headgroups in its vicinity, as indicated by the changes in the phosphorous z-positions from the equilibrium values (Fig. 7 B). Notice also the modest increase in the bilayer thickness for lipids located beyond the apparent persistence length of 12 Å (Fig. 7 A), which explains why the overall thickness remains similar to that of a peptide-free bilayer (Table 1). Also, as if to neutralize the larger effect on POPG (Fig. 7), the POPC lipids became slightly taller, yielding 〈DP-P (POPC)〉 = 39.0 ± 0.4, compared with 〈DP-P (POPG)〉 = 38.1 ± 0.6 for the POPG lipids (legend of Table 1).
Figure 7.
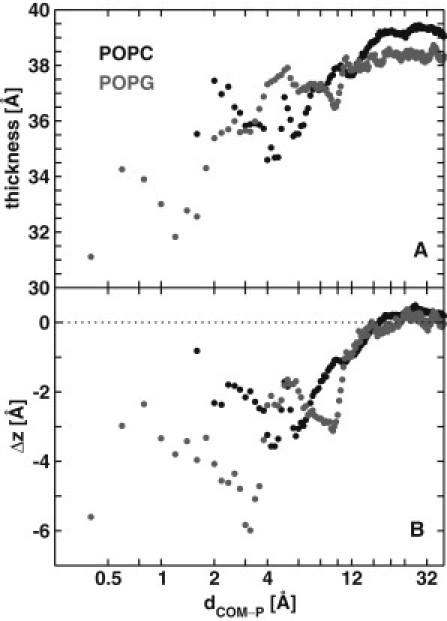
(A) DP-P for the POPC and POPG lipids at a distance dCOM-P away from the Cα COM of residues 7–10. (B) Difference between the COM z-location between phosphorus atoms at dCOM-P and those of the entire leaflet.
Local perturbation of bilayer structure, but not necessarily thinning, was noted in previous simulations of lipidated peptides (24,26). For instance, the Hras anchor was shown to increase the thickness of a DMPC bilayer in its vicinity (24). However, those simulations differed from the current ones in a number ways, including their use of the shorter DMPC lipids and constant area condition, as well as modeling of the farnesyl tail by a hexadecyl group. Most importantly, Hras has three lipid modified side chains that ensure a roughly flat orientation and deeper insertion of the backbone into the glycerol region (24).
Conclusions
A major aim of this work was to understand how the farnesylated and polycationic membrane anchor of the oncogenic signaling protein Kras attaches to the inner leaflet of the plasma membrane. We found that on average, a total of ∼7.5 HBs (3.5 with POPC and 4 with POPG), together with vdW contacts between the farnesyl and the phospholipid hydrocarbon tails, tether the Kras anchor to the bilayer. Only five of the eight lysine residues directly interact with phospholipid headgroups, and the majority of these interact with the negatively charged POPG. This preferential interaction leads to clustering of POPG lipids around the Kras anchor, which in turn stabilizes the extended pseudohelical structure of the backbone. The thickness of the bilayer near these clusters is smaller than the thickness of the whole bilayer or, equivalently, the thickness of a peptide-free bilayer of the same size. Considering the sequence diversity at the membrane-interacting region of Ras proteins, we speculate that the Kras/POPG microclusters found in this work are likely distinct from membrane complexes of other Ras proteins, and may thus play a major role in specifying function.
Acknowledgments
We thank the Texas Advanced Computing Center for providing computational resources, and the anonymous reviewers for their constructive comments on peptide-lipid clustering.
This study was supported by the University of Texas Medical School-Houston.
Supporting Material
References
- 1.Resh M.D. Trafficking and signaling by fatty-acylated and prenylated proteins. Nat. Chem. Biol. 2006;2:584–590. doi: 10.1038/nchembio834. [DOI] [PubMed] [Google Scholar]
- 2.Casey P.J. Protein lipidation in cell signaling. Science. 1995;268:221–225. doi: 10.1126/science.7716512. [DOI] [PubMed] [Google Scholar]
- 3.Hancock J.F., Magee A.I., Marshall C.J. All ras proteins are polyisoprenylated but only some are palmitoylated. Cell. 1989;57:1167–1177. doi: 10.1016/0092-8674(89)90054-8. [DOI] [PubMed] [Google Scholar]
- 4.Silvius J.R. Mechanisms of Ras protein targeting in mammalian cells. J. Membr. Biol. 2002;190:83–92. doi: 10.1007/s00232-002-1026-4. [DOI] [PubMed] [Google Scholar]
- 5.Karnoub A.E., Weinberg R.A. Ras oncogenes: split personalities. Nat. Rev. Mol. Cell Biol. 2008;9:517–531. doi: 10.1038/nrm2438. [DOI] [PMC free article] [PubMed] [Google Scholar]
- 6.Gorfe A.A., Grant B.J., McCammon J.A. Mapping the nucleotide and isoform-dependent structural and dynamical features of Ras proteins. Structure. 2008;16:885–896. doi: 10.1016/j.str.2008.03.009. [DOI] [PMC free article] [PubMed] [Google Scholar]
- 7.Gorfe A.A. Mechanisms of allostery and membrane attachment in Ras GTPases: implications for anti-cancer drug discovery. Curr. Med. Chem. 2010;17:1–9. doi: 10.2174/092986710789957832. [DOI] [PubMed] [Google Scholar]
- 8.Abankwa D., Gorfe A.A., Hancock J.F. Ras nanoclusters: molecular structure and assembly. Semin. Cell Dev. Biol. 2007;18:599–607. doi: 10.1016/j.semcdb.2007.08.003. [DOI] [PMC free article] [PubMed] [Google Scholar]
- 9.Cirstea I.C., Kutsche K., Zenker M. A restricted spectrum of NRAS mutations causes Noonan syndrome. Nat. Genet. 2010;42:27–29. doi: 10.1038/ng.497. [DOI] [PMC free article] [PubMed] [Google Scholar]
- 10.Aoki Y., Niihori T., Matsubara Y. The RAS/MAPK syndromes: novel roles of the RAS pathway in human genetic disorders. Hum. Mutat. 2008;29:992–1006. doi: 10.1002/humu.20748. [DOI] [PubMed] [Google Scholar]
- 11.Aoki Y., Niihori T., Matsubara Y. Germline mutations in HRAS proto-oncogene cause Costello syndrome. Nat. Genet. 2005;37:1038–1040. doi: 10.1038/ng1641. [DOI] [PubMed] [Google Scholar]
- 12.Tidyman W.E., Rauen K.A. Noonan, Costello and cardio-facio-cutaneous syndromes: dysregulation of the Ras-MAPK pathway. Expert Rev. Mol. Med. 2008;10:e37. doi: 10.1017/S1462399408000902. [DOI] [PubMed] [Google Scholar]
- 13.van der Burgt I., Kupsky W., Zenker M. Myopathy caused by HRAS germline mutations: implications for disturbed myogenic differentiation in the presence of constitutive HRas activation. J. Med. Genet. 2007;44:459–462. doi: 10.1136/jmg.2007.049270. [DOI] [PMC free article] [PubMed] [Google Scholar]
- 14.Kratz C.P., Niemeyer C.M., Zenker M. An unexpected new role of mutant Ras: perturbation of human embryonic development. J. Mol. Med. 2007;85:227–235. doi: 10.1007/s00109-006-0135-4. [DOI] [PMC free article] [PubMed] [Google Scholar]
- 15.Schubbert S., Bollag G., Shannon K. Deregulated Ras signaling in developmental disorders: new tricks for an old dog. Curr. Opin. Genet. Dev. 2007;17:15–22. doi: 10.1016/j.gde.2006.12.004. [DOI] [PubMed] [Google Scholar]
- 16.Abankwa D., Hanzal-Bayer M., Hancock J.F. A novel switch region regulates H-ras membrane orientation and signal output. EMBO J. 2008;27:727–735. doi: 10.1038/emboj.2008.10. [DOI] [PMC free article] [PubMed] [Google Scholar]
- 17.Harding A., Hancock J.F. Ras nanoclusters: combining digital and analog signaling. Cell Cycle. 2008;7:127–134. doi: 10.4161/cc.7.2.5237. [DOI] [PMC free article] [PubMed] [Google Scholar]
- 18.Gorfe A.A., Hanzal-Bayer M., McCammon J.A. Structure and dynamics of the full-length lipid-modified H-Ras protein in a 1,2-dimyristoylglycero-3-phosphocholine bilayer. J. Med. Chem. 2007;50:674–684. doi: 10.1021/jm061053f. [DOI] [PubMed] [Google Scholar]
- 19.Rotblat B., Prior I.A., Hancock J.F. Three separable domains regulate GTP-dependent association of H-ras with the plasma membrane. Mol. Cell. Biol. 2004;24:6799–6810. doi: 10.1128/MCB.24.15.6799-6810.2004. [DOI] [PMC free article] [PubMed] [Google Scholar]
- 20.Hancock J.F. Ras proteins: different signals from different locations. Nat. Rev. 2003;4:373–384. doi: 10.1038/nrm1105. [DOI] [PubMed] [Google Scholar]
- 21.Apolloni A., Prior I.A., Hancock J.F. H-ras but not K-ras traffics to the plasma membrane through the exocytic pathway. Mol. Cell. Biol. 2000;20:2475–2487. doi: 10.1128/mcb.20.7.2475-2487.2000. [DOI] [PMC free article] [PubMed] [Google Scholar]
- 22.Gorfe A.A., McCammon J.A. Similar membrane affinity of mono- and Di-S-acylated ras membrane anchors: a new twist in the role of protein lipidation. J. Am. Chem. Soc. 2008;130:12624–12625. doi: 10.1021/ja805110q. [DOI] [PMC free article] [PubMed] [Google Scholar]
- 23.Gorfe A.A., Baron R., McCammon J.A. Water-membrane partition thermodynamics of an amphiphilic lipopeptide: an enthalpy-driven hydrophobic effect. Biophys. J. 2008;95:3269–3277. doi: 10.1529/biophysj.108.136481. [DOI] [PMC free article] [PubMed] [Google Scholar]
- 24.Gorfe A.A., Babakhani A., McCammon J.A. H-ras protein in a bilayer: interaction and structure perturbation. J. Am. Chem. Soc. 2007;129:12280–12286. doi: 10.1021/ja073949v. [DOI] [PMC free article] [PubMed] [Google Scholar]
- 25.Gorfe A.A., Babakhani A., McCammon J.A. Free energy profile of H-ras membrane anchor upon membrane insertion. Angew. Chem. Int. Ed. Engl. 2007;46:8234–8237. doi: 10.1002/anie.200702379. [DOI] [PMC free article] [PubMed] [Google Scholar]
- 26.Gorfe A.A., Pellarin R., Caflisch A. Membrane localization and flexibility of a lipidated ras peptide studied by molecular dynamics simulations. J. Am. Chem. Soc. 2004;126:15277–15286. doi: 10.1021/ja046607n. [DOI] [PubMed] [Google Scholar]
- 27.Brunsveld L., Waldmann H., Huster D. Membrane binding of lipidated Ras peptides and proteins—the structural point of view. Biochim. Biophys. Acta. 2009;1788:273–288. doi: 10.1016/j.bbamem.2008.08.006. [DOI] [PubMed] [Google Scholar]
- 28.Vogel A., Tan K.T., Huster D. Flexibility of ras lipid modifications studied by 2H solid-state NMR and molecular dynamics simulations. Biophys. J. 2007;93:2697–2712. doi: 10.1529/biophysj.107.104562. [DOI] [PMC free article] [PubMed] [Google Scholar]
- 29.Reuther G., Tan K.T., Huster D. The lipidated membrane anchor of full length N-Ras protein shows an extensive dynamics as revealed by solid-state NMR spectroscopy. J. Am. Chem. Soc. 2006;128:13840–13846. doi: 10.1021/ja063635s. [DOI] [PubMed] [Google Scholar]
- 30.Reuther G., Tan K.T., Huster D. Structural model of the membrane-bound C terminus of lipid-modified human N-ras protein. Angew. Chem. Int. Ed. Engl. 2006;45:5387–5390. doi: 10.1002/anie.200504266. [DOI] [PubMed] [Google Scholar]
- 31.Vogel A., Katzka C.P., Huster D. Lipid modifications of a Ras peptide exhibit altered packing and mobility versus host membrane as detected by 2H solid-state NMR. J. Am. Chem. Soc. 2005;127:12263–12272. doi: 10.1021/ja051856c. [DOI] [PubMed] [Google Scholar]
- 32.Huster D., Vogel A., Arnold K. Membrane insertion of a lipidated ras peptide studied by FTIR, solid-state NMR, and neutron diffraction spectroscopy. J. Am. Chem. Soc. 2003;125:4070–4079. doi: 10.1021/ja0289245. [DOI] [PubMed] [Google Scholar]
- 33.Fivaz M., Meyer T. Reversible intracellular translocation of KRas but not HRas in hippocampal neurons regulated by Ca2+/calmodulin. J. Cell Biol. 2005;170:429–441. doi: 10.1083/jcb.200409157. [DOI] [PMC free article] [PubMed] [Google Scholar]
- 34.Klauda J.B., Venable R.M., Pastor R.W. Update of the CHARMM all-atom additive force field for lipids: validation on six lipid types. J. Phys. Chem. B. 2010;114:7830–7843. doi: 10.1021/jp101759q. [DOI] [PMC free article] [PubMed] [Google Scholar]
- 35.Janosi L., Gorfe A.A. Simulating POPC and POPC/POPG bilayers: conserved packing and altered surface reactivity. 2010. J. Chem. Theory Comput. 2010;6:3267–3273. doi: 10.1021/ct100381g. [DOI] [PubMed] [Google Scholar]
- 36.Phillips J.C., Braun R., Schulten K. Scalable molecular dynamics with NAMD. J. Comput. Chem. 2005;26:1781–1802. doi: 10.1002/jcc.20289. [DOI] [PMC free article] [PubMed] [Google Scholar]
- 37.Humphrey W., Dalke A., Schulten K. VMD: visual molecular dynamics. J. Mol. Graph. 1996;14:33–38. doi: 10.1016/0263-7855(96)00018-5. 27–38. [DOI] [PubMed] [Google Scholar]
- 38.MacKerell A.D., Bashford D., Karplus M. All-atom empirical potential for molecular modeling and dynamics studies of proteins. J. Phys. Chem. B. 1998;102:3586–3616. doi: 10.1021/jp973084f. [DOI] [PubMed] [Google Scholar]
- 39.Shea J.E., Brooks C.L., 3rd From folding theories to folding proteins: a review and assessment of simulation studies of protein folding and unfolding. Annu. Rev. Phys. Chem. 2001;52:499–535. doi: 10.1146/annurev.physchem.52.1.499. [DOI] [PubMed] [Google Scholar]
- 40.Clark P.L. Protein folding in the cell: reshaping the folding funnel. Trends Biochem. Sci. 2004;29:527–534. doi: 10.1016/j.tibs.2004.08.008. [DOI] [PubMed] [Google Scholar]
- 41.Gambhir A., Hangyás-Mihályné G., McLaughlin S. Electrostatic sequestration of PIP2 on phospholipid membranes by basic/aromatic regions of proteins. Biophys. J. 2004;86:2188–2207. doi: 10.1016/S0006-3495(04)74278-2. [DOI] [PMC free article] [PubMed] [Google Scholar]
- 42.Wang J., Gambhir A., Murray D. A computational model for the electrostatic sequestration of PI(4,5)P2 by membrane-adsorbed basic peptides. Biophys. J. 2004;86:1969–1986. doi: 10.1016/S0006-3495(04)74260-5. [DOI] [PMC free article] [PubMed] [Google Scholar]
- 43.Ellena J.F., Burnitz M.C., Cafiso D.S. Location of the myristoylated alanine-rich C-kinase substrate (MARCKS) effector domain in negatively charged phospholipid bicelles. Biophys. J. 2003;85:2442–2448. doi: 10.1016/s0006-3495(03)74667-0. [DOI] [PMC free article] [PubMed] [Google Scholar]
- 44.Wang J., Gambhir A., McLaughlin S. Lateral sequestration of phosphatidylinositol 4,5-bisphosphate by the basic effector domain of myristoylated alanine-rich C kinase substrate is due to nonspecific electrostatic interactions. J. Biol. Chem. 2002;277:34401–34412. doi: 10.1074/jbc.M203954200. [DOI] [PubMed] [Google Scholar]
- 45.Arbuzova A., Wang L., McLaughlin S. Membrane binding of peptides containing both basic and aromatic residues. Experimental studies with peptides corresponding to the scaffolding region of caveolin and the effector region of MARCKS. Biochemistry. 2000;39:10330–10339. doi: 10.1021/bi001039j. [DOI] [PubMed] [Google Scholar]
- 46.Laux T., Fukami K., Caroni P. GAP43, MARCKS, and CAP23 modulate PI(4,5)P(2) at plasmalemmal rafts, and regulate cell cortex actin dynamics through a common mechanism. J. Cell Biol. 2000;149:1455–1472. doi: 10.1083/jcb.149.7.1455. [DOI] [PMC free article] [PubMed] [Google Scholar]
- 47.Denisov G., Wanaski S., McLaughlin S. Binding of basic peptides to membranes produces lateral domains enriched in the acidic lipids phosphatidylserine and phosphatidylinositol 4,5-bisphosphate: an electrostatic model and experimental results. Biophys. J. 1998;74:731–744. doi: 10.1016/S0006-3495(98)73998-0. [DOI] [PMC free article] [PubMed] [Google Scholar]
- 48.Victor K., Jacob J., Cafiso D.S. Interactions controlling the membrane binding of basic protein domains: phenylalanine and the attachment of the myristoylated alanine-rich C-kinase substrate protein to interfaces. Biochemistry. 1999;38:12527–12536. doi: 10.1021/bi990847b. [DOI] [PubMed] [Google Scholar]
- 49.Huang H., Cafiso D.S. Conformation and membrane position of the region linking the two C2 domains in synaptotagmin 1 by site-directed spin labeling. Biochemistry. 2008;47:12380–12388. doi: 10.1021/bi801470m. [DOI] [PMC free article] [PubMed] [Google Scholar]
- 50.Williams C.L. The polybasic region of Ras and Rho family small GTPases: a regulator of protein interactions and membrane association and a site of nuclear localization signal sequences. Cell. Signal. 2003;15:1071–1080. doi: 10.1016/s0898-6568(03)00098-6. [DOI] [PubMed] [Google Scholar]
- 51.Saad J.S., Miller J., Summers M.F. Structural basis for targeting HIV-1 Gag proteins to the plasma membrane for virus assembly. Proc. Natl. Acad. Sci. USA. 2006;103:11364–11369. doi: 10.1073/pnas.0602818103. [DOI] [PMC free article] [PubMed] [Google Scholar]
- 52.Vogel A., Reuther G., Huster D. Backbone conformational flexibility of the lipid modified membrane anchor of the human N-Ras protein investigated by solid-state NMR and molecular dynamics simulation. Biochim. Biophys. Acta. 2010;1798:275–285. doi: 10.1016/j.bbamem.2009.09.023. [DOI] [PubMed] [Google Scholar]
- 53.Huang H.W. Molecular mechanism of antimicrobial peptides: the origin of cooperativity. Biochim. Biophys. Acta. 2006;1758:1292–1302. doi: 10.1016/j.bbamem.2006.02.001. [DOI] [PubMed] [Google Scholar]
- 54.Jang H., Ma B., Nussinov R. Interaction of protegrin-1 with lipid bilayers: membrane thinning effect. Biophys. J. 2006;91:2848–2859. doi: 10.1529/biophysj.106.084046. [DOI] [PMC free article] [PubMed] [Google Scholar]
- 55.Mecke A., Lee D.K., Banaszak Holl M.M. Membrane thinning due to antimicrobial peptide binding: an atomic force microscopy study of MSI-78 in lipid bilayers. Biophys. J. 2005;89:4043–4050. doi: 10.1529/biophysj.105.062596. [DOI] [PMC free article] [PubMed] [Google Scholar]
- 56.Sato H., Feix J.B. Peptide-membrane interactions and mechanisms of membrane destruction by amphipathic alpha-helical antimicrobial peptides. Biochim. Biophys. Acta. 2006;1758:1245–1256. doi: 10.1016/j.bbamem.2006.02.021. [DOI] [PubMed] [Google Scholar]
- 57.Hung W.C., Chen F.Y., Huang H.W. Membrane-thinning effect of curcumin. Biophys. J. 2008;94:4331–4338. doi: 10.1529/biophysj.107.126888. [DOI] [PMC free article] [PubMed] [Google Scholar]
Associated Data
This section collects any data citations, data availability statements, or supplementary materials included in this article.