

Abstract
BACKGROUND AND PURPOSE
Lithocholic acid (LCA), the most toxic bile acid, induces cholestatic liver injury in rodents. We previously showed that LCA activates the oxidative stress-responsive nuclear factor (erythroid-2 like), factor 2 (Nrf2) in cultured liver cells, triggering adaptive responses that reduce cell injury. In this study, we determined whether Nrf2 protects the liver against LCA-induced toxicity in vivo.
EXPERIMENTAL APPROACH
Nrf2 disrupted (Nrf2−/−) and wild-type mice were treated with LCA (125 mg·kg−1 body weight) to induce liver injury. Levels of mRNA, protein and function of important Nrf2 target genes coupled with liver histology and injury biomarkers of mice were examined.
KEY RESULTS
In 4 day LCA treatments, we observed a significantly higher hepatic induction of Nrf2 target, cytoprotective genes including thioredoxin reductase 1, glutamate cysteine ligase subunits, glutathione S-transferases, haeme oxygenase-1 and multidrug resistance-associated proteins 3 and 4 in the wild type as compared with the Nrf2−/− mice. Moreover, basal and LCA-induced hepatic glutathione and activities of glutathione S-transferases and thioredoxin reductases were higher in wild-type than in Nrf2−/− mice. This reduced production of cytoprotective genes against LCA toxicity rendered Nrf2−/− mice more susceptible to severe liver damage with the presence of multifocal liver necrosis, inflamed bile ducts and elevation of lipid peroxidation and liver injury biomarkers, such as alanine aminotransferase and alkaline phosphatase.
CONCLUSIONS AND IMPLICATIONS
Nrf2 plays a crucial cytoprotective role against LCA-induced liver injury by orchestrating adaptive responses. The pharmacological potential of targeting liver Nrf2 in the management of cholestatic liver diseases is proposed.
Keywords: Nrf2, lithocholic acid, oxidative stress, lipid peroxidation, cholestasis, liver injury, glutathione, glutathione S-transferases, thioredoxin reductase 1, haeme oxygenase-1, ATP-binding cassette transporters
Introduction
Nuclear factor (erythroid 2-related) factor 2 (Nrf2) is the chief oxidative stress-responsive transcription factor that up-regulates a wide spectrum of cytoprotective genes through its cognate enhancer antioxidant response element. Among the important Nrf2 target genes are the rate-limiting enzymes in glutathione (GSH) biosynthesis: glutamate cysteine ligase modulatory (Gclm) and catalytic subunits (Gclc), glutathione S-transferases (GSTs), NAD(P)H:quinone oxidoreductase 1 (Nqo1), haeme oxygenase-1 (Ho1), thioredoxin reductase 1 (TRx1) and the phase 3 membrane efflux transporters such as the ATP-binding cassette C2 [Abcc2 or multidrug resistance-associated protein 2 (Mrp2)], Abcc3 (Mrp3) and Abcc4 (Mrp4). These cytoprotective genes possess essential roles in maintenance of cellular redox balance and, hence, cell survival during oxidative insults (Kensler et al., 2007; Maher et al., 2007; Nguyen et al., 2009).
Impaired hepatic bile flow can lead to excessive accumulation of toxic bile acids in the liver cells, causing cholestasis and liver injury. We have shown that exposure of human hepatoma cells to toxic levels of bile acids, particularly lithocholic acid (LCA), activates liver Nrf2 and up-regulates a panel of antioxidant genes (Tan et al., 2007). LCA is a highly toxic secondary bile acid produced by the bacterial 7 α-dehydroxylation of chenodeoxycholic acid in the intestine. Elevated circulating levels of LCA have been reported in patients with chronic cholestatic liver disease (Fischer et al., 1996). Administration of LCA to rodents can cause liver injury characteristic of cholestatic liver diseases with concurrent occurrence of obstructive bile ducts and cholangitis (Fickert et al., 2006). Hence, as an alternative to the bile-duct ligation (BDL) procedure, LCA treatment in rodents has been widely used as a model to study the role of toxic bile acids in the pathogenesis of cholestatic liver damage (Staudinger et al., 2001; Xie et al., 2001; Fickert et al., 2006).
In our previous studies, Nrf2 silencing in hepatoma cells by means of small-interfering RNA led to aggravated LCA-induced apoptosis and necrosis (Tan et al., 2007). This finding confirms Nrf2-mediated adaptive defense mechanism as a key component of combating liver injury during cholestasis. Despite convincing findings from cell culture studies, the protective role of Nrf2 against bile acid toxicity in vivo was not evident in a study utilizing BDL procedure on the Nrf2 disrupted mice (Aleksunes et al., 2006). In the latter study, the BDL procedure paradoxically caused more severe liver injury in the wild-type mice than the Nrf2−/− mice. Puzzling observations have also revealed that the livers of Nrf2−/− mice had reduced levels of bile acids at the basal and post-BDL stages. This suggests a possible biological adaptation event of these mice to reduce bile acid biosynthesis following Nrf2 gene knockout. With this difference inherent in bile acid biosynthesis, the BDL model, which relies on endogenous bile acids to induce cholestatic liver injury, may not be ideal for examining the role of Nrf2 in bile acid toxicity.
In the present study, the cytoprotective role of Nrf2 in cholestatic liver injury was compared between the wild-type and Nrf2 disrupted mice using LCA as the exogenous cholestatic agent. Administration of LCA has been shown previously to increase nuclear accumulation of Nrf2 accompanied by an induction of various Nrf2 target genes (Tan et al., 2007). Whether this induction of Nrf2 target genes confers cytoprotection against LCA-induced liver injury was therefore determined in this study.
Methods
Chemicals and mouse experiments
All chemicals and reagents were purchased from Sigma-Alrich (St. Louis, MO, USA), unless otherwise indicated. The animal protocol, use and care were approved by the Animal Care Committee of the University of Toronto and were in accordance with the guide to the care and use of experimental animals by Canadian Council on Animal Care. The Nrf2−/− mice of ICR/CD-1 background (Riken, Japan) (Itoh et al., 1997) were mated with CD-1 mice (Charles Rivers, Montreal, QC, Canada) to generate heterozygous Nrf2+/− mice (a gift from Dr P. Wells, University of Toronto, Toronto, ON with permission from Dr M. Yamamoto, Tohoku University, Sendai, Japan). The heterozygous colonies were back-crossbred for >4 generations prior to experiments. All mice were housed at an ambient temperature of 22–25°C, 12 h light/dark daily circle, and fed, ad libitum, a standard animal chow and clean water. The mice, at 9–11 weeks old, were subjected to acute (125 mg·kg−1 body wt. LCA given as i.p. injection for 8 h) or extended (same dose as that for the acute treatment but twice daily for 4 days) treatment protocols along with an equivalent volume of solvent control vehicles (Staudinger et al., 2001; Tan et al., 2007). Mice were killed 17–20 h after the last dose by isoflurane inhalation, cardiac blood sampling and cervical dislocation. This was done between 09.00 h and12.00 h to minimize circadian effects. At necropsy, the median lobe of their livers was excised for mRNA, protein and function analyses, whereas the left lobes were fixed in neutral-buffered 10% formaldehyde for histological tissue preparation. The nomenclature of the transporters presented in this paper conforms to BJP's Guide to Receptors and Channels (Alexander et al., 2009).
Quantitative reverse-transcription PCR (qRT-PCR)
RNA extraction, reverse transcription to cDNA, qRT-PCR and the ΔΔCt method to quantify relative fold difference of gene transcripts calibrated by internal control genes (TATA-box binding protein and/or glyceraldehyde-3-phosphate dehydrogenase) between control and treatments were performed (Tan et al., 2007). Primer sequences for real-time PCR are listed in Table 1.
Table 1.
Primer sequences for qRT-PCR
| Mouse genes (accession#) | Sequence (sense and antisense)/*ABI Assay-on-demand Taqman primer and probe sets (catalogue#) |
|---|---|
| Abcg2/Bcrp1 (NM_011920) | 5′-GCGGAGGCAAGTCTTCGTTG-3′ |
| 5′-GTGCCCATCACAACGTCATC-3′ | |
| Abcb11/Bsep1(NM_021022) | 5′-ACGGAACAAGCTGTGGGTTG-3′ |
| 5′-AAACCATCCGATTTCCATTCTC-3′ | |
| Gapdh (NM_001001303) | Mm99999915_g1* |
| Gclm (NM_008129) | 5′-CGAGGAGCTTCGGGACTGT-3′ |
| 5′-CATGCCATGTCAACTGCAC-3′ | |
| Gclc (NM_010295) | 5′-GGGTGACGAGGTGGAGTACA-3′ |
| 5′-AGGCGTTCCTTCGATCATGT-3′ | |
| Gstm1 (NM_010358) | 5′-GAAAGCACCACCTGGATGGA-3′ |
| 5′-CTCTTGCCCAGGAACTCAGA-3′ | |
| Gsta1&2 (NM_008181) (NM_008182) | 5′-GACATGAAGGAGAGAGCCCTGA-3′ |
| 5′-CCATGGCTCTTCAACACCTT-3′ | |
| Gsta4 (NM_010357) | 5′-TGCGGCTGGAGTGGAGTTTG-3′ |
| 5′-TGTGTCAGCATCATCCCATC-3′ | |
| Gstp1 (NM_013541) | 5′-GCATGCCACCATACACCATTG-3′ |
| 5′-CATACAGACAAGTGGGCTTGA-3′ | |
| Ho1 (NM_010442) | 5′-GCTAGCCTGGTGCAAGATACTG-3′ |
| 5′-CACATTGGACAGAGTTCACAGC-3′ | |
| Abcb1a/Mdr1a (NM_013454) | 5′-GCTTGCAGATACCATACAGAAATG-3′ |
| 5′-GTAGGCACCGAACCGGAAAC-3′ | |
| Abcb1b/Mdr1b (NM_011075) | 5′-CTTGAGATCTCTGGGAAGATTGC-3′ |
| 5′-TGGCCTGGGTGAAGGAGAAC-3′ | |
| Abcc1/Mrp1 (NM_008576) | 5′-AGGGTGGAGAAAAGGTGGGTA-3′ |
| 5′-CGATCTTGGCGATGTTGACC-3′ | |
| Abcc2/Mrp2 (NM_013806) | 5′-ACTCAACACACGCCCCATCA-3′ |
| 5′-TGATCGTCTTAAACTTGCTGGTGA-3′ | |
| Abcc3/Mrp3 (NM_029600) | 5′-GGGCTCCAAGTTCTGGGAC-3′ |
| 5′-CCGTCTTGAGCCTGGATAAC-3′ | |
| Abcc4/Mrp4 (NM_001033336) | 5′-AGCTTCAACGGTACTGGGATA-3′ |
| 5′-TCGTCGGGGTCATACTTCTC-3′ | |
| Abcc5/Mrp5 (NM_013790) | 5′-TTATCCAGCAATGATGTTCGTGTC-3′ |
| 5′-CGCTTTGACCCAGGCATACA-3′ | |
| Nqo1 (NM_008706) | 5′-TGGCCGATTCAGAGTGGCATC-3′ |
| 5′-CTCCCAGACGGTTTCCAGAC-3′ | |
| Nrf2 (NM_010902) | 5′-CCAGCTACTCCCAGGTTGC-3′ |
| 5′-TGAGGGGCAGTGAAGACTGA-3′ | |
| Ntcp (NM_011387) | 5′-GGACATGAACCTCAGCATTGTG-3′ |
| 5′-CTTTGTAGGGCACCTTGTCCTT-3′ | |
| Tbp (NM_013684) | Mm00446973_m1* |
| Trx1 (NM_001042523) | 5′-TACGCAATCTGAGCTGCCGAAC-3′ |
| 5′-CTCCTTAGCTGCTGCCAGTC-3′ |
Abc, ATP-binding cassette; Gclc, glutamate cysteine ligase catalytic subunit; Gclm, glutamate cysteine ligase modulatory subunit; Ho1, haeme oxygenase-1; Mdr1, multidrug resistance protein 1; Mrp, multidrug resistance-associated protein; Nrf2, nuclear factor (erythroid 2-related) factor 2; qRT-PCR, quantitative reverse-transcription PCR; Trx1, thioredoxin reductase 1.
Immunoblotting
Crude tissue homogenates were prepared for SDS-PAGE electrophoresis and immunoblotting as described (Tan et al., 2007). Primary antibodies with working concentration used were: mouse monoclonal anti-β-actin (1:10 000) (Sigma), goat polyclonal anti-Mrp2 (1:200) (Santa Cruz Biotechnology, Santa Cruz, CA, USA), goat polyclonal anti-Ho1 (1:500) (Santa Cruz), rabbit polyclonal anti-Trx1 (Abcam, Cambridge, MA, USA) (1:500) and rabbit polyclonal anti-glutamate cysteine ligase, catalytic subunit (Gclc) (1:500) (Thermo Scientific, Fremont, CA, USA). Densitometry of protein bands was measured with ImageJ (National Institute of Health).
Lipid hydroperoxide and antioxidant protein activities
Measurement of lipid hydroperoxide and total GSH levels of liver homogenates was conducted as described previously (Tan et al., 2007; 2008;). Trx activity of liver homogenates was measured based on its selective ability to reduce 5,5′-dithio-bis(2-dinitrobenzoic acid) (DTNB) to 5-thio-2-nitrobenzoid acid, which can be measured colorimetrically at λ = 405 nm, in the presence of NADPH (Gromer et al., 1998). To control for Trx-independent reduction of DTNB, a specific Trx inhibitor, aurothiomalate (30 µM) was included for all samples (Smith et al., 1999). The absorbance values from this inhibitor treatment were then subtracted from those without inhibitor cotreatment to ensure specific measurements of Trx activity. Total GSTs activities of liver homogenates were measured using the GST assay kit (Cayman Chemical, Ann Arbor, MI, USA) according to the manufacturer's instruction. This assay measures the GST-mediated conjugation rate of 1-chloro-2,4-dinitrobenzene in the presence of excess reduced GSH.
Liver histology and liver injury markers
Histological assessment of three representative haemotoxylin and eosin-stained cross-sections of each liver sample was carried out by a veterinary pathologist (GAW) in a blinded manner for severity and frequency of necrotic lesions using a pre-validated, semi-quantitative grading system: background (grade 0), mild (grade 1), moderate (grade 2) and extensive necrosis (grade 3). Sera were analysed for liver injury biomarkers: alanine aminotransferase (ALT) and alkaline phosphatase (ALP) by established automated methods (Tan et al., 2007). The sample size was calculated from the estimates of ALT variation (∼50% of the mean value), threefold increase of mean ALT level from 50 U·L−1 in LCA-treated wild-type to 150 U·L−1 in LCA-treated Nrf2−/− mice. Assuming β = 0.2, α = 0.05, seven mice per group was required. The experiments were conducted with at least eight mice in each group.
Statistical analyses
Results are expressed as means ± SEM or median ± quartile. Guided by normality and equal variance tests on data distributions of test variables, comparisons between two groups were done by Student's independent t-test (parametric) or the Mann–Whitney U-test (non-parametric). Because of apparent sex differences in the basal expression of some cytoprotective genes, relative gene expression levels were standardized within the same sex to those of the corn oil-treated Nrf2+/+ mice before aggregating them for statistical comparisons. P-values less than 0.05 were considered statistically significant.
Results
Altered hepatic expression of cytoprotective proteins in mice with disrupted Nrf2
The mean body weights of mice between genotypes at necropsy were in the range of 24 to 29 g and did not differ significantly after vehicle or LCA treatment. Hepatic expression profiles of two major groups of cytoprotective genes, that is, antioxidant enzymes and ABC transporters, known to be targets of Nrf2 and may serve crucial roles in cytoprotection against toxic bile acids were compared between Nrf2+/+ and Nrf2−/− mice. The basal expression (in the presence of corn oil vehicle) of a panel of antioxidant enzymes important in regulating cellular thiols, GSH and redox balances was significantly lower in Nrf2−/− mice compared with the wild-type mice (Table 2). In addition, the basal expression of ABC transporter genes, such as Mrp3, Mrp4, multidrug resistance protein 1 (Mdr1)a and Abcg2, were also repressed in Nrf2−/− mice (Table 2). In an inbred C57BL/6 strain, Nrf2 gene knockout also led to lower basal expression (treated with vehicle corn oil) of Mrp2 (Maher et al., 2007). To examine possible effects of vehicle corn oil, which is rich in potentially biologically active n-6 polyunsaturated fatty acids, a separate group of mice, matched for age, sex and weight, which received no treatment was included in gene expression comparison (Table S1). Comparative gene expression profiles of the Nrf2−/− mice, relative to the wild type, were similar in the untreated (Table S1) and corn oil vehicle-treated groups (Table 2), except for Mrp2 that was significantly lower in the untreated Nrf2−/− mice, and Abcg2 that in turn was significantly lower in the corn oil-treated Nrf2−/− mice. These observations indicate a possible modulatory role of the vehicle solvent, which may, to a certain extent, affect the expression of some transporter genes. It is noteworthy that the Nrf2−/− mice had significantly higher basal expression of Bsep1 but lower Ntcp than the wild-type mice (Table 2). Changes in expression of these important bile salt transporters suggest the possible occurrence of compensatory mechanisms in response to altered basal regulation of other ABC transporters following Nrf2 knockout. These observations were absent in human liver carcinoma cells subjected to transient Nrf2 knockdown by small-interfering RNA (K.P. Tan and S. Ito unpubl. data).
Table 2.
Hepatic gene expression of antioxidant enzymes and ABC efflux transporters after a 4 day treatment with vehicle (corn oil) or LCA in mice
| Corn oil vehicle | LCA | |||||
|---|---|---|---|---|---|---|
| Nrf2+/+ | Nrf2−/− | P-valuea | Nrf2+/+ | Nrf2−/− | P-valuea | |
| Antioxidant enzymes | ||||||
| Gclm | 1.00 ± 0.05 | 0.82 ± 0.06 | 0.024 | 1.96 ± 0.12 | 1.53 ± 0.10 | 0.016 |
| Gclc | 1.00 ± 0.08 | 0.55 ± 0.04 | <0.001 | 2.03 ± 0.13 | 1.07 ± 0.10 | <0.001 |
| Trx1 | 1.00 ± 0.05 | 1.09 ± 0.11 | 0.509 | 3.74 ± 0.57 | 1.39 ± 0.14 | <0.001 |
| Nqo1 | 1.00 ± 0.06 | 0.28 ± 0.06 | <0.001 | 2.83 ± 0.43 | 0.48 ± 0.08 | <0.001 |
| Ho1 | 1.00 ± 0.09 | 0.79 ± 0.06 | 0.007 | 3.35 ± 0.37 | 1.10 ± 0.15 | <0.001 |
| Gsta1/2 | 1.00 ± 0.11 | 0.45 ± 0.05 | <0.001 | 8.56 ± 1.44 | 0.70 ± 0.11 | <0.001 |
| Gsta4 | 1.00 ± 0.05 | 0.69 ± 0.04 | <0.001 | 2.65 ± 0.36 | 1.16 ± 0.10 | <0.001 |
| Gstm1 | 1.00 ± 0.05 | 0.37 ± 0.03 | <0.001 | 1.72 ± 0.07 | 0.57 ± 0.03 | <0.001 |
| Gstp1 | 1.00 ± 0.06 | 0.89 ± 0.08 | 0.239 | 1.15 ± 0.23 | 1.24 ± 0.18 | 0.157 |
| Transporters | ||||||
| Abcc1 (Mrp1) | 1.00 ± 0.05 | 1.02 ± 0.10 | 0.946 | 2.70 ± 0.31 | 1.54 ± 0.10 | 0.002 |
| Abcc2 (Mrp2) | 1.00 ± 0.03 | 0.96 ± 0.05 | 0.474 | 1.35 ± 0.09 | 0.89 ± 0.10 | 0.005 |
| Abcc3 (Mrp3) | 1.00 ± 0.07 | 0.17 ± 0.03 | <0.001 | 1.92 ± 0.16 | 0.33 ± 0.05 | <0.001 |
| Abcc4 (Mrp4) | 1.00 ± 0.08 | 0.55 ± 0.06 | <0.001 | 2.79 ± 0.27 | 0.82 ± 0.16 | <0.001 |
| Abcc5 (Mrp5) | 1.00 ± 0.05 | 0.99 ± 0.09 | 0.921 | 2.23 ± 0.34 | 0.97 ± 0.07 | 0.007 |
| Abcb1a (Mdr1a) | 1.00 ± 0.05 | 0.66 ± 0.12 | 0.004 | 14.45 ± 5.19 | 2.09 ± 0.74 | 0.017 |
| Abcb1b (Mdr1b) | 1.00 ± 0.07 | 1.14 ± 0.15 | 0.389 | 12.04 ± 6.65 | 1.60 ± 0.39 | 0.069 |
| Abcg2 (Bcrp1) | 1.00 ± 0.05 | 0.78 ± 0.09 | 0.032 | 1.47 ± 0.12 | 1.02 ± 0.10 | 0.013 |
| Abcb11 (Bsep1) | 1.00 ± 0.06 | 1.73 ± 0.08 | 0.005 | 2.13 ± 0.36 | 2.73 ± 0.22 | 0.059 |
| Ntcp | 1.00 ± 0.10 | 0.71 ± 0.05 | <0.001 | 0.56 ± 0.03 | 0.50 ± 0.03 | 0.064 |
Expression levels of each gene were standardized to mean mRNA levels in corn oil-treated Nrf2+/+ mice. LCA treatment (125 mg·kg−1 body wt.): LCA was administered twice daily for 4 days. Mean ± SEM (n = 8–12).
Pair-wise comparison between the genotypes within the respective treatment. Note that all genes within the Nrf2+/+ mice group are significantly different between corn oil and LCA except for Gstp1.
Abc, ATP-binding cassette; Gclc, glutamate cysteine ligase catalytic subunit; Gclm, glutamate cysteine ligase modulatory subunit; Ho1, haeme oxygenase-1; LCA, lithocholic acid; Mdr1, multidrug resistance protein 1; Mrp, multidrug resistance-associated protein; Nrf2, nuclear factor (erythroid 2-related) factor 2; Trx1, thioredoxin reductase 1.
Nrf2−/− mice had a lower hepatic expression of cytoprotective proteins upon LCA challenge
After the 4 day treatment with LCA, a coordinated increase of all antioxidant protein and transporter genes, except for Gstp1 and Ntcp, were noted in the wild-type Nrf2+/+ mice (Table 2). However, the response in mice with disrupted Nrf2 was significantly less than that in the wild-type mice. Ntcp mRNA was significantly reduced by LCA treatment. The induction of most antioxidant enzyme and transporter genes had already occurred as early as 8 h after the LCA treatment (Table S2), at a time when any symptoms suggestive of liver damage, histological and biochemical evidence, was still absent (data not shown). This implies that induction of Nrf2-dependent cytoprotective genes is as an early response to LCA toxicity.
Reduced hepatic antioxidant activities in Nrf2−/− mice exposed to LCA treatment
The results from the immunoblot analysis show that changes in mRNA levels of cytoprotective genes largely parallel changes in protein expression (Figure 1A,B). In particular, protein levels of the known Nrf2 target genes such as Gclc, Trx1, Ho1 and Mrp2 were quantitatively lower by more than twofold in the Nrf2−/− mice than those of the wild type after LCA treatment. Indeed, protein levels of Gclc, Ho1 and Mrp2 at the basal level (vehicle treatment) were 1.5–2-fold lower in mice with disrupted Nrf2. A difference in the LCA-induced Mrp2 protein levels between the wild-type and the Nrf2−/− mice was much higher (approximately fivefold) than that of mRNA (∼1.6-fold). This may indicate the presence of Nrf2-dependent post-translational regulations of this transporter.
Figure 1.
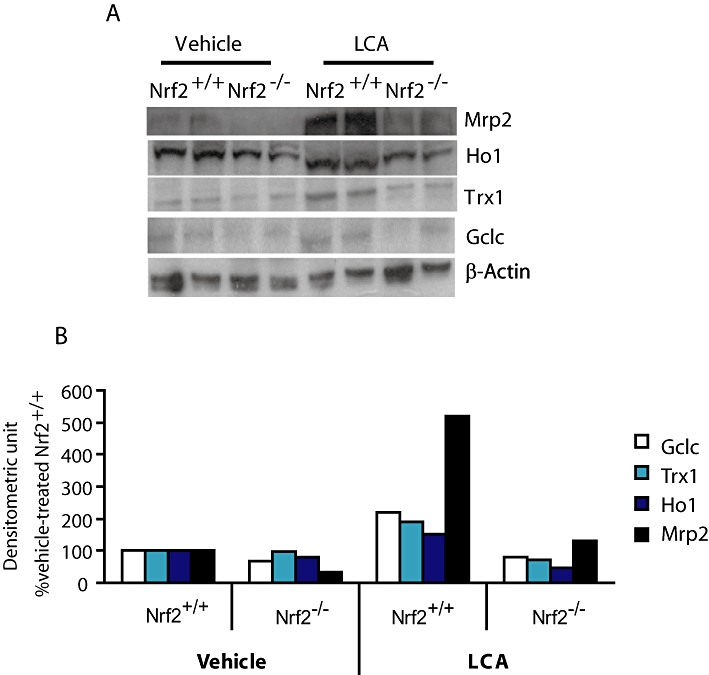
Basal and LCA-induced expression of antioxidant and transporter proteins was suppressed in Nrf2 disrupted mice. (A) Representative immunoblot images of cytoprotective and antioxidant proteins (50 µg per lane) for Nrf2+/+ and Nrf2−/− mice administered vehicle corn oil or LCA (125 mg·kg−1 body wt. twice daily for 4 days). (B) Densitometric measurement of protein abundance of gel images from (A). Repeated analysis of other liver samples yielded similar results. β-Actin was used as equal protein loading control and denominator adjuster for all target proteins; mean values of two representative images. Gclc, glutamate cysteine ligase catalytic subunit; Ho1, haeme oxygenase-1; LCA, lithocholic acid; Mrp, multidrug resistance-associated protein; Nrf2, nuclear factor (erythroid 2-related) factor 2; Trx1, thioredoxin reductase 1.
We next determined whether the reduction in mRNA and/or protein levels of the antioxidant enzymes observed would have led to significant activity changes that could be detected by validated functional assays. After LCA treatment, total hepatic GSH and Trx and GST activities were significantly lower, by 1.5–2-fold, in the Nrf2−/− mice compared with the wild-type mice (Figure 2). In the vehicle-treated groups, mice with disrupted Nrf2 also showed significantly lower hepatic GSH and GST activities, consistent with lower Gclc/Gclm and GSTs gene transcripts respectively. However, the increase in GST activities of the wild-type mice after LCA treatment was modest (∼25%) relative to the marked increase (twofold to eightfold) observed from gene expression analysis of multiple GST subtypes (Table 2). However, the possibility that the GST assay utilized in this study may not be able to analyse activities of all GST isoform at equal efficiency cannot be ruled out. Reliable antibodies to detect distinct subtypes of GST are not available, therefore, the decreased activity of GST observed here may not reflect the exact levels of protein expression.
Figure 2.
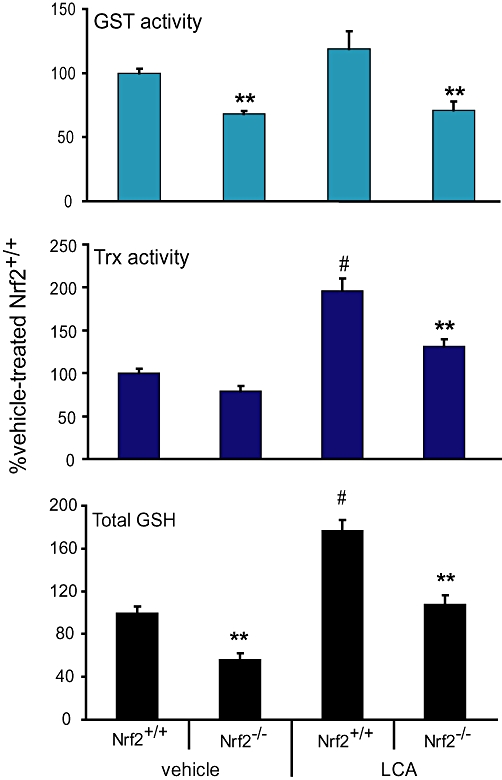
Nrf2 disruption led to decreased antioxidant protein activities upon LCA challenge in mice. Total hepatic GSH levels (lower panel), Trx (middle panel) and GST (upper panel) activities of mice treated with vehicle or LCA (125 mg·kg−1 body wt. twice daily for 4 days). Mean ± SEM: n = 6–8. **P < 0.01 from Nrf2+/+ mice within vehicle or LCA treatment group; #P < 0.01 from Nrf2+/+ mice administered vehicle control; n = 6–8. GSH, glutathione; GST, glutathione S-transferase; LCA, lithocholic acid; Nrf2, nuclear factor (erythroid 2-related) factor 2; Trx1, thioredoxin reductase 1.
Evidence of increased sensitivity of Nrf2−/− mice to LCA-induced hepatic injury
Nrf2−/− mice following 4 day LCA treatment had significantly more severe multifocal liver necrosis than did the wild-type mice. This was accompanied by inflammation of the bile ducts, characterized by inflammatory cells surrounding ducts and present within the lumen. Necrosis of the ductal epithelium was also noted more frequently in mice with disrupted Nrf2 (Figure 3A). Serum ALT was higher in the Nrf2−/− mice administered LCA than the wild type (Figure 3C), although statistical significance was not reached due to a higher attrition rate than expected. Serum ALP, which is produced by injured bile canaliculi during cholestasis, was also significantly elevated in Nrf2−/− mice administered LCA (Figure 3C), consistent with pathological evidence of inflamed bile ducts. To relate the severity of liver injury to oxidative stress state, we found that the liver lipid peroxidation occurring in the Nrf2−/− mice treated with LCA was significantly higher than that in the wild-type mice (Figure 3D). Taken together, our findings provide in vivo evidence of a heightened susceptibility of mice with disrupted Nrf2 to LCA-induced liver damage.
Figure 3.
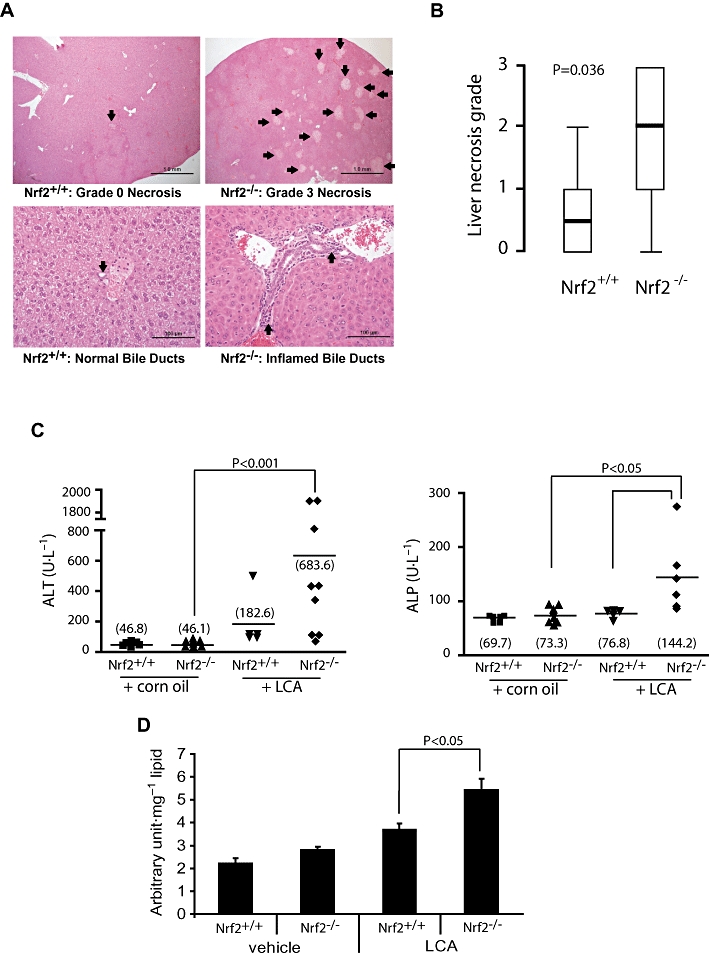
Heightened sensitivity of Nrf2−/− mice to LCA-induced liver injury. (A) Representative haematoxylin and eosin-stained liver sections from LCA-treated mice (125 mg·kg−1 body wt. twice daily for 4 days). Upper panel shows liver histology with arrows pointing to necrotic foci. Arrows on the lower panel shows representative bile ducts. (B) Comparison of liver necrosis grade between the Nrf2+/+ (n = 8) and Nrf2−/− mice (n = 10). Values are shown as box-and-whisker plots with median (thick horizontal bar), inter-quartile ranges (box) and extreme values (whisker). Non-parametric comparison was applied using the Mann–Whitney U-test. (C) Serum ALT and serum ALP (right) of mice treated for 4 days with LCA or vehicle corn oil. The group means are shown as horizontal bars with the actual values in parentheses. Statistical analysis was by the Mann–Whitney U-test. (D) Analysis of hepatic lipid hydroperoxide levels in corn oil- (vehicle) and LCA- (4 day treatment, see above) treated mice. Data shown are means ± SEM; Student's independent t-test was used for statistical comparisons. ALP, alkaline phosphatase; ALT, alanine transferase; LCA, lithocholic acid; Nrf2, nuclear factor (erythroid 2-related) factor 2.
Discussion and conclusions
There is considerable evidence suggesting that the degree of liver damage due to cholestatic liver diseases in humans is causally associated with the extent of intrahepatic oxidative stress (Tsai et al., 1993; Bomzon et al., 1997; Ono et al., 1997). Studies of experimental cholestasis in rats have revealed a systemic phenomenon of oxidative stress, which is linked to extrahepatic tissue damage in the kidney, brain and heart (Ljubuncic et al., 2000). Hydrophobic bile salts, particularly LCA and its conjugates, are capable of inducing rapid oxidative stress which, if not overcome quickly, will trigger cleavage of caspases, membrane localization of CD95 and apoptosis of liver and colon cells (Reinehr et al., 2005; Katona et al., 2009). In agreement with these previous reports and our in vitro observations (Tan et al., 2007), the present study provides in vivo evidence of increased hepatic lipid peroxidation, as an indicator of oxidative stress, in response to LCA treatment in mice (Figure 3D).
The results of the present study demonstrate that hepatic Nrf2 is a critical player in the adaptive response against bile acid toxicity by coordinately up-regulating many cytoprotective genes that encode important antioxidant enzymes and efflux transporters. The simultaneous induction of these cytoprotective genes probably works in concert and synchronicity to ameliorate liver injury during the insurgence of toxic bile acids. Compared with the wild-type mice, the Nrf2−/− mice, which had a blunted cytoprotective and antioxidative defense response, were more susceptibile to LCA-induced liver damage.
The enzymes controlling GSH biosynthesis, Gclm and Gclc have been of particular interest in this study. GSH governs adaptive responses such as hepatic cell growth and death, mitochondrial survival, inflammatory response and fibrogenesis (Fernandez-Checa and Kaplowitz, 2005; Fu et al., 2008), which are critical determinants in the progression of cholestatic liver diseases. Dysregulation of hepatic GSH biosynthesis, due to impaired Nrf2 activity and the resultant reduction in Gclm and Gclc proteins, was reported in chronic bile duct occlusion, causing cholestatic liver damage in mice (Yang et al., 2009). Thus, the sustained activity of Gclm and Gclc subunits and GSH biosynthesis is imperative for normal hepatic cell function and survival during prolonged oxidative stress due to toxic bile acid insults. Replenishing GSH levels by administering N-acetyl-L-cysteine, a GSH precursor, is associated with positive outcomes in parenteral nutrition-induced cholestatic liver diseases in paediatric patients (Mager et al., 2008).
Trx1, which maintains cellular thiol and reduced thioredoxin levels, showed relatively high responses (approximately fourfold vs. ∼1.4-fold induction in Nrf2+/+ and Nrf2−/− mice, respectively) to the 4 day LCA treatment (Table 2). This increase in Trx1 was even more marked at 8 h (Table S2). Trx1 and the thioredoxin system work collaboratively with the GSH system and have essential roles in cellular redox signalling, anti-inflammatory and in anti-apoptotic effects and in preserving cell survival during oxidative stress (Rundlöf and Arnér, 2004; Kobayashi-Miura et al., 2007). Although the precise mechanisms underlying Trx1 participation in the adaptive response to bile acid toxicity remain unknown, Grattagliano et al. (2007) reported that the hepatic thioredoxin system may suppress intracellular reactive nitric oxide levels, which contribute to cholestatic liver injury by cleaving nitrosothiols.
The induction of various subtypes of hepatic GSTs, as seen in the present study and others (Aleksunes et al., 2006), appears to be a common observation during bile acid toxicity. The significance of individual GST subtypes in cholestatic liver injury remains an intriguing subject of future studies. Although speculative, GSTs, especially the alpha subtypes, may limit oxidative injury by scavenging 4-hydroxynonenal, a destructive reactive by-product produced from lipid peroxidation on membrane-borne arachidonic acid (Awasthi et al., 2004). Therefore, the compromised activity of GSTs may sensitize Nrf2−/− mice to increased liver damage following exacerbation of lipid peroxidation.
The differential expression of hepatic ABC transporters at different stages of cholestatic liver diseases represents a dynamic adaptive response of liver cells to prevent excessive accumulation of bile acids and toxic metabolites (Geier et al., 2007). Many ABC transporters are known to transport bile and bilirubin conjugates (Kullak-Ublick et al., 2004), and there is evidence that Mrp4 is particularly protective against cholestatic liver damage (Mennone et al., 2006). In consensus with previous reports (Maher et al., 2007), the results of the present study confirm that mouse Mrps 1–4 are regulated by Nrf2. We also showed that the expression of Mdr1a, Mdr1b and Abcg2 in mice is probably dependent on the Nrf2 signalling pathway (Table 2).
Disparities in hepatic transporter gene expression and bile acid synthesis may exist in targeted Nrf2 knockout mice generated from two different mouse strains. Using the outbred CD-1/ICR strain, Okada et al. (2008) as well as the present study noticed significantly lower basal (vehicle-treated) expression of hepatic Mrp4 in Nrf2−/− mice (Table 2). However, in the inbred C57BL/6 mice following Nrf2 knockout, the basal Mrp4 remains rather unchanged (Maher et al., 2007). Moreover, reduced total bile acid synthesis, as reported in the livers of Nrf2−/− mice of the C57BL/6 strain (Aleksunes et al., 2006), was not evident in the CD1/ICR strain (Okada et al., 2008). Despite these differences, a reduced induction of Mrp4 to oxidative stress was invariably seen in both strains of Nrf2−/− mice compared with their respective wild-type mice, suggesting that this transporter is induced and up-regulated in the liver through the Nrf2 signalling pathway.
In summary, we showed that Nrf2 acts as a protector against cholestatic liver damage by activating important adaptive responses. The potential of targeting Nrf2 in the management of clinical cholestatic liver diseases has indeed been suggested. Ursodeoxycholic acid, the only FDA-approved drug for primary biliary cirrhosis, a chronic form of cholestatic liver disease, was recently reported to activate Nrf2 signalling as part of its therapeutic effects (Okada et al., 2008; Yang et al., 2009). Further studies are needed to determine whether targeting solely the Nrf2 cytoprotective pathway is adequate and effective for the prevention of cholestatic liver injury.
Acknowledgments
We thank Dr M. Yamamoto for allowing us to study the Nrf2−/− mice generated in his laboratory. Appreciation also goes to Dr P Wells and Ms A. Ramkissoon for kindly providing the Nrf2+/− breeding pairs. This study was supported by Canada Institute for Health Research (CIHR) (MT13747). KPT was supported by RESTRACOMP from the Hospital for Sick Children, the University of Toronto Fellowship, and CIHR grant.
Glossary
Abbreviations
- Abc
ATP-binding cassette
- ALP
alkaline phosphatase
- ALT
alanine aminotransferase; BDL, bile-duct ligation
- DTNB
5,5′-dithio-bis(2-dinitrobenzoic acid)
- Gclc
glutamate cysteine ligase catalytic subunit
- Gclm
glutamate cysteine ligase modulatory subunit
- GSH
glutathione
- GST
glutathione S-transferase
- Ho1
haeme oxygenase-1
- LCA
lithocholic acid
- Mdr1
multidrug resistance protein 1
- Mrp
multidrug resistance-associated protein
- NAD(P)H:quinone
oxidoreductase 1, Nqo1
- Nrf2
nuclear factor (erythroid 2-related) factor 2
- qRT-PCR
quantitative reverse-transcription PCR
- Trx1
thioredoxin reductase 1
Conflicts of interest
All authors declare no conflicts of interest.
Supporting information
Additional Supporting Information may be found in the online version of this article:
Table S1 Constitutive hepatic gene expression of antioxidant enzymes and ABC transporters between Nr2+/+ and Nrf2−/− mice
Table S2 Hepatic gene expression of antioxidant enzymes and ABC efflux transporters upon acute (8 h) lithocholic acid (LCA) treatment in mice
Please note: Wiley-Blackwell are not responsible for the content or functionality of any supporting materials supplied by the authors. Any queries (other than missing material) should be directed to the corresponding author for the article.
References
- Aleksunes LM, Slitt AL, Maher JM, Dieter MZ, Knight TR, Goedken M, et al. Nuclear factor-E2-related factor 2 expression in liver in critical for induction of NAD(P)H:quinone oxidoreductase 1 during cholestasis. Cell Stress Chaperones. 2006;11:356–363. doi: 10.1379/CSC-217.1. [DOI] [PMC free article] [PubMed] [Google Scholar]
- Alexander SPH, Mathie A, Peters JA. Guide to Receptors and Channels (GRAC), 4th edition. Br J Pharmacol. 2009;158(Suppl. 1):S1–S254. doi: 10.1111/j.1476-5381.2009.00499.x. [DOI] [PMC free article] [PubMed] [Google Scholar]
- Awasthi YC, Yang Y, Tiwari NK, Patrick B, Sharma A, Li J, et al. Regulation of 4-hydroxynonenal-mediated signaling by glutathione S-transferases. Free Radic Biol Med. 2004;37:607–619. doi: 10.1016/j.freeradbiomed.2004.05.033. [DOI] [PubMed] [Google Scholar]
- Bomzon A, Holt S, Moore K. Bile salts and renal funjction in biliary cirrhosis. Semin Nephrol. 1997;17:549–562. [PubMed] [Google Scholar]
- Fernandez-Checa JC, Kaplowitz N. Hepatic mitochondrial glutathione: transport and role in disease and toxicity. Toxicol Appl Pharmacol. 2005;204:263–273. doi: 10.1016/j.taap.2004.10.001. [DOI] [PubMed] [Google Scholar]
- Fickert P, Fuchsbichler A, Marschall H-U, Wagner M, Zollner G, Krause R, et al. Lithocholic acid feeding induces segmental bile duct obstruction and destructive cholangitis in mice. Am J Pathol. 2006;168:410–422. doi: 10.2353/ajpath.2006.050404. [DOI] [PMC free article] [PubMed] [Google Scholar]
- Fischer S, Beuers U, Spengler U, Zwiebel FM, Koebe H-G. Hepatic levels of bile acids in end-stage chronic cholestatic liver disease. Clin Chem Acta. 1996;251:173–186. doi: 10.1016/0009-8981(96)06305-x. [DOI] [PubMed] [Google Scholar]
- Fu Y, Zheng S, Lu SC, Chen A. Epigallocatechin-3-gallate inhibits growth of activated hepatic stellate cells by enhancing the capacity of glutathione synthesis. Mol Pharmacol. 2008;73:1465–1473. doi: 10.1124/mol.107.040634. [DOI] [PMC free article] [PubMed] [Google Scholar]
- Geier A, Wagner M, Dietrich CG, Trauner M. Principles of hepatic organic anion transporters during cholestasis, inflammation and liver regeneration. Biochim Biophys Acta. 2007;1773:283–308. doi: 10.1016/j.bbamcr.2006.04.014. [DOI] [PubMed] [Google Scholar]
- Grattagliano I, Portincasa P, Palmieri VO, Palasciano G. Mutual changes of thioredoxin and nitrosothiols during biliary cirrhosis: results from humans and cholestatic rats. Hepatology. 2007;45:331–339. doi: 10.1002/hep.21519. [DOI] [PubMed] [Google Scholar]
- Gromer S, Arscott LD, Williams CH, Schirmer RH, Becker K. Human placenta thioredoxin reductase. Isolation of the selenoenzyme, steady state kinetics, and inhibition by therapeutic cold compounds. J Biol Chem. 1998;273:20096–20101. doi: 10.1074/jbc.273.32.20096. [DOI] [PubMed] [Google Scholar]
- Itoh K, Chiba T, Takahashi S, Ishii T, Igarashi K, Katoh Y, et al. An Nrf2/small Maf heterodimer mediates the induction of phase II detoxifying enzyme genes through antioxidant response elements. Biochem Biophys Res Commun. 1997;236:313–322. doi: 10.1006/bbrc.1997.6943. [DOI] [PubMed] [Google Scholar]
- Katona BW, Anant S, Covey DF, Stenson WF. Characterization of enantioneic bile acid-induced apoptosis in colon cancer cell lines. J Biol Chem. 2009;284:3354–3364. doi: 10.1074/jbc.M805804200. [DOI] [PMC free article] [PubMed] [Google Scholar]
- Kensler TW, Wakabayashi N, Biswal S. Cell survival responses to environmental stress via the Keap1-Nrf2-ARE pathway. Annu Rev Pharmacol Toxicol. 2007;47:89–116. doi: 10.1146/annurev.pharmtox.46.120604.141046. [DOI] [PubMed] [Google Scholar]
- Kobayashi-Miura M, Shioji K, Hoshino Y, Masutani H, Nakamura H, Yodoi J. Oxygen sensing and redox signaling: the role of thioredoxin in embryonic development and cardiac diseases. Am J Physiol Heart Circ Physiol. 2007;292:H2040–H2050. doi: 10.1152/ajpheart.01316.2006. [DOI] [PubMed] [Google Scholar]
- Kullak-Ublick GA, Stieger B, Meier PJ. Enterohepatic bile salt transporters in normal physiology and liver disease. Gastroenterology. 2004;126:322–342. doi: 10.1053/j.gastro.2003.06.005. [DOI] [PubMed] [Google Scholar]
- Ljubuncic P, Tanne Z, Bomzon A. Evidence of a systemic phenomenon for oxidative stress in cholestatic liver disease. Gut. 2000;47:710–716. doi: 10.1136/gut.47.5.710. [DOI] [PMC free article] [PubMed] [Google Scholar]
- Mager DR, Marcon M, Wales P, Pencharz PB. Use of N-aceytl cysteine for the treatment of parenteral nutrition-induced liver disease in children receiving home parenteral nutrition. J Pediatr Gastroenterol Nutr. 2008;46:220–223. doi: 10.1097/MPG.0b013e3180653ce6. [DOI] [PubMed] [Google Scholar]
- Maher JM, Dieter MZ, Aleksunes LM, Slitt AL, Guo G, Tanaka Y, et al. Oxidative and electrophilic stress induces multidrug resistance-associated protein transporters via the nuclear factor-E2-related factor-2 transcriptional pathway. Hepatology. 2007;45:1597–1610. doi: 10.1002/hep.21831. [DOI] [PubMed] [Google Scholar]
- Mennone A, Soroka CJ, Cai S, Harry K, Adachi M, Hagey L, et al. Mrp4-/- mice have impaired cytoprotective response in obstructive cholestasis. Hepatology. 2006;43:1013–1021. doi: 10.1002/hep.21158. [DOI] [PubMed] [Google Scholar]
- Nguyen T, Nioi P, Pickette CB. The Nrf2-antioxidant response element signaling pathway and its activation by oxidative stress. J Biol Chem. 2009;284:13291–13295. doi: 10.1074/jbc.R900010200. [DOI] [PMC free article] [PubMed] [Google Scholar]
- Okada K, Shoda J, Taguchi K, Maher JM, Ishizaki K, Inoue Y, et al. Ursodeoxycholic acid stimulates Nrf2-mediated hepatocellular transport, detoxification, and antioxidative stress systems in mice. Am J Physiol Gastrointest Liver Physiol. 2008;295:G735–G747. doi: 10.1152/ajpgi.90321.2008. [DOI] [PubMed] [Google Scholar]
- Ono M, Sekiya C, Ohhira M, Ohhira M, Namiki M, Endo Y, et al. Elevated level of serum Mn-superoxide dismutase in patients with primary biliary cirrhosis: possible involvement of free radicals in the pathogenesis in primary biliary cirrhosis. J Lab Clin Med. 1997;118:476–483. [PubMed] [Google Scholar]
- Reinehr R, Becker S, Keitel V, Eberle A, Grether-Beck S, Haussinger D. Bile salt-induced apoptosis involves NADPH oxidase isoform activation. Gastroenterology. 2005;129:2009–2031. doi: 10.1053/j.gastro.2005.09.023. [DOI] [PubMed] [Google Scholar]
- Rundlöf AK, Arnér ES. Regulation of the mammalian selenoprotein thioredoxin reductase 1 in relation to cellular phenotype, growth, and signaling events. Antioxid Redox Signal. 2004;6:41–52. doi: 10.1089/152308604771978336. [DOI] [PubMed] [Google Scholar]
- Smith AD, Guidry CA, Morris VC, Levander OA. Aurothioglucose inhibits murine thioredoxin reductase activity in vivo. J Nutr. 1999;129:123–125. doi: 10.1093/jn/129.1.194. [DOI] [PubMed] [Google Scholar]
- Staudinger JF, Goodwin B, Jones SA, Hawkins-Brown D, MacKenzie KI, LaTour A, et al. The nuclear receptor PXR is a lithocholic acid sensor that protects against liver toxicity. Proc Natl Acad Sci USA. 2001;98:3369–3374. doi: 10.1073/pnas.051551698. [DOI] [PMC free article] [PubMed] [Google Scholar]
- Tan KP, Yang M, Ito S. Activation of nuclear factor (erythroid-2 like) factor 2 by toxic bile acids provokes adaptive defense responses to enhance cell survival at the emergence of oxidative stress. Mol Pharmacol. 2007;72:1380–1390. doi: 10.1124/mol.107.039370. [DOI] [PubMed] [Google Scholar]
- Tan KP, Kosuge K, Yang M, Ito S. NRF2 as a determinant of cellular resistance in retinoic acid cytotoxicity. Free Radic Biol Med. 2008;45:1663–1673. doi: 10.1016/j.freeradbiomed.2008.09.010. [DOI] [PubMed] [Google Scholar]
- Tsai LY, Lee KT, Tsai SM, Lee SC, Yu HS. Changes of lipid peroxide levels in blood and liver tissues of patients with obstructive jaundice. Clin Chim Acta. 1993;215:41–50. doi: 10.1016/0009-8981(93)90247-2. [DOI] [PubMed] [Google Scholar]
- Xie W, Radominska-Pandya A, Shi Y, Simon CM, Nelson MC, Ong ES, et al. An essential role for nuclear receptors SXR/PXR in detoxification of cholestatic bile acids. Proc Natl Acad Sci USA. 2001;98:3375–3380. doi: 10.1073/pnas.051014398. [DOI] [PMC free article] [PubMed] [Google Scholar]
- Yang H, Ramani K, Xia M, Ko KS, Li TW, Oh P, et al. Dysregulation of glutathione synthesis during cholestasis in mice: molecular mechanisms and therapeutic implications. Hepatology. 2009;49:1982–1991. doi: 10.1002/hep.22908. [DOI] [PMC free article] [PubMed] [Google Scholar]
Associated Data
This section collects any data citations, data availability statements, or supplementary materials included in this article.