

Abstract
V-ATPase is a multisubunit membrane complex that functions as nanomotor coupling ATP hydrolysis with proton translocation across biological membranes. Recently, we uncovered details of the mechanism of interaction between the N-terminal tail of the V-ATPase a2-subunit isoform (a2N1–402) and ARNO, a GTP/GDP exchange factor for Arf-family small GTPases. Here, we describe the development of two methods for preparation of the a2N1–402 recombinant protein in milligram quantities sufficient for further biochemical, biophysical, and structural studies. We found two alternative amphiphilic chemicals that were required for protein stability and solubility during purification: (i) non-detergent sulfobetaine NDSB-256 and (ii) zwitterionic detergent FOS-CHOLINE®12 (FC-12). Moreover, the other factors including mild alkaline pH, the presence of reducing agents and the absence of salt were beneficial for stabilization and solubilization of the protein. A preparation of a2N1–402 in NDSB-256 was successfully used in pull-down and BIAcore™ protein–protein interaction experiments with ARNO, whereas the purity and quality of the second preparation in FC-12 was validated by size-exclusion chromatography and CD spectroscopy. Surprisingly, the detergent requirement for stabilization and solubilization of a2N1–402 and its cosedimentation with liposomes were different from peripheral domains of other transmembrane proteins. Thus, our data suggest that in contrast to current models, so called “cytosolic” tail of the a2-subunit might actually be embedded into and/or closely associated with membrane phospholipids even in the absence of any obvious predicted transmembrane segments. We propose that a2N1–402 should be categorized as an integral monotopic domain of the a2-subunit isoform of the V-ATPase.
Keywords: V-ATPase, a2-subunit, integral monotopic domain, solubility, detergent, refolding
Introduction
The vacuolar-type H+-ATPase (V-ATPase) is a multisubunit membrane complex that catalyzes ATP hydrolysis and couples this reaction with rotation and proton translocation across biological membranes.1,2 Because of its crucial role in cell function, the V-ATPase is a protein of considerable interest to physiological, biophysical, biochemical, and structural researchers. The V-ATPase consists of two sectors: (i) The V1-sector, which peripherally associates with the cytoplasmic side of a membrane and hydrolyzes ATP and (ii) the transmembrane Vo-sector, which is responsible for proton translocation. Each sector consists of multiple subunits: V1 is composed of eight different subunits (A, B, C, D, E, F, G, and H), whereas Vo contains six different subunits (a, c, c′, c″, d, and e). Subunits c, c′, and c″ form a proteolipid ring, whose rotation allows protons to pass through the membrane. In mammalian cells, several subunits are present in multiple isoforms, and their expression is tissue and cell specific. There are four isoforms of the a-subunit (a1, a2, a3, and a4), three isoforms of subunits C, G, and two isoforms of subunits B, E, H, and d2. Since V-ATPase functions as a nanomotor with a rotary mechanism, it is also divided into a stationary part (stator), composed of subunits A, B, C, E, G, H, d, e, a, and a rotating part (rotor), composed of a proteolipid ring and subunits D and F. The classification of V-ATPase genes has recently been updated and standardized to take into account several predicted isoforms based on an extensive database search.3
The V-ATPase a-subunit is a large 100 kDa transmembrane protein which, together with the proteolipid ring, forms a channel for proton transport.2,4 Different isoforms of the a-subunit determine the subcellular localization of the whole complex, by targeting it either to the plasma membrane or to intracellular vesicles and organelles.1 From a structural perspective, the topology of a-subunit is not understood.4 For the yeast “a” subunit homolog Vph1, several topology models have been proposed over the years,5–8 with the most recent model depicting eight transmembrane α-helices with both the N-terminal and C-terminal ends located on the cytoplasmic side of the membrane.8 Although the location of the N-terminal region of the protein on the cytoplasmic site has been experimentally confirmed, its exact length has not been finally determined. Most topology prediction programs calculate that it spans the first 390–410 amino acids, which is almost half of the protein sequence.4 Since this N-terminal region does not contain any predicted transmembrane segments, it is generally considered to be a peripheral “cytosolic” tail of the V-ATPase a-subunit.
As a part of the stator, the a-subunit is involved in multiple protein–protein interactions within the V-ATPase complex. Crosslinking, two-hybrid screening, coimmunoprecipitation, and electron microscopy showed that the a-subunit isoforms directly interact with A-, E-, H-, C-, and G-subunits of the V1 sector9–13 as well as with c- and d-subunits of the Vo sector.2,14–16 Recently, it has also been shown that the V-ATPase a-subunit directly assembles with proteins that are not part of the V-ATPase complex including: (i) aldolase B,17,18 (ii) phosphofrucktokinase-1,19,20 (iii) calmodulin,21 and (iv) t-SNARES syntaxin and SNAP-25.22 However, the mechanisms and molecular details of interactions with these proteins remain poorly understood, mainly due to the lack of a high-resolution structure of the a-subunit and the absence of studies designed for mapping interaction sites on both the a-subunit and its associated proteins.
Recently, we showed that the N-terminal (1–393 aa) region of the V-ATPase a2-subunit isoform (a2N1–393) interacts with one of the key regulators of vesicle trafficking in mammalian cells, the Arf-GEF ARNO, providing a link between pH regulation (acidification) and trafficking within the protein degradation pathway.23 This initial study of the interactions was performed by immunoprecipitation and pull-down assays using low amounts of in vitro translated and radioactively labeled a2N1–393 protein.23 However, to characterize the molecular mechanisms between the a-subunit and ARNO we developed two novel protocols for purifying milligram amounts of a2N1–402 and these methods are presented here in detail. Using this recombinant protein, we have recently mapped the interaction sites on both a2N1–402 and ARNO using pull-down assays and demonstrated their high affinity binding using a BIAcore™ assay.24 Importantly, the biochemical properties of a2N1–402, especially its instability in water-based solutions in the absence of amphiphilic additives and direct binding to azolectin lipid vesicles, suggest that this region of the V-ATPase a2-subunit is not a classical cytosolic tail, but an integral—most likely monotopic—domain that is embedded into and/or associated with the phospholipid membrane even in the absence of predicted transmembrane segments.
Results
Cloning, expression, and localization of a2N1–402 recombinant protein in E. coli
The exact position of the first transmembrane helix of the a-subunit isoforms of V-ATPase is currently unknown. However, most topology programs predict its beginning at around 390–410 amino acids from the N-terminus for mammalian a-subunit isoforms.4 For the a2-isoform, the first transmembrane helix was predicted to start at T403,25 and its N-terminal tail, thus, comprises amino acids 1–402. The a2N1–402 domain was, therefore, expected to lack any significant, hydrophobic transmembrane α-helices and should be easily obtained in water-soluble form. The cDNA encoding a2N1–402 was cloned and used with a conventional pET/BL21(DE3) E. coli expression system for expression and purification of recombinant protein. First, we studied the expression and localization of a2N1–402 in E. coli using transmission electron microscopy (TEM). We analyzed the morphology of both untransformed and E. coli BL21(DE3) cells transformed with the pET28b-a2N1–402 plasmid (Fig. 1). Surprisingly, in contrast to the predictions of solubility of this protein, the electron micrographs of a2N1–402 expressing bacteria revealed the presence of electron-dense cytosolic inclusion bodies (IBs) as large as the short axis of the cell [Fig. 1(B,D)]. They were observed either at one or both poles of the transformed cells [Fig. 1(B), arrows] but were absent from control untransformed cells [Fig. 1(A,C)]. Thus, similar to many other proteins expressed in E. coli, a2N1–402 forms cytosolic IBs. However, we also found that in untransformed cells, bacterial ribosomes were distributed uniformly inside the cell [Fig. 1(C), arrows], whereas in cells expressing a2N1–402, they were concentrated around IBs and also along the bacterial membrane [Fig. 1(D), arrows]. This redistribution of ribosomes results in a significantly lower electron-density of the cytosol of transformed cells [Fig. 1(B,D)] in comparison with the cytosol of untransformed cells [Fig. 1(A,C)]. Thus, we suggest that protein expressed in E. coli a2N1–402 is initially targeted to the bacterial membrane and drives relocalization of ribosomes from the cytosol to the cell perimeter. When all membrane surfaces apparently become occupied by the expressed protein associated with ribosomes it starts to accumulate in the cytosol, forming IBs.
Figure 1.
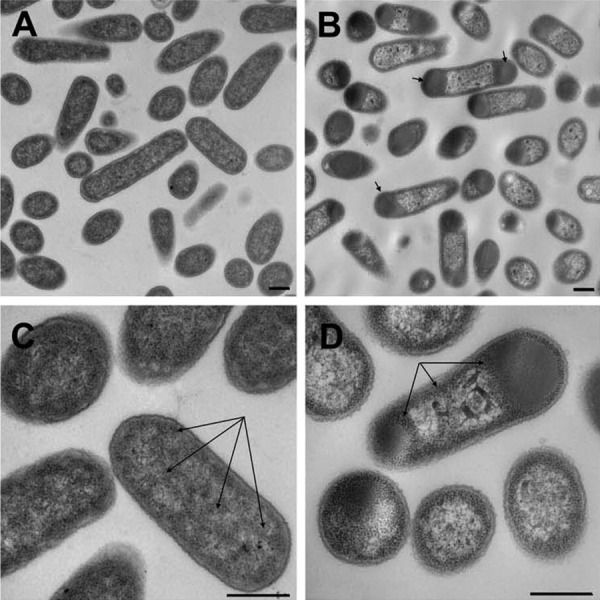
Transmission electron microscopy of E. coli BL21(DE3) cells followed expression of recombinant a2N1–402. (A, C) Morphological appearance of untransfected control cells. Arrows in panel (C) indicate uniform distribution of ribosomes in cytoplasm. (B, D) Morphological appearance of cells after expression of recombinant a2N1–402. Arrows in panel (B) indicate cytoplasmic inclusion bodies at one or both polar regions. Arrows in (D) indicate ribosomes concentrated at the perimeter of the cell and around inclusion bodies. In cells expressing a2N1–402 (B, D), the cytosol is less dense and is depleted from ribosomes compared with untransfected cells (A, C). Bar = 500 nm.
Insolubility of a2N1–402 and a2N1–402-derived recombinant proteins in aqueous conditions
Recombinant protein expressed in E. coli a2N1–402 was produced at very high levels of about 150 mg per liter of bacterial culture, but as suggested by TEM it was found exclusively as an insoluble protein. To obtain at least part of this region in a water-soluble form, we also prepared shorter constructs covering the entire a2N1–402 sequence, which was expected to produce proteins more water soluble than the entire a2N1–402. This strategy was successfully applied to the N-terminal region of NtpI, the Enterococcus hirae homolog of the mammalian a-subunit of V-ATPase.26 However, none of the following eight shorter constructs: (i) a2N1–58, (ii) a2N1–360, (iii) a2N1–371, (iv) a2N1–378, (v) a2N1–393, (vi) a2N134–393, (vii) a2N143–259, and (viii) a2N247–402 were able to produce soluble proteins (data not shown). Thus, the whole a2N1–402 region was surprisingly insoluble throughout its entire sequence. Since all a2N1–402-derived recombinant proteins were insoluble in water-based conditions, the longest a2N1–402 construct was chosen for further experiments.
Next, we searched for conditions to purify and solubilize the a2N1–402 from IBs for the following reasons: (i) very high expression levels, (ii) relatively high purity in the IBs, (iii) protection from proteolytic enzymes, and (iv) a relatively simple purification procedure.27 On the down-side, however, purification from IBs usually requires solubilization with high concentrations of strong denaturing agents, which leads to complete protein denaturation and requires subsequent protein refolding.27 Alternatively, the solubilization of the IBs in the presence of mild detergents without completely denaturing the protein could be applied. Here, we describe both methods for solubilization and purification of bacterially expressed a2N1–402.
Purification of a2N1–402 under denaturing conditions followed by its subsequent refolding
As expected, a2N1–402 recombinant protein could be easily solubilized in a denatured state with 6 M GuHCl (Fig. 2, lanes 5 and 6). Unexpectedly, a2N1–402 was also more soluble in acetone than in water (at least in the presence of residual 120 mM GuHCl), since during preparation of 6 M GuHCl-protein we observed that much less protein was recovered in the 12,000g pellet after its precipitation upon dilution in ice-cold acetone (Fig. 2, lane 5), than in water (Fig. 2, lane 6) at a 1:50 (v/v) ratio in both cases. In conclusion, after expression in E. coli, the a2N1–402 recombinant protein is not soluble in water-based solutions, but it could be solubilized upon denaturing with 6 M GuHCl or in the organic solvent acetone. For large-scale purification, the a2N1–402 protein was expressed, solubilized and purified on Talon beads in the presence of 6 M GuHCl as described in Materials and Methods section. Since the protein was completely denatured during this procedure, it was necessary to find optimal refolding conditions. Therefore, we used the iFOLD™ Protein Refolding System 2 (EMD Biosciences Novagen), which provides a comprehensive refolding screen in 96-well plate format. The composition of refolding solutions in this system was designed using a fractional factorial approach, based on a literature review of successful refolding experiments and information contained in the REFOLD database (http://refold.med.monash.edu.au). This kit covers different buffering systems as well as including various combinations of salts, redox agents and refolding additives. The detailed composition of each well in the refolding plate can be found on the EMD website (http://www.emdchemicals.com). It is noteworthy, that the iFOLD™ Protein Refolding System 2 is mainly designed for the refolding of water-soluble proteins and, therefore, it is entirely detergent-free.
Figure 2.
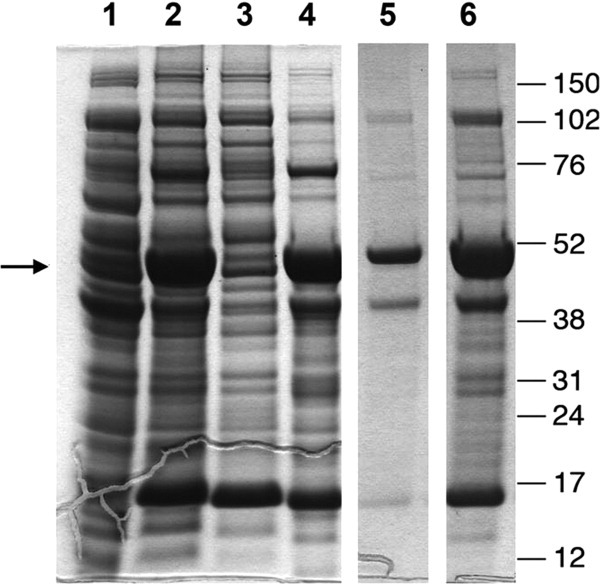
Expression and solubility of a2N1–402. Lane 1: uninduced total cell lysate. Lane 2: induced total cell lysate. Lane 3: soluble proteins fraction recovered in supernatant after centrifugation for 15 min at 12,000g. Lane 4: insoluble proteins fraction recovered in pellet after centrifugation for 15 min at 12,000g. Lane 5: proteins soluble in 6 M GuHCl and precipitated by acetone. Lane 6: proteins soluble in 6 M GuHCl and precipitated by water. Arrow indicates the positions of the band corresponding to a2N1–402. Molecular weight markers are shown on the right.
Using this approach, the a2N1–402 protein was refolded by rapid dilution at a 1:50 v/v ratio (final protein concentration 0.1 mg/mL) into 95 different refolding buffers. The folding of protein was estimated by measuring the turbidity of each well at 340 nm according to the manufacturer's instructions (see Materials and Methods section). While this assay measures solubility and not necessarily folding, it has been shown previously that it can be used for estimation of protein folding with high confidence.28 However, to distinguish between some false-positive measurements obtained by this approach (Supporting Information Table S1, in gray) (see also Materials and Methods section), we visually re-analyzed each well and found 17 (of 95) visually clear wells, which indicates proper folding of a2N1–402 under these conditions (Supporting Information Table S1, in green). Figure 3 shows a summary of these experiments. The number of successful refolding reactions of a2N1–402 increased with increasing pH (Fig. 3, column 1) with pH 9.0 being the best. The presence of one of the following reagents was also required for refolding: (i) 1 M NDSB-201, (ii) 0.5 M l-arginine, or (iii) 0.5–1 M NDSB-256 (Fig. 3, column 2). The reagent NDSB-256 (Fig. 3, column 2) gave the best result. Addition of reducing agents also significantly improved the solubility of a2N1–402 (Fig. 3, column 3). Finally, while NaCl and KCl salts were present in 12 of 17 of the successful refolding reactions (Fig. 3, column 4), the subsequent experiments showed that presence of salts were not beneficial for protein stability. Thus, based on these data, the following refolding buffer was chosen for all subsequent large-scale refoldings of a2N1–402: 1 M NDSB-256, 1 mM DTT, 100 mM CHES, and pH 9.0. Finally, to test if the refolded protein would be stable in solution in the absence of NDSB-256, we extensively dialysed it against 1 mM DTT, 100 mM CHES, and pH 9.0. The protein partially precipitated during dialysis. Precipitated material was removed by centrifugation at 12,000g and the cleared solution was further analyzed by size-exclusion chromatography (SEC). Protein was eluted in the void volume (data not shown) suggesting that it formed aggregates that were not completely removed by relatively low-speed centrifugation. Thus, NDSB-256 was required not only during protein refolding but also afterward for stabilization of a2N1–402 protein in the solution.
Figure 3.
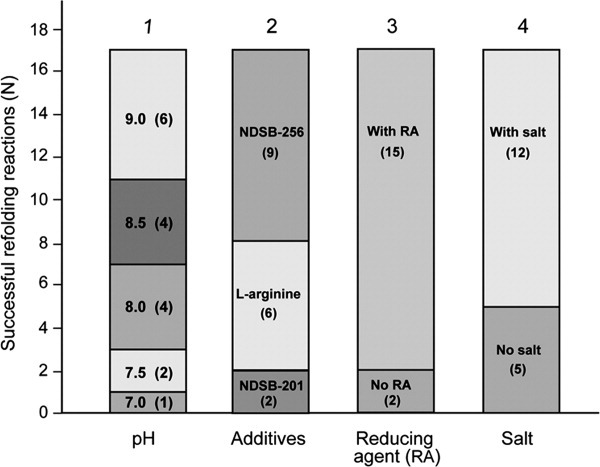
Factors and conditions favorable for a2N1–402 refolding. Distribution of successful refolding conditions according to pH, refolding additive, salt, and reducing agents (RA). The successful refolding reactions rise with increasing of pH (column 1, from bottom to top), in the row of the following refolding additives: NDSB-201, l-arginine, and NDSB-256 (column 2, from bottom to top). Also, it was higher in the presence of reducing agents (column 3, top vs. bottom) and presence of salt (column 4, top vs. bottom). Number of successful refolding reactions (N) is indicated inside the stacked columns in parentheses.
Solubilization and purification of a2N1–402 in the presence of detergents
To avoid the denaturation/refolding steps, which are potentially harmful for the proper folding and function of the proteins, we next developed a method of purifying a2N1–402 in the presence of detergents. To determine which detergent would be the most efficient for solubilization of a2N1–402, we began a systematic screening of various mild detergents. In total, 21 nonionic and zwitterionic detergents from “Popular detergent” and “ANAPOE® Master” kits from Anatrace were screened as described in Materials and Methods section. Different detergents produced slightly different solubility patterns, but could not quantitatively solubilize a2N1–402 with the exception of FC-12 (Fig. 4). The extraction of a2N1–402 by FC-12 was extremely efficient and the amount of 48 kDa protein (the predicted molecular weight of a2N1–402) was approximately the same (Fig. 4, lane 7) as in the initial insoluble protein fraction (Fig. 4, lane 1). Importantly, FC-12 at a concentration of 32–64 mM (1–2%) was as potent as 6 M GuHCl (Fig. 2, lane 6) in solubilizing the a2N1–402 protein expressed in IB of E. coli. Thus, FC-12 was chosen for all subsequent solubilization and purification procedures. Initial screening for detergent efficiency was performed for ∼1 mg/mL a2N1–402 50% pure protein in 50 mM CHES-NaOH, pH 9.0; 300 mM NaCl and 10 mM β-mercaptoethanol (β-ME) at 2% FC-12. We performed additional experiments and found that FC-12 was as efficient at 1% as at 2% in these conditions [Fig. 5(A)]. Solubilization of a2N1–402 by 1% FC-12 decreased with decreasing pH [Fig. 5(B)] and increasing NaCl concentration [Fig. 5(C)]. Since very high alkaline pH 9.0 is not compatible with our biochemical assays, we further optimized protein solubilization conditions and found that 50 mM CHES-NaOH, pH 9.0 could be replaced by 10 mM NaPh, pH 8.0 without affecting a2N1–402 solubilization by 1% FC-12 [Fig. 5(D)]. It is noteworthy that slightly alkaline pH and the presence of reducing agents had already been identified as conditions favorable for a2N1–402 solubility during our prior refolding study (Fig. 3). Thus, our final optimized condition for large-scale protein solubilization in the presence of mild detergent was as follows: 10 mM NaPh, pH 8.0, 1 mM DTT, and 1% FC-12.
Figure 4.
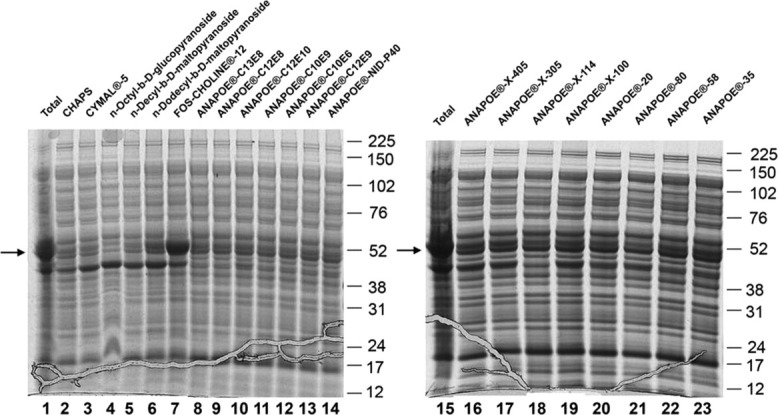
Screening of the detergents suitable for extraction of a2N1–402 from water-insoluble proteins of E. coli. Screened detergents are shown on the top. Lanes 1 and 15 are total water-insoluble fractions. Lanes 2–7 are detergent-soluble fractions obtained after solubilization for 1 h with 2% of detergent. Lanes 8–14 and 16–23 are detergent-soluble fractions obtained after solubilization for 1 h with 1% of indicated detergents. Arrow on the left of each gel indicates the positions of the bands corresponding to a2N1–402. Molecular weight markers are shown on the right of each gel.
Figure 5.
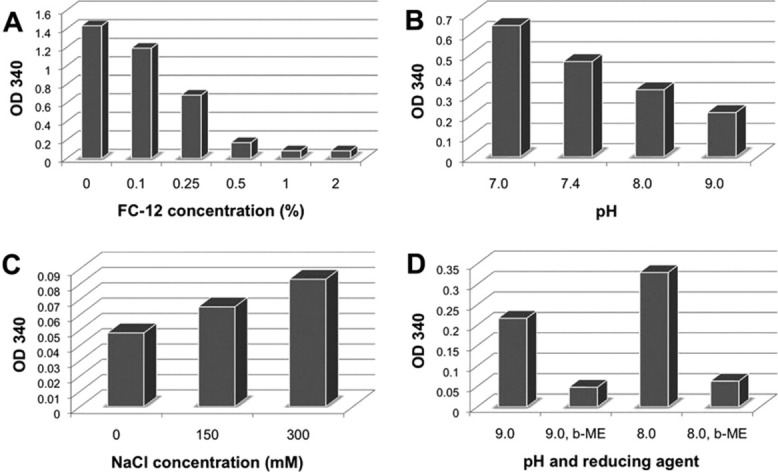
Optimization of a2N1–402 solubilization in presence of FC-12. (A) Optimization of FC-12 concentration. Consequent optimization of solubilization was done in the presence of 1% FC-12 and is increased in higher pH (B), decreasing salt concentration (C) and upon addition of 10 mM β-mercaptoethanol (β-ME) (D). Lower A340 values indicate higher solubility.
The amount of FC-12 in this buffer could be reduced to 0.1% without affecting protein solubility during subsequent protein purification by two-step IMAC and SEC chromatography. Size-exclusion chromatography was the last purification step of a2N1–402 and resulted in ∼80% pure protein. In addition, SEC was also used to evaluate the degree of monodispersity (size homogeneity) of a2N1–402 protein, purified in the presence of 0.1% FC-12. As seen from the SEC chromatogram, the main protein peak 3 is sharp and symmetric, and significantly larger than the peak 1 of aggregated protein at the void volume of the column [Fig. 6(A)]. According to NuPAGE analysis, peak 3 contains the purest fraction of a2N1–402 protein [Fig. 6(B), lane 3]. Additional right and left peaks 2 and 4 forming shoulders on the main peak 3 came from copurification of other proteins [Fig. 6(A,B), lanes 2 and 4]. Peak 5 contains mainly lysozyme (Mw, 14.7 kDa), used for lysis of E. coli cells during the first step of the protein extraction procedure. Thus, peak 3 contains the purest (∼80% purity) and monodisperse protein, which strongly suggest that under these conditions the a2N1–402 is stable in solution.29 Since the column was precalibrated by application of standard proteins, it was possible to calculate the apparent molecular mass of the detergent–protein complex from its elution position as described in Materials and Methods section.30 An apparent molecular mass of about 252 kDa was obtained for the detergent–protein complex eluted in the main peak. This is significantly higher than the calculated molecular mass of a2N1–402 monomer (48.5 kDa) and the molecular mass of free FC-12 micelles (∼17.6 kDa according to data from the Anatrace website: http://www.anatrace.com). Thus, apparently more than one molecule of a2N1–402 is inserted into the FC-12 detergent micelle. However, additional experiments, such as SEC with an FC-12 detergent series31 would be required to accurately determine the composition of a2N1–402 protein-FC12 detergent micelles.
Figure 6.
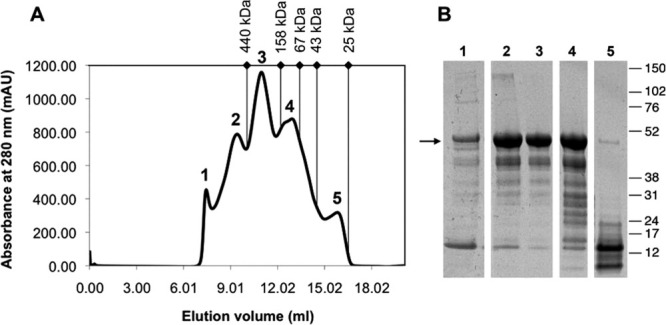
Purification and analysis of size homogeneity of a2N1–402 by size-exclusion chromatography. A: Elution profile of partially purified a2N1–402 protein on Superdex 200 HR 10/30 size-exclusion column. Major absorbance peaks are numbered from 1 to 5. B: NuPAGE analysis of the chromatography peak fractions. Arrow on the left indicates the positions of the bands corresponding to a2N1–402. Molecular weight markers are shown on the right. The elution volumes are indicated by diamonds and molecular mass of standard proteins are shown on the top as follows: ferritin, aldolase, albumin, ovalbumin, and chymotrypsinogen-A.
Physical characterization of a2N1–402
The secondary structure of recombinant a2N1–402 was determined from circular dichroism spectra, measured between 190 and 260 nm (Fig. 7). The minima at 220 and 208 nm and the maximum at 192 nm indicate the presence of α-helical structures in the protein; the overall spectrum is characteristic for a protein with mixed α/β-structure. Two computer-based methods were used to analyze the CD spectrum of a2N1–402. The average secondary structure content was 41% α-helix, 20% β-sheet, and 39% random coil. This result is consistent with secondary structure predictions based on the a2N1–402 amino-acid sequence.
Figure 7.
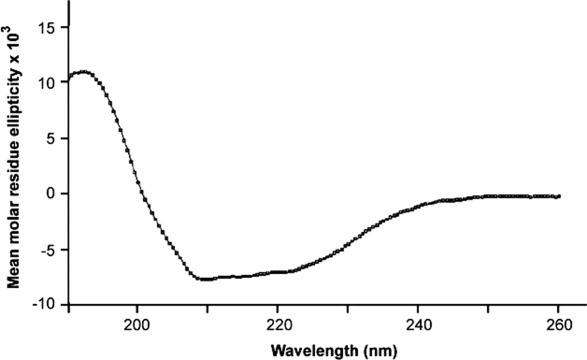
Far UV-CD spectrum of recombinant a2N1–402 of the V-ATPase.
Binding of a2N1–402 to azolectin liposomes
To confirm that a2N1–402 possesses intrinsic membrane binding properties, we performed protein–liposomes cosedimentation experiments. a2N1–402 was purified in presence of FC-12 detergent as described above and contained about 1% of FC-12 in its stock solution. Azolectin liposomes were prepared as described previously,32 which contain mostly phosphatidylcholine (PC) as well as other lipids including phosphoinositides.32 Our experiments demonstrated (Fig. 8) that a2N1–402 protein is cosedimented with the azolectin liposomes and require two consequent rounds of binding and ultracentrifugation. During the first round of cosedimentation [Fig. 8(A)], the a2N1–402 protein does not cosediment with liposomes [Fig. 8(A), lane 3] and mainly remains in soluble state in supernatant [Fig. 8(A), lane 2]. We suggested the interference of free FC-12 detergent, which is present in this step, and thus, in the second round of cosedimentation we use the FC-12 depleted S1-supernatant also containing a2N1–402 protein [Fig. 8(A), lane 2]. Indeed, in these experiments, we demonstrated the efficient cosedimentation of the a2N1–402 protein with azolectin liposomes [Fig. 8(B), lane 5]. Importantly, the amount of protein associated with liposomes was comparable to the remaining a2N1–402 protein in solution [Fig. 8(B), lane 4].
Figure 8.
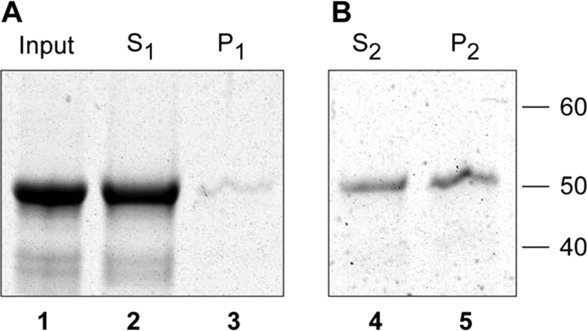
Purified a2N1–402 binds to azolectin liposomes. A: First round of protein–liposomes cosedimentation. Lane 1: Purified a2N1–402 protein before ultracentrifugation. Lanes 2 and 3: Supernatant (S1) and pellet (P1) fractions after a2N1–402 incubation in presence of azolectin liposome and ultracentrifugation at 100,000g for 1 h. B: Second round of protein–liposomes cosedimentation. Total a2N1–402 protein retained in S1-supernatant was used for the second round of incubation with azolectin liposomes and cosedimentation. Lanes 4 and 5: Supernatant (S2) and pellet (P2) fractions contain approximately equal amounts of a2N1–402 after its incubation in presence of azolectin liposome and ultracentrifugation at 100,000g. Molecular weight markers are shown on the right.
Discussion
In this study, we developed two alternative methods that involve either denaturation/refolding or extraction with mild detergents for the preparation of milligram amounts of recombinant a2N1–402 protein. However, these types of preparations may produce incorrectly folded and biologically inactive protein.27 Thus, correct refolding should be validated by either: (i) circular dichroism spectroscopy, (ii) dynamic light scattering, (iii) SEC, or (iv) functional biochemical and interaction assays.28 Since first two methods are not compatible with high concentrations of NDSB-256 reagent present in our first preparation, we validated its binding properties after denaturation using surface-plasmon resonance protein–protein interaction assay. In these “BIAcore™” experiments, the purified and refolded a2N1–402 was immobilized on a CM4 chip by amine-coupling and the affinity of its interaction with ARNO was studied.24 These functional protein–protein binding experiments demonstrated that a2N1–402 is properly folded and could specifically interact with ARNO.24 Furthermore, the purity and quality of the second preparation of a2N1–402 in the presence of FC-12 was successfully validated with CD spectroscopy and SEC experiments as described above.
Unexpectedly, we found that either the nondetergent sulfobetaine NDSB-256 or the detergent FC-12 was required to stabilize protein in solution during the purification of a2N1–402. Both chemicals are zwitterionic and both are amphiphilic, that is, they contain hydrophobic and hydrophilic parts (see Supporting Information Figure S1), but NDSB-256 has a much shorter hydrophobic region. This probably renders it less potent, and the effective concentration of NDSB-256 was indeed much higher (1 M) than that of FC-12 (up to 64 mM). The detergent FC-12 is a phospholipid-like molecule that has a phosphocholine headgroup but, unlike PC, possesses only one hydrophobic tail and lacks a complex glycerol ester chain (Supporting Information Figure S1). Fos-choline detergents with 8–16 carbon alkyl chain lengths (FC-8 to FC-16) were previously used in studies of membrane proteins. In a recent high-throughput study, FC-12 was found to be the most effective detergent for solubilization of integral membrane proteins.33 Recently, it has been shown that FC-13 to FC-16 detergents could efficiently solubilize IBs formed by the human tachykinin G-protein coupled receptor NK1, expressed in E. coli34 as well as several 7-transmembrane G-protein coupled chemokine receptors (also expressed in E. coli).35 Thus, we propose that FC-12 (or longer chain FCs) and the protocol reported here could also be suitable for bacterial expression and purification of N-terminal cytosolic tails of all other a-subunit isoforms of V-ATPase.
How can a relatively mild detergent, such as FC-12, extract proteins from IBs? The formation of IBs upon overexpression of heterologous proteins in E. coli is a well-known phenomenon but only recently has it been recognized that it is not due to a passive precipitation of the unfolded protein.36 Rather, it results from an organized aggregation driven by interactions between hydrophobic stretches of partially folded protein molecules.37 We hypothesize that in the case of a2N1–402 protein, its hydrophobic regions drive the formation of IBs, but it remains partially folded and, therefore, can be efficiently and quantitatively solubilized by FC-12. This finding also led us to conclude that the generally accepted “cytosolic” N-terminal part of a-subunit of V-ATPase is not a traditional peripheral membrane domain. Instead, we hypothesize that it is an integral membrane-bound domain, which penetrates into the membrane deeply enough to encounter and interact with the hydrophobic tails of membrane phospholipids. Thus, PC due to its structural resemblance with FC-12 (Supporting Information Figure S1) would be probably one of the lipids involved in interaction with N-terminal tail of V-ATPase. Indeed in direct protein–lipid cosedimentation assay, we showed that a2N1–402 binds to lipid vesicles prepared from crude PC (azolectin) granules. Additional evidence that a2N1–402 could possess intrinsic integral membrane properties came from our TEM study of protein localization in E. coli, which demonstrated that a small fraction of the protein might be associated with the bacterial membrane.
In the earlier studies,5–8 it was difficult to determine the orientation of the N-terminus of a-subunit isoforms, but it is now generally accepted that this domain is oriented toward the cytoplasm. Moreover, according to several recent electron microscopy studies of V-ATPases from different organisms16,38–40 and small-angle X-ray scattering data of NtpI1–341,26 it was determined that the N-terminal domain of the a-subunit forms an elongated ∞-shaped structure. In these studies, it was also suggested that this part of the a-subunit lies parallel to the membrane, adjacent to its cytoplasmic side. However, both its association with the lipid bilayer and its orientation toward the membrane is still a controversial issue. Recent data on protein–protein interactions between yeast homologues of the a-subunit with subunits A and d have suggested different model of orientation of this protein.15
As suggested in this study, the proposed integral membrane properties of a2N1–402 could be explained by its amphiphilic character, which is also predicted by in silico analysis (Supporting Information Figure S2). According to Blobel's classification,41 integral membrane proteins can be divided into three groups: (i) monotopic proteins that interact with only one leaflet of the bilayer, (ii) bitopic proteins that cross the membrane only once, and (iii) polytopic proteins traversing the membrane various times. We hypothesize that a2N1–402 can interact with one leaflet of the bilayer and could actually be attached to one side of the membrane exposed to the cytoplasm. Thus, we propose that the cytosolic tail should be re-classified as an integral monotopic domain of the eight transmembrane spanning V-ATPase a2-subunit isoform. Examples of some of such domains could be found at http://blanco.biomol.uci.edu/Membrane_Proteins_xtal.html “Membrane Proteins of Known Structure” website. However, the complete and clear answer to questions regarding a-subunit folding and topology will be forthcoming only after its high-resolution structure has been solved by X-ray crystallography or other structural methods. Currently, we are performing crystallization screening trials for a2N1–402 protein in the presence of FC-12 (Merkulova and Marshansky, unpublished data), since determination of the high-resolution structure of a2N1–402 will also be an important step in our studies of the molecular details of its interaction with ARNO, which may lead to the development of specific reagents interfering with the multiple cellular pathways employing the crucial interplay between V-ATPase and small GTPases.
Materials and Methods
Reagents
If not otherwise specified, all reagents were from Sigma (St. Louis, MO). NU-PAGE gels and buffers were from Invitrogen (Carlsbad, CA). Protease inhibitor cocktail tablets (EDTA-free) were from Roche (Indianapolis, IN). TALON metal affinity resin was from Clontech (Mountain View, CA). HisTrap HP 5 mL, Superdex™ 200 HR 10/30 prepacked columns and Gel filtration calibration kits were from GE Healthcare (Pitscataway, NJ). iFOLD™ Protein Refolding System 2 was from EMD Biosciences Novagen. Popular detergent kit and ANAPOE® Master kit were from Anatrace (Maumee, OH).
DNA constructs and protein expression
Constructs corresponding to amino acid residues 1–58, 1–360, 1–371, 1–378, 1–393, 1–402, 134–393, 143–259, and 247–402 of the mouse V-ATPase a2-isoform were amplified using Expand High Fidelity PCR System (Roche, Indianapolis, IN) and subcloned into NdeI/NotI restriction sites of pET28b vector (Novagen, Gibbstown, NJ) in frame with a thrombin cleavable N-terminal 6XHis-tag. The resulting constructs contained a modified N-terminal 6XHis-tag (MSGSHHHHHHSSGLVPRGSH). Recombinant proteins were expressed in E. coli BL21(DE3) cells (Agilent, Santa Clara, CA) according to standard protocols.
Protein solubilization and purification in presence of 6M GuHCl
Cell pellets from 1 L of culture were resuspended in 40 mL of ice-cold lysis buffer A (50 mM HEPES-NaOH, pH 8.0, 50 mM NaCl, 1 mM MgCl2, 1 mM phenylmethylsulfonyl fluoride (PMSF), protease inhibitor cocktail tablets (Roche), 0.5 mg/mL lysozyme, and 25 U/mL Benzonase® Nuclease (Novagen)) and incubated on ice for 30 min. Then, 1.5 mL of 0.1 mm glass disruption beads (Research Products International Corp.) were added to cell suspension, and it was vortexed at maximum speed five times for 30 s, with 2 min incubations on ice between vortexings. The lysate was subsequently centrifuged at 4000g and 15,000g. 15,000g supernatant (soluble fraction) was discarded, whereas 4000g and 15,000g pellets (insoluble fraction) were resuspended and combined together in 20 mL (final volume) of solubilization buffer B (6 M GuHCl, 50 mM HEPES-NaOH, pH 8.0, 50 mM NaCl) followed by incubation with rotation in this buffer for 1 h at 4°C. The solubilizate was serially clarified by centrifugation at 4000g and 25,000g followed by filtration of the 25,000g supernatant through 0.22 μm Millex®GP syringe filter (Millipore). Finally, a2N1–402 recombinant protein was purified on Talon cobalt-affinity resin (BD Biosciences Clontech) according to manufacture instructions.
Screening for refolding conditions and large-scale refolding
About 95 different refolding conditions were tested using the iFOLD™ Protein Refolding System 2 (EMD Biosciences Novagen) according to the manufacturer's recommendations with the following modifications. Briefly, protein was purified as described above, except that preparation was scaled up so that we had enough amount of protein for screening (recommended 2 mL (minimum 960 μL) at concentration 5 mg/mL). It should be noted that IB-Prep™ Buffer and iFOLD™ Guanidine Denaturation Buffer, which are components of iFOLD™ Protein Refolding System 2 are not compatible with IMAC chromatography since they contain EDTA and should not be used if protein of interest will be purified by IMAC prior to refolding. Ten microliters of purified protein solution (at 5 mg/mL) was added to 490 μL of refolding solution in each well (except water blank well H7) of the 96-well refolding plate and immediately mixed by pipetting (final protein concentration, 0.1 mg/mL). The plates were then incubated with shaking at 24°C and 300 rpm on Thermomixer (Eppendorf) for 18 h. Then, 100 μL of refolding reaction was transferred into clear 96-well plate and absorbance of the solution was measured at 340 nm versus water blank by DTX 880 plate reader (Beckman Coulter). In addition, the remaining 400 μL of solutions in the wells of the original plate were visually reanalyzed for the presence or absence of the precipitated protein. Visually clear solutions were considered as successful refolding reactions and true positives. For large-scale refolding protein was purified by IMAC in presence of 6 M GuHCl (as described above), concentrated to 1.5 mL (at 2 mg/mL), reduced with 1 mM DTT and refolded by dropwise dilution into 10 mL of 1 M NDSB-256, 100 mM CHES-NaOH, pH 9.0, 1 mM DTT with constant vigorous stirring at RT. Protein was dialyzed against 100 mM CHES-NaOH, pH 9.0, 1 mM DTT immediately prior to use in its validation surface plasmon resonance assay.
Detergent screening and optimization of solubilization
Insoluble fraction was prepared as described above and resuspended in 50 mM CHES-NaOH, pH 9.0; 300 mM NaCl and 10 mM β-ME (final total protein concentration about 2 mg/mL). 80 or 90 μL of insoluble fraction suspension (equivalents of 1.3 and 1.5 mL of bacterial culture) were mixed with 20 μL of 10% detergents from Popular detergent kit (Anatrace) (2% final detergent concentration) or 10 μL of 10% detergents from ANAPOE® Master kit (Anatrace) (1% final detergent concentration) and shaked at 24°C and 1400 rpm on Thermomixer (Eppendorf) for 1 h. Then, 80 μL of solubilizate was transferred into clear 96-well plate and absorbance of the solution was measured at 340 nm versus water blank by DTX 880 plate reader (Beckman Coulter). Lower absorbance values would indicate more efficient solubilization. In addition, 10 μL of solubilizate was centrifuged at 13,000g RT for 15 min and 13,000g supernatant (detergent-soluble fraction) was analyzed by NuPAGE.
Optimization of solubilization conditions was always done at total protein concentration about 2 mg/mL in total volume of 100 μL after addition of FC-12. Solubilization and measurement of absorbance at 340 nm was done as above with the following modifications. Optimization of FC-12 concentration was done by resuspension of insoluble fractions in 50 mM CHES-NaOH, pH 9.0, 300 mM NaCl and 10 mM β-ME and addition of 10% FC-12 solution to a final concentrations of 0.1%, 0.25%, 0.5%, 1%, and 2%. Optimization of pH was done by resuspension of insoluble fractions in 50 mM NaPh, pH 7.0, 50 mM NaPh, pH 7.4, 50 mM NaPh, pH 8.0 or 50 mM CHES-NaOH, pH 9.0 and addition of 10% FC-12 solution to a final concentration of 1%. Optimization of NaCl concentration was done by resuspension of insoluble fractions in 50 mM CHES-NaOH, pH 9.0, 10 mM β-ME or 50 mM CHES-NaOH, pH 9.0, 150 mM NaCl, 10 mM β-ME or 50 mM CHES-NaOH, pH 9.0; 300 mM NaCl, 10 mM β-ME and addition of 10% FC-12 solution to a final concentration of 1%. Optimization of pH in presence of reducing agents was done by resuspension of insoluble fractions in 50 mM CHES-NaOH, pH 9.0 or 50 mM CHES-NaOH, pH 9.0, 10 mM β-ME or 50 mM NaPh, pH 8.0 or 50 mM NaPh, pH 8.0, 10 mM β-ME and addition of 10% FC-12 solution to a final concentration of 1%.
Protein solubilization and purification in presence of FC-12
Cell pellets from 1 L of culture were resuspended in 40 mL of ice-cold lysis buffer A (20 mM NaPh, pH 8.0, 150 mM NaCl, 1 mM MgCl2, 1 mM PMSF, protease inhibitor cocktail tablets (Roche), 0.5 mg/mL lysozyme and 25 U/mL Benzonase® Nuclease (Novagen)) and incubated on ice for 30 min. Then, 2 mL of 0.1 mm glass disruption beads (Research Products International Corp.) were added to cell suspension, and it was vortexed at maximum speed 5 times for 30 s, with 2 min incubations on ice between vortexings. The resultant lysate was serially centrifuged at 4000g and 15,000g. 15,000g supernatant (soluble fraction) was discarded, whereas 4000g and 15,000g pellets (insoluble fraction) were resuspended and combined together in 20 mL (final volume) of solubilization buffer B (20 mM NaPh, pH 8.0, 1 mM DTT, 1% β-OG), followed by incubation with rotation in this buffer for 1 h at 4°C. Solubilizate was serially clarified by centrifugation at 4000g and 15,000g. 15,000g supernatant (β-OG soluble fraction) was discarded, whereas 4000g and 15,000g pellets (β-OG insoluble fraction) were washed once with 20 mM NaPh, pH 8.0, 1 mM DTT to remove residual amounts of β-OG and resuspended in 30 mL (final volume) of solubilization buffer C (20 mM NaPh, pH 8.0, 1 mM DTT, 1% FC-12), followed by incubation with rotation in this buffer for 1 h at RT. Final solubilizate was serially clarified by centrifugation at 4000g and filtration of the 4000g supernatant through 0.22 μm Millex®GP syringe filter (Millipore). Finally, a2N1–402 recombinant protein was purified by sequential chromatography on HisTrap HP 5 mL and Superdex™ 200 HR 10/30 prepacked columns using “AKTA Purifier” system (GE Healthcare) according to manufacture instructions. Purified protein was analyzed by NuPAGE and major protein peak was concentrated by centrifugation in Amicon® Ultra 4 (10,000 MWCO) concentration unit (Millipore) and dialyzed extensively against 10 mM NaPh, pH 8.0, 1 mM DTT in Spectra/Por® dialysis tubes (3500 MWCO) (Spectrum Laboratories).
Estimation of protein–detergent micelles molecular mass by SEC
Superdex™ 200 HR 10/30 prepacked column was calibrated with the following standard proteins: ferritin (molecular mass, 440 kDa), aldolase (158 kDa), albumin (67 kDa), ovalbumin (43 kDa), and chymotrypsinogen A (25 kDa) (GE Healthcare). Blue Dextran 2000 was used to determine the void volume (Vo). The partition coefficients Kav for standard proteins and major peak 3 were calculated according to the equation Kav = (Ve − Vo)/(Vt − Vo), where Ve the elution volume of the protein, Vt the total volume of the packed bed, and Vo the void volume. There is a linear relationship between Kav and logarithm of protein molecular mass (log M),30 thus Kav for each protein standard was plotted against log M and calibration curve was build in Excel by linear regression analysis. Molecular mass for Kav of protein peak 3 was estimated from this calibration curve.
Lipid-protein cosedimentation assay
Azolectin (L-α-PC from soybean, Type II-S, 14–23% choline basis, Sigma) granules were resuspended by vortexing in water at concentration 15 mg/mL. Small unilamellar liposomes were generated by sonication of the lipid suspension in a water bath at room temperature (25°C) for 20 min. Large particles were removed by filtration through 0.2 μm Tuffryn® syringe filter (Pall Corporation). In the first round of cosedimentation, 100 μL of a2N1–402 protein (∼2 mg/mL in 10 mM Na2HPO4-NaH2PO4, pH 8.0, 1 mM DTT, 1% FC-12) were mixed with 900 μL of azolectin liposomes and incubated for 1 h at 4°C. Following incubation, the mixture was dialyzed extensively against 10 mM HEPES-NaOH, pH 8.0, 1 mM DTT in Spectra/Por® dialysis tubes (25,000 MWCO) (Spectrum Laboratories) to remove excess of FC-12 detergent and ultracentrifuged at 100,000g, 4°C, for 1 h. Proteins in the supernatant (S1) and pellet (P1) were analyzed by NuPAGE followed by Coomassie Blue R-250 staining. In the second round, 200 μL of S1-supernatant were mixed with 200 μL of freshly prepared azolectin liposomes, incubated overnight at 4°C and also ultracentrifuged at 100,000g, 4°C for 1 h. Proteins in the supernatant (S2) and pellet (P2) were again analyzed by NuPAGE followed by Coomassie Blue R-250 staining.
Transmission electron microscopy
Cells of E. coli BL21(DE3), grown for 17 h at 37°C (control) and cells of E. coli BL21(DE3) transformed with pET28b-a2N1–402 plasmid, induced with 0.1 mM IPTG for 4 h at 37°C, were pelleted by centrifugation at 13,000g for 2 min. Cell pellets (about 50 μL each) were washed once with PBS and then fixed at 1:20 (v/v) ratio in 2.0% glutaraldehyde in 0.1 M sodium cacodylate buffer, pH 7.4 (Electron Microscopy Sciences, Hatfield, PA) overnight at 4°C. They were rinsed in buffer, post-fixed in 1.0% osmium tetroxide in cacodylate buffer for 1 h at room temperature, rinsed in buffer again, then in distilled water and stained, en bloc, in an aqueous solution of 2.0% uranyl acetate for 1 h at room temperature. They were rinsed in distilled water, embedded in 2.0% agarose for ease of handling and dehydrated through a graded series of ethanol to 100%. They were then infiltrated with Epon resin (Ted Pella, Redding, CA) in a 1:1 solution of Epon:ethanol. The following day, they were placed in fresh Epon for several hours and then embedded in Epon overnight at 60°C. Thin sections were cut on a Reichert Ultracut E ultramicrotome, collected on formvar-coated grids, stained with uranyl acetate and lead citrate and examined in a JEOL JEM 1011 transmission electron microscope at 80 kV. Images were collected using an AMT (Advanced Microscopy Techniques, Danvers, MA) digital imaging system.
Circular dichroism spectroscopy
Steady state CD spectra were measured in the far UV-light (190–260 nm) using a CHIRASCAN spectropolarimeter (Applied Photophysics). Spectra were collected in a 60 μL quartz cell (Hellma) at 18°C at a step resolution of 1 nm. CD spectroscopy of recombinant a2N1–402 (1.0 mg/mL) was performed in 10 mM NaPh, pH 8.0, 1 mM DTT, 50 mM NaCl, 0.1% FC-12. The spectrum for the buffer was subtracted from the spectrum of a2N1–402. This baseline corrected spectrum was used as input for computer methods to obtain predictions of secondary structure. To analyze the CD spectrum the following algorithms were used: VARSLC,42 SELCON3,43 CONTINLL,44 and K2D.45 All methods as incorporated into the program Dicroprot46 and NeuralNet.47
Acknowledgments
The authors thank Dr. Dennis Brown for critical reading and constructive suggestions during preparation of this manuscript.
Glossary
Abbreviations:
- a2N1–402
N-terminal cytosolic tail of V-ATPase a2-subunit isoform
- CD
circular dichroism
- IBs
inclusion bodies
- PC
phosphtidylcholine
- SEC
size-exclusion chromatography
- TEM
transmission electron microscopy
- V-ATPase
vacuolar-type H+-ATPase.
References
- 1.Marshansky V, Futai M. The V-type H+-ATPase in vesicular trafficking: targeting, regulation and function. Curr Opin Cell Biol. 2008;20:415–426. doi: 10.1016/j.ceb.2008.03.015. [DOI] [PMC free article] [PubMed] [Google Scholar]
- 2.Forgac M. Vacuolar ATPases: rotary proton pumps in physiology and pathophysiology. Nat Rev Mol Cell Biol. 2007;8:917–929. doi: 10.1038/nrm2272. [DOI] [PubMed] [Google Scholar]
- 3.Miranda KC, Karet FE, Brown D. An extended nomenclature for mammalian V-ATPase subunit genes and splice variants. PLoS One. 2010;5:e9531. doi: 10.1371/journal.pone.0009531. [DOI] [PMC free article] [PubMed] [Google Scholar]
- 4.Marshansky V. The V-ATPase a2-subunit as a putative endosomal pH-sensor. Biochem Soc Trans. 2007;35:1092–1099. doi: 10.1042/BST0351092. [DOI] [PubMed] [Google Scholar]
- 5.Arai H, Terres G, Pink S, Forgac M. Topography and subunit stoichiometry of the coated vesicle proton pump. J Biol Chem. 1988;263:8796–8802. [PubMed] [Google Scholar]
- 6.Leng XH, Manolson MF, Liu Q, Forgac M. Site-directed mutagenesis of the 100-kDa subunit (Vph1p) of the yeast vacuolar (H+)-ATPase. J Biol Chem. 1996;271:22487–22493. doi: 10.1074/jbc.271.37.22487. [DOI] [PubMed] [Google Scholar]
- 7.Leng XH, Nishi T, Forgac M. Transmembrane topography of the 100-kDa a subunit (Vph1p) of the yeast vacuolar proton-translocating ATPase. J Biol Chem. 1999;274:14655–14661. doi: 10.1074/jbc.274.21.14655. [DOI] [PubMed] [Google Scholar]
- 8.Wang Y, Toei M, Forgac M. Analysis of the membrane topology of transmembrane segments in the C-terminal hydrophobic domain of the yeast vacuolar ATPase subunit a (Vph1p) by chemical modification. J Biol Chem. 2008;283:20696–20702. doi: 10.1074/jbc.M803258200. [DOI] [PMC free article] [PubMed] [Google Scholar]
- 9.Xu T, Vasilyeva E, Forgac M. Subunit interactions in the clathrin-coated vesicle vacuolar (H(+))-ATPase complex. J Biol Chem. 1999;274:28909–28915. doi: 10.1074/jbc.274.41.28909. [DOI] [PubMed] [Google Scholar]
- 10.Landolt-Marticorena C, Williams KM, Correa J, Chen W, Manolson MF. Evidence that the NH2 terminus of vph1p, an integral subunit of the V0 sector of the yeast V-ATPase, interacts directly with the Vma1p and Vma13p subunits of the V1 sector. J Biol Chem. 2000;275:15449–15457. doi: 10.1074/jbc.M000207200. [DOI] [PubMed] [Google Scholar]
- 11.Inoue T, Forgac M. Cysteine-mediated cross-linking indicates that subunit C of the V-ATPase is in close proximity to subunits E and G of the V1 domain and subunit a of the V0 domain. J Biol Chem. 2005;280:27896–27903. doi: 10.1074/jbc.M504890200. [DOI] [PubMed] [Google Scholar]
- 12.Qi J, Forgac M. Function and subunit interactions of the N-terminal domain of subunit a (Vph1p) of the yeast V-ATPase. J Biol Chem. 2008;283:19274–19282. doi: 10.1074/jbc.M802442200. [DOI] [PMC free article] [PubMed] [Google Scholar]
- 13.Norgett EE, Borthwick KJ, Al-Lamki RS, Su Y, Smith AN, Karet FE. V1 and V0 domains of the human H+-ATPase are linked by an interaction between the G and a subunits. J Biol Chem. 2007;282:14421–14427. doi: 10.1074/jbc.M701226200. [DOI] [PubMed] [Google Scholar]
- 14.Ediger B, Melman SD, Pappas DL, Jr, Finch M, Applen J, Parra KJ. The tether connecting cytosolic (N terminus) and membrane (C terminus) domains of yeast V-ATPase subunit a (Vph1) is required for assembly of V0 subunit d. J Biol Chem. 2009;284:19522–19532. doi: 10.1074/jbc.M109.013375. [DOI] [PMC free article] [PubMed] [Google Scholar]
- 15.Thaker YR, Hunke C, Yau YH, Shochat SG, Li Y, Grüber G. Association of the eukaryotic V1VO ATPase subunits a with d and d with A. FEBS Lett. 2009;583:1090–1095. doi: 10.1016/j.febslet.2009.03.013. [DOI] [PubMed] [Google Scholar]
- 16.Lau WC, Rubinstein JL. Structure of intact Thermus thermophilus V-ATPase by cryo-EM reveals organization of the membrane-bound V(O) motor. Proc Natl Acad Sci USA. 2010;107:1367–1372. doi: 10.1073/pnas.0911085107. [DOI] [PMC free article] [PubMed] [Google Scholar]
- 17.Lu M, Holliday LS, Zhang L, Dunn WA, Jr, Gluck SL. Interaction between aldolase and vacuolar H+-ATPase: evidence for direct coupling of glycolysis to the ATP-hydrolyzing proton pump. J Biol Chem. 2001;276:30407–30413. doi: 10.1074/jbc.M008768200. [DOI] [PubMed] [Google Scholar]
- 18.Lu M, Ammar D, Ives H, Albrecht F, Gluck SL. Physical interaction between aldolase and vacuolar H+-ATPase is essential for the assembly and activity of the proton pump. J Biol Chem. 2007;282:24495–24503. doi: 10.1074/jbc.M702598200. [DOI] [PubMed] [Google Scholar]
- 19.Su Y, Zhou A, Al-Lamki RS, Karet FE. The a-subunit of the V-type H+-ATPase interacts with phosphofructokinase-1 in humans. J Biol Chem. 2003;278:20013–20018. doi: 10.1074/jbc.M210077200. [DOI] [PubMed] [Google Scholar]
- 20.Su Y, Blake-Palmer KG, Sorrell S, Javid B, Bowers K, Zhou A, Chang SH, Qamar S, Karet FE. Human H+ATPase a4 subunit mutations causing renal tubular acidosis reveal a role for interaction with phosphofructokinase-1. Am J Physiol Renal Physiol. 2008;295:F950–F958. doi: 10.1152/ajprenal.90258.2008. [DOI] [PMC free article] [PubMed] [Google Scholar]
- 21.Zhang W, Wang D, Volk E, Bellen HJ, Hiesinger PR, Quiocho FA. V-ATPase V0 sector subunit a1 in neurons is a target of calmodulin. J Biol Chem. 2008;283:294–300. doi: 10.1074/jbc.M708058200. [DOI] [PMC free article] [PubMed] [Google Scholar]
- 22.Hiesinger PR, Fayyazuddin A, Mehta SQ, Rosenmund T, Schulze KL, Zhai RG, Verstreken P, Cao Y, Zhou Y, Kunz J, Bellen HJ. The v-ATPase V0 subunit a1 is required for a late step in synaptic vesicle exocytosis in Drosophila. Cell. 2005;121:607–620. doi: 10.1016/j.cell.2005.03.012. [DOI] [PMC free article] [PubMed] [Google Scholar]
- 23.Hurtado-Lorenzo A, Skinner M, El Annan J, Futai M, Sun-Wada GH, Bourgoin S, Casanova J, Wildeman A, Bechoua S, Ausiello DA, Brown D, Marshansky V. V-ATPase interacts with ARNO and Arf6 in early endosomes and regulates the protein degradative pathway. Nat Cell Biol. 2006;8:124–136. doi: 10.1038/ncb1348. [DOI] [PubMed] [Google Scholar]
- 24.Merkulova M, Bakulina A, Thaker YR, Gruber G, Marshansky V. Specific motifs of the V-ATPase a2-subunit isoform interact with catalytic regulatory domains of ARNO. Biochim Biophys Acta. 2010;1797:1398–1409. doi: 10.1016/j.bbabio.2010.02.009. [DOI] [PubMed] [Google Scholar]
- 25.Ochotny N, van Vliet A, Chan N, Yao Y, Morel M, Kartner N, von Schroeder HP, Heersche JN, Manolson MF. Effects of human a3 and a4 mutations that result in osteopetrosis and distal renal tubular acidosis on yeast V-ATPase expression and activity. J Biol Chem. 2006;281:26102–26111. doi: 10.1074/jbc.M601118200. [DOI] [PubMed] [Google Scholar]
- 26.Yamamoto M, Unzai S, Saijo S, Ito K, Mizutani K, Suno-Ikeda C, Yabuki-Miyata Y, Terada T, Toyama M, Shirouzu M, Kobayashi T, Kakinuma Y, Yamato I, Yokoyama S, Iwata S, Murata T. Interaction and stoichiometry of the peripheral stalk subunits NtpE and NtpF and the N-terminal hydrophilic domain of NtpI of Enterococcus hirae V-ATPase. J Biol Chem. 2008;283:19422–19431. doi: 10.1074/jbc.M801772200. [DOI] [PubMed] [Google Scholar]
- 27.Sambrook J, Russel DW. Molecular cloning: a laboratory manual. New York: Cold Spring Harbor Laboratory Press; 2001. [Google Scholar]
- 28.Vincentelli R, Canaan S, Campanacci V, Valencia C, Maurin D, Frassinetti F, Scappucini-Calvo L, Bourne Y, Cambillau C, Bignon C. High-throughput automated refolding screening of inclusion bodies. Protein Sci. 2004;13:2782–2792. doi: 10.1110/ps.04806004. [DOI] [PMC free article] [PubMed] [Google Scholar]
- 29.Ricker RD, Sandoval LA. Fast, reproducible size-exclusion chromatography of biological macromolecules. J Chromatogr A. 1996;743:43–50. doi: 10.1016/0021-9673(96)00283-x. [DOI] [PubMed] [Google Scholar]
- 30.Laurent T, Killander J. A theory of gel filtration and its experimental verification. J Chromatography. 1964;14:317–330. [Google Scholar]
- 31.Kunji ER, Harding M, Butler PJ, Akamine P. Determination of the molecular mass and dimensions of membrane proteins by size exclusion chromatography. Methods. 2008;46:62–72. doi: 10.1016/j.ymeth.2008.10.020. [DOI] [PubMed] [Google Scholar]
- 32.Colacicco G, Rapport MM. A simplified preparation of phosphatidyl inositol. J Lipid Res. 1967;8:513–515. [PubMed] [Google Scholar]
- 33.White MA, Clark KM, Grayhack EJ, Dumont ME. Characteristics affecting expression and solubilization of yeast membrane proteins. J Mol Biol. 2007;365:621–636. doi: 10.1016/j.jmb.2006.10.004. [DOI] [PMC free article] [PubMed] [Google Scholar]
- 34.Bane SE, Velasquez JE, Robinson AS. Expression and purification of milligram levels of inactive G-protein coupled receptors in E. coli. Protein Expr Purif. 2007;52:348–355. doi: 10.1016/j.pep.2006.10.017. [DOI] [PMC free article] [PubMed] [Google Scholar]
- 35.Ren H, Yu D, Ge B, Cook B, Xu Z, Zhang S. High-level production, solubilization and purification of synthetic human GPCR chemokine receptors CCR5, CCR3, CXCR4 and CX3CR1. PLoS One. 2009;4:e4509. doi: 10.1371/journal.pone.0004509. [DOI] [PMC free article] [PubMed] [Google Scholar]
- 36.Williams DC, van Frank RM, Muth WL, Burnett JP. Cytoplasmic inclusion bodies in Escherichia coli producing biosynthetic human insulin proteins. Science. 1982;215:687–689. doi: 10.1126/science.7036343. [DOI] [PubMed] [Google Scholar]
- 37.Carrio M, Gonzalez-Montalban N, Vera A, Villaverde A, Ventura S. Amyloid-like properties of bacterial inclusion bodies. J Mol Biol. 2005;347:1025–1037. doi: 10.1016/j.jmb.2005.02.030. [DOI] [PubMed] [Google Scholar]
- 38.Zhang Z, Zheng Y, Mazon H, Milgrom E, Kitagawa N, Kish-Trier E, Heck AJ, Kane PM, Wilkens S. Structure of the yeast vacuolar ATPase. J Biol Chem. 2008;283:35983–35995. doi: 10.1074/jbc.M805345200. [DOI] [PMC free article] [PubMed] [Google Scholar]
- 39.Diepholz M, Venzke D, Prinz S, Batisse C, Florchinger B, Rossle M, Svergun DI, Bottcher B, Fethiere J. A different conformation for EGC stator subcomplex in solution and in the assembled yeast V-ATPase: possible implications for regulatory disassembly. Structure. 2008;16:1789–1798. doi: 10.1016/j.str.2008.09.010. [DOI] [PubMed] [Google Scholar]
- 40.Muench SP, Huss M, Song CF, Phillips C, Wieczorek H, Trinick J, Harrison MA. Cryo-electron microscopy of the vacuolar ATPase motor reveals its mechanical and regulatory complexity. J Mol Biol. 2009;386:989–999. doi: 10.1016/j.jmb.2009.01.014. [DOI] [PubMed] [Google Scholar]
- 41.Blobel G. Intracellular protein topogenesis. Proc Natl Acad Sci USA. 1980;77:1496–1500. doi: 10.1073/pnas.77.3.1496. [DOI] [PMC free article] [PubMed] [Google Scholar]
- 42.Manavalan P, Johnson WC., Jr Variable selection method improves the prediction of protein secondary structure from circular dichroism spectra. Anal Biochem. 1987;167:76–85. doi: 10.1016/0003-2697(87)90135-7. [DOI] [PubMed] [Google Scholar]
- 43.Sreerama N, Woody RW. A self-consistent method for the analysis of protein secondary structure from circular dichroism. Anal Biochem. 1993;209:32–44. doi: 10.1006/abio.1993.1079. [DOI] [PubMed] [Google Scholar]
- 44.Provencher SW. A constrained regularization method of inverting data represented by linear algebraic or integral equations. Comput Phys Commun. 1982;27:213–227. [Google Scholar]
- 45.Andrade MA, Chacon P, Merelo JJ, Moran F. Evaluation of secondary structure of proteins from UV circular dichroism spectra using an unsupervised learning neural network. Protein Eng. 1993;6:383–390. doi: 10.1093/protein/6.4.383. [DOI] [PubMed] [Google Scholar]
- 46.Deleage G, Geourjon C. An interactive graphic program for calculating the secondary structure content of proteins from circular dichroism spectrum. Comput Appl Biosci. 1993;9:197–199. doi: 10.1093/bioinformatics/9.2.197. [DOI] [PubMed] [Google Scholar]
- 47.Bohm G, Muhr R, Jaenicke R. Quantitative analysis of protein far UV circular dichroism spectra by neural networks. Protein Eng. 1992;5:191–195. doi: 10.1093/protein/5.3.191. [DOI] [PubMed] [Google Scholar]