Abstract
HIV-1 Vpu is an 81-residue protein with a single N-terminal transmembrane (TM) helical segment that is involved in the release of new virions from host cell membranes. Vpu and its TM segment form ion channels in phospholipid bilayers, presumably by oligomerization of TM helices into a pore-like structure. We describe measurements that provide new constraints on the oligomerization state and supramolecular structure of residues 1–40 of Vpu (Vpu1–40), including analytical ultracentrifugation measurements to investigate oligomerization in detergent micelles, photo-induced crosslinking experiments to investigate oligomerization in bilayers, and solid-state nuclear magnetic resonance measurements to obtain constraints on intermolecular contacts between and orientations of TM helices in bilayers. From these data, we develop molecular models for Vpu TM oligomers. The data indicate that a variety of oligomers coexist in phospholipid bilayers, so that a unique supramolecular structure can not be defined. Nonetheless, since oligomers of various sizes have similar intermolecular contacts and orientations, molecular models developed from our data are most likely representative of Vpu TM oligomers that exist in host cell membranes.
Keywords: solid-state NMR, analytical ultracentrifugation, photochemical crosslinking, membrane protein structure
Introduction
Vpu is an 81-residue integral membrane protein encoded by the HIV-1 genome for which two distinct functions have been identified1–3: (i) downregulation of cell-surface CD4 expression, produced by mediating the interaction of newly synthesized CD4 with βTrCP, a component of a ubiquitin ligase complex4–8; (ii) enhancement of the release of new virions from host cell surfaces.9 The second function depends principally on the single transmembrane TM segment of Vpu, contained within residues 1–30, as sequence alterations in the TM segment have been shown to interfere with this function.2 Full-length Vpu and various N-terminal peptides containing the TM segment have been shown to form cation-selective channels in model membranes1,10–15 and in cells.12 These ion channels presumably form by association of α-helical TM segments into homo-oligomeric bundles, with ions passing through the central pore of the helix bundle. The precise number of Vpu molecules that form active ion channels and the precise molecular structures of these ion channels have not yet been established unequivocally by experiments, although considerable experimental information is available about the structure of monomeric Vpu and its orientation relative to bilayer membranes from nuclear magnetic resonance (NMR) and other measurements.1,11,16–22 Gel filtration chromatography suggests a pentameric structure,23 whereas gel electrophoresis suggests oligomers in the tetramer-to-hexamer range.17 Computational modeling of oligomers of Vpu TM segments has been carried out by several groups, resulting in detailed models for tetramers, pentamers, and hexamers.10,24–29 Predictions of channel conductance based on these models favor a pentamer or larger oligomer as the predominant channel.10,25 Computational studies include investigations of interactions of channel-blocking compounds with Vpu ion channels,30 effects of site-specific mutations on secondary structure and supramolecular structure,31 and channel selectivity.32
It has been suggested that homo-oligomeric Vpu ion channels are responsible for the role of Vpu in viral budding.12 Support for this suggestion comes from observations that sequence modifications that impair ion channel activity also impair viral release12 and that channel-blocking compounds also inhibit viral budding in cells that express Vpu.33 A specific mechanism by which homo-oligomeric Vpu channels affect viral budding has not been established. Experimental evidence has also been obtained that Vpu enhances viral budding by interfering with the endogenous potassium channel TASK-1,34 with sequence homology suggesting that HIV-1 Vpu may have evolved from the N-terminal TM domain of TASK-1 and may function by forming hetero-oligomers with TASK-1 in host cell membranes. Recent experiments indicate that Vpu facilitates viral budding through interactions with host cell proteins that otherwise inhibit viral budding,35 in particular an integral membrane protein dubbed tetherin, CD317, or BST-2.36,37 Tetherin tethers budding virions to host cells by linking the viral and host cell membranes.38 Vpu interferes with tetherin by targeting tetherin for degradation, in a manner similar to that by which Vpu downregulates CD4.39,40 Sequence variations in the TM domain of tetherin that affect sensitivity to Vpu have been identified.41,42 Formation of Vpu/tetherin hetero-oligomers through direct interactions between their TM domains may therefore be essential for Vpu function, and these hetero-oligomers may be structurally related to Vpu homo-oligomers. A proposed therapeutic strategy is to use “decoy” peptides to sequester Vpu through formation of unproductive hetero-oligomers, allowing tetherin to inhibit viral release from infected cells even in the presence of Vpu.43
In this article, we describe measurements that provide new experimental information about the oligomerization state and supramolecular structure of Vpu TM peptides in phospholipid bilayers. Figure 1 shows the sequences of full-length Vpu and the Vpu1–40 peptides used in our experiments, along with isotopic labeling patterns for solid-state NMR measurements. Specifically, we have used analytical ultracentrifugation (AUC) to investigate oligomerization of Vpu1–40 in detergent micelles, and photo-induced crosslinking of unmodified proteins (PICUP) experiments to investigate oligomerization of Vpu1–40 in bilayers. These measurements indicate the presence of a variety of coexisting oligomers, ranging at least from tetramers to heptamers in bilayers. We have also used solid-state NMR techniques to obtain constraints on intermolecular contacts between and orientations of TM helices in bilayers. We have then used simple molecular modeling techniques to develop structural models for symmetric oligomers that can be compared with the solid-state NMR data. Although the experimental data reported below are not sufficient to derive a unique structural model for Vpu1–40 oligomers, only a small number of models are consistent with these data. Although the current understanding of the biological function of Vpu does not favor a direct functional role for Vpu homo-oligomers, as described above, such homo-oligomers are likely to exist in host cell membranes, and intermolecular interactions of the TM segments of Vpu with homologous TM segments are likely to be essential for biological function. Moreover, oligomerization and ion channel formation by Vpu is of inherent interest and is relevant to the more general issues of viroporin structure and function.44–47
Figure 1.
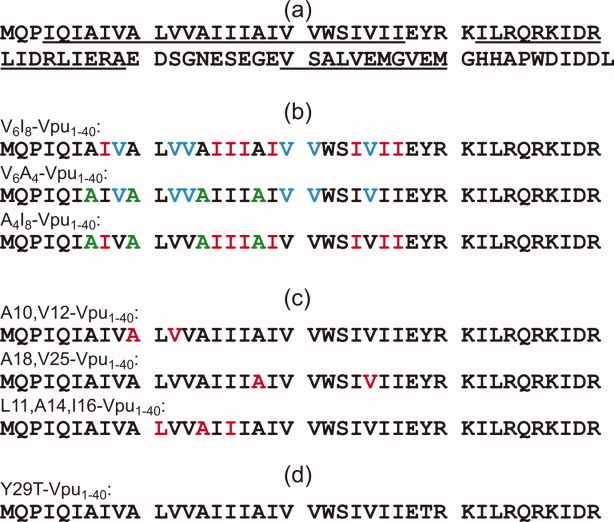
(a) Full-length HIV-1 Vpu sequence, with three helical segments underlined. Location of N-terminal, transmembrane helical segment is based on solid-state NMR data of Sharpe et al.17 Central and C-terminal helical segments are based on data of Opella and coworkers.1,11 (b) Vpu1–40 peptides used in 2D CHHC measurements of intermolecular contacts, shown in Figure 8. Samples contain 1:1 mixtures of peptides with uniform 15N,13C-labeling of six Val (cyan), eight Ile (red), or four Ala (green) residues. (c) Vpu1–40 peptides used in DIPSHIFT measurements of molecular orientation, shown in Figures 9 and 10. Uniformly labeled residues are indicated in red. (d) Y29T-Vpu1–40 peptide used in analytical ultracentrifugation and PICUP experiments, shown in Figures 2–7. [Color figure can be viewed in the online issue, which is available at wileyonlinelibrary.com.]
Results
Vpu1–40 oligomerization in C8E5 micelles
To determine the size of Vpu1–40 oligomers, we first applied AUC methods to solutions containing Vpu1–40 in octyl-pentaoxyethylene (C8E5) micelles. C8E5 micelles were chosen because they are neutrally buoyant under our buffer conditions. Sedimentation velocity experiments at various peptide loading concentrations indicate the presence of more than one species. At a loading concentration of 130 μM in the presence of 10 mM C8E5 [Fig. 2(a)], the distribution of sedimentation coefficients c(s) derived by fitting the sedimentation velocity data shows multiple species having sedimentation coefficients in the range of 0.8–2.0 S. At a similar loading concentration (100 μM), but in the presence of 40 mM C8E5, only two species were observed, with sedimentation coefficients of 0.42 S and 0.74 S, indicating that the increased detergent concentration leads to better solubilization of Vpu1–40. The proportion of the more rapidly sedimenting species appears to decrease when the protein concentration is halved to 52 μM, further highlighting the importance of the peptide:detergent ratio. Similar experiments carried out on the Y29T mutant produced essentially identical observations [Fig. 2(b)]. Our motivation for examining Y29T-Vpu1–40 is explained below.
Figure 2.
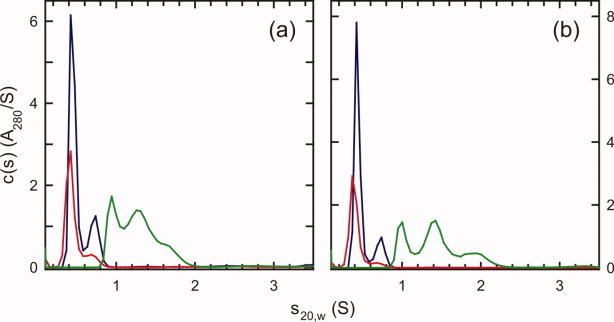
(a) Distributions of sedimentation coefficients c(s) derived from sedimentation velocity data for wild-type Vpu1–40 at loading concentrations of 52 μM with 40 mM C8E5 (red line), 100 μM with 40 mM C8E5 (blue line), and 130 μM with 10 mM C8E5 (green line). A280 is the optical absorbance at 280 nm. (b) Distributions for Y29T-Vpu1–40 at loading concentrations of 54 μM with 40 mM C8E5 (red line), 107 μM with 40 mM C8E5 (blue line), and 137 μM with 10 mM C8E5 (green line). Data were collected at 50 krpm and 20.0°C and analyzed with SEDFIT software. [Color figure can be viewed in the online issue, which is available at wileyonlinelibrary.com.]
Sedimentation equilibrium experiments were carried out to obtain estimates of the peptide contribution to the molecular masses of the peptide:detergent complexes. Sedimentation equilibrium data and their analyses are shown in Figures S2–S6 of the Supporting Information. Overall, these data are qualitatively consistent with the sedimentation velocity data. Steep concentration gradients at 10 mM C8E5 indicate high molecular mass species (Supporting Information Figure S2a,b); shallow concentration gradients at 40 mM C8E5 indicate species with lower molecular mass (Supporting Information Figure S2c). Sedimentation equilibrium data at each sample and detergent concentration were initially modeled in terms of a single species. Poor fits were obtained (Supporting Information Figure S2), indicating the presence of more than one species. Analysis in terms of two noninteracting species with masses M1 and M2 led to better fits, with values of M1 such that the smaller species is either a Vpu1–40 dimer or a monomer, depending on the C8E5 concentration. Fixing M1 to these values led to equally good fits (Supporting Information Figure S3), but with nonintegral and variable stoichiometries for the higher oligomer mass M2. Accordingly, a model incorporating three noninteracting species implementing mass conservation was used to obtain a qualitative description of the data (Supporting Information Figures S4–S6). At 10 mM C8E5, good fits were obtained when these species corresponded to dimers, tetramers and hexamers [Fig. 3(a,b)]. At 40 mM C8E5, good fits were obtained when these species corresponded to monomers, dimers and tetramers [Fig. 3(c)]. It is clear that Vpu1–40 oligomers in C8E5 micelles are polydisperse and that the distributions of oligomerization states depend on both the peptide and the detergent concentrations. Comparing data in Figures 2 and 3, we conclude that the 0.42 S species observed in 40 mM C8E5 corresponds to a detergent-solubilized Vpu1–40 monomer, whereas the 0.74 S species corresponds to a detergent-solubilized dimer. Similarly, the smallest species at ∼0.9 S observed in the presence of 10 mM C8E5 represents a detergent-solubilized dimer.
Figure 3.
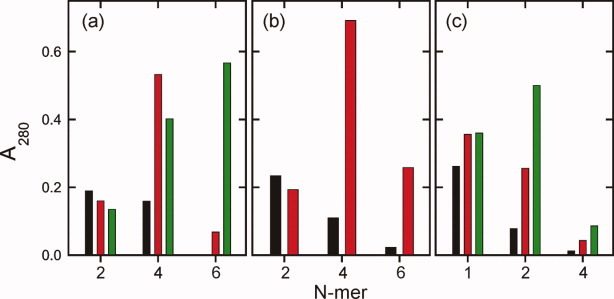
Possible distributions of Vpu1–40 oligomers in C8E5 micelles, derived by fitting sedimentation equilibrium data to three discrete species of fixed molecular mass and including mass conservation as a constraint. Vertical scales are absolute absorbances at 280 nm for each species. (a) Distributions of Y29T-Vpu1–40 dimers, tetramers, and hexamers at 10 mM C8E5 and peptide loading concentrations of 50, 110, and 160 μM (black, red, and green bars, respectively). (b) Distributions of wild-type Vpu1–40 dimers, tetramers, and hexamers at 10 mM C8E5 and peptide loading concentrations of 45 and 140 μM (black and red bars, respectively). (c) Distributions of Y29T-Vpu1–40 monomers, dimers, and tetramers at 40 mM C8E5 and peptide loading concentrations of 50, 95, and 140 μM (black, red, and green bars, respectively). [Color figure can be viewed in the online issue, which is available at wileyonlinelibrary.com.]
Vpu1–40 oligomerization in DOPC/DOPG bilayers
To probe the oligomeric state of Vpu1–40 in lipid bilayers, we used the PICUP technique48,49 in analogy to experiments by Bitan and Teplow in which PICUP has been used to characterize oligomer size distributions in solutions of amyloid-forming peptides.50,51 Bilayers for PICUP experiments and solid-state NMR experiments were comprised of DOPC and DOPG, in a 9:1 molar ratio. This lipid composition was chosen for consistency with previous solid-state NMR studies.11,17 PICUP has the advantages of high efficiency and short reaction times, so that crosslinking between different oligomers that encounter one another through translational diffusion can be minimized. In addition, PICUP does not require chemical modifications to the peptide. Analysis of PICUP reaction products for wild-type Vpu1–40 by MALDI-TOF mass spectrometry [Fig. 4(a)] indicate that the reaction begins within 1 s. Products corresponding to dimers, trimers, tetramers, pentamers, and hexamers (mass peaks at ∼9 kDa, 14 kDa, 19 kDa, 24 kDa, and 29 kDa, respectively) appear at reaction times longer than 1 s. The intensities of the higher molecular weight peak increase with increasing reaction time. The fact that peak areas decrease monotonically with increasing mass, even at a 300 s reaction time, may be due to a lower efficiency for ionization and detection of higher molecular weight species in the MALDI-TOF measurement, rather than a monotonically decreasing population of higher oligomers. Thus, we can not determine the relative populations of various oligomers from the MALDI-TOF data. However, these data clearly show that the PICUP reaction crosslinks at least six Vpu1–40 molecules in bilayers, supporting the existence of oligomers at least as large as hexamers.
Figure 4.
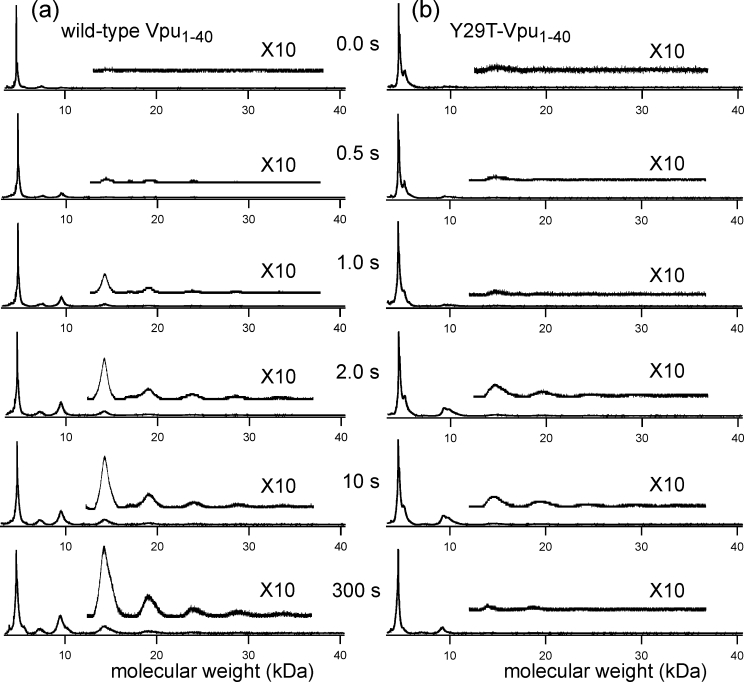
MALDI-TOF mass spectra of PICUP reaction products after the indicated reaction times. Results are shown for crosslinking experiments on wild-type Vpu1–40 (a) and Y29T-Vpu1–40 (b). PICUP was performed with a 0.3% mole fraction of peptides in DOPC/DOPG bilayers.
Although the full details of the photochemistry that occurs in PICUP experiments have not been determined, it has been suggested that tyrosyl radicals are one of the important reactive side-chain species, produced by oxidation by photo-generated Ru(III).49 Y29, the only tyrosine residue in Vpu1–40, is located outside the TM segment and is presumably in the aqueous phase, where it would be readily accessible to oxidation. Therefore, we examined Y29T-Vpu1–40 to see whether this mutant might be resistant to crosslinking. Results in Figure 4(b) indicate that crosslinking does occur, but with reduced efficiency relative to wild-type Vpu1–40, that is, the areas of mass peaks corresponding to trimers and higher oligomers are reduced. Thus, Y29 is apparently an important residue for the PICUP reactions, but is not the only reactive residue.
PICUP products were also analyzed by SDS-PAGE, as shown in Figures 5 and 6. A weak monomer band, with an apparent molecular weight of ∼4 kDa (somewhat less than the expected value of 4.65 kDa), is visible in the control lanes for both wild-type Vpu1–40 [Fig. 5(a)] and Y29T-Vpu1–40 [Fig. 6(a)], in which 50 μM of peptide in 2% LDS buffer was loaded on the gel. The control lanes also show higher molecular weight species, including a broad band extending from ∼8 kDa to ∼12 kDa that we assign to dimers and trimers, and bands at ∼14 kDa and 17 kDa that we assign to tetramers and pentamers. The 0.0 s PICUP lanes are similar to the control lanes, except with lower intensities due to lower peptide quantities. With increasing PICUP reaction times, bands assigned to tetramers, pentamers, and hexamers (apparent molecular weights of 14 kDa, 17 kDa, and 19 kDa, respectively), as well as higher oligomers, become more intense. The development of these bands is clearly revealed in the densitometer traces in Figures 5(b) and 6(b). Relative abundances of oligomers at reaction times from 0.0 to 2.0 s, determined by deconvolution of the densitometer traces, are shown in Figures 5(c) and 6(c). Oligomers ranging from tetramers to heptamers have comparable abundances at a 2.0 s reaction time, for both wild-type Vpu1–40 and Y29T-Vpu1–40.
Figure 5.
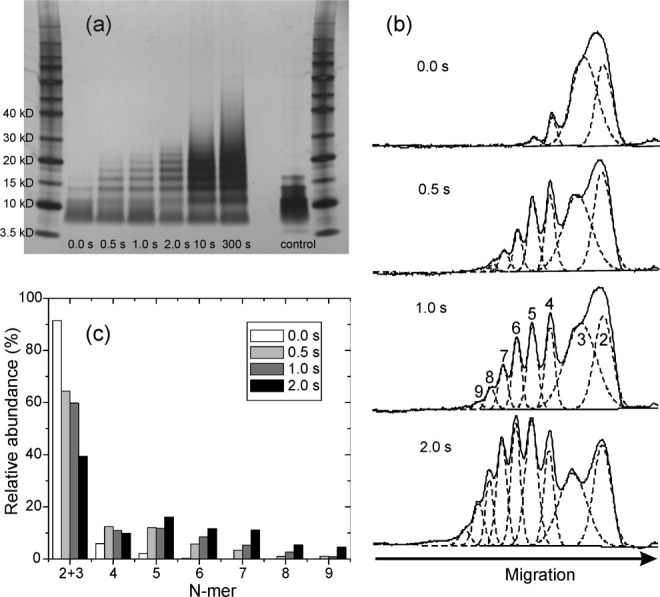
SDS-PAGE analysis of PICUP reaction products after the indicated reaction times, for wild-type Vpu1–40. (a) Scanned image of the gel, with molecular weight markers in the far left and far right lanes. The control lane is purified Vpu1–40 directly dissolved in the gel loading buffer at 50 μM peptide concentration, without exposure to bilayers or crosslinking reagents. (b) Densitometry profiles for lanes 2–5, with fits to Gaussian peaks (dashed lines) that represent the indicated N-mers. (c) Apparent relative abundances of N-mers, determined from the fits in panel (b).
Figure 6.
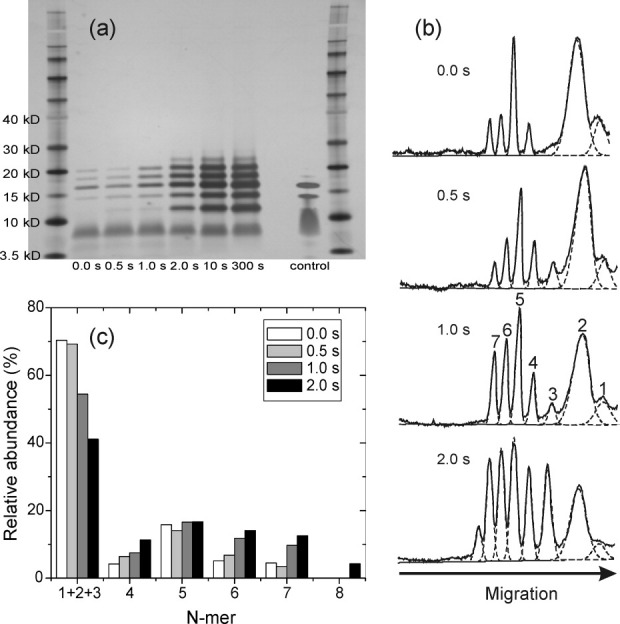
Same as Figure 5, but for Y29T-Vpu1–40.
We are not surprised that Vpu1–40 and Y29T-Vpu1–40 oligomers migrate on SDS-PAGE gels at apparent molecular weights that differ significantly from their true molecular weights, or that differences in apparent molecular weights for oligomers of increasing size are not constant. Anomalous migration of integral membrane proteins is a common observation.52
Wild-type Vpu1–40 shows a broadening of each band with increasing PICUP reaction time, which is not observed for Y29T-Vpu1–40. At reaction times longer than 2.0 s, wild-type Vpu1–40 also shows more intensity at molecular weights above that of a heptamer than does Y29T-Vpu1–40. We attribute these differences to crosslinking reactions that involve Y29. Since Y29 is outside the TM segment of Vpu1–40, we suggest that Y29 may form crosslinks between peptide molecules in different oligomers within the bilayer, and possibly crosslinks to phospholipid molecules, that contribute to the broadening of the SDS-PAGE bands and the appearance of higher molecular weight species at long reaction times. Since SDS-PAGE experiments on both wild-type Vpu1–40 and Y29T-Vpu1–40 show prominent oligomer bands up to a heptamer band after only 1.0–2.0 s reaction times, we conclude that oligomers in bilayers can be at least as large as heptamers. The fact that pentamer bands are especially pronounced at short reaction times for Y29T-Vpu1–40 and are readily observed for both wild-type Vpu1–40 and Y29T-Vpu1–40 in the uncrosslinked control lanes suggests that pentamers are especially stable.
Data in Figures 4–6 were obtained with Vpu1–40 concentrations of 0.3 mol% with respect to phospholipids, which we considered sufficiently low that crosslinking between oligomers would be insignificant. Additional experiments at 0.1 mol%, 1.0 mol%, and 3.0 mol% wild-type Vpu1–40 (Supporting Information Figures S7–S9) support this assumption. Even at 0.1 mol% Vpu1–40, clear tetramer, pentamer, and hexamer bands are observed by SDS-PAGE after a reaction time of only 0.5 s. SDS-PAGE results are similar over the entire 30-fold range of Vpu1–40 concentrations.
Structural constraints from solid-state NMR
We used two types of solid-state NMR measurements to obtain experimental constraints on the molecular structure of wild-type Vpu1–40 oligomers in bilayers. Constraints on intermolecular contacts were derived from 2D CHHC and 2D spin diffusion spectra. Constraints on the orientations of TM helices were derived from DIPSHIFT data. The NMR techniques are described in Materials and Methods section.
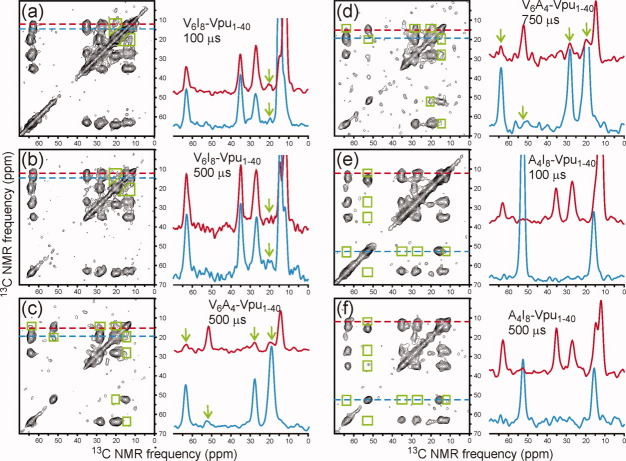
Figure 7 shows 2D CHHC spectra of samples containing 1:1 mixtures of multiply labeled Vpu1–40 in DOPC/DOPG MLVs. 13C chemical shift assignments for these spectra are given in Ref. 17. In these experiments, each Vpu1–40 molecule contained six uniformly labeled Val residues, eight uniformly labeled Ile residues, or four uniformly labeled Ala residues [see Fig. 1(b)]. Inter-residue crosspeaks in the 2D CHHC spectra, if observed, must therefore arise from intermolecular contacts. The most obvious intermolecular contacts were detected in the V6A4-Vpu1–40 sample, where clear crosspeaks are seen between Cγ of Val and Cα of Ala [green arrows in blue slice in Fig. 7(c)] and between Cα, Cβ, and Cγ of Val and Cβ of Ala [green arrows in red slice in Figure 7(c,d)]. Intermolecular contacts were also detected in the V6I8-Vpu1–40 sample, where crosspeaks are seen between Cγ of Val and Cγ2 and Cδ of Ile [green arrows in red and blue slices in Figure 7(a,b)]. In this case, the crosspeaks are broad and poorly resolved because of the breadth of the Val Cγ signals and the Ile Cγ2 and Cδ signals, as well as the relatively small separation of these signals from one another. Nonetheless, the intermolecular crosspeak signals are clearly present. In contrast, no intermolecular contacts were detected in the A4I8-Vpu1–40 sample. No intermolecular crosspeak signals above the noise level are seen in the Ala Cα (blue) and Ile Cδ (red) slices in Figure 7(e,f), or in any of the other positions where intermolecular crosspeaks might be found (green rectangles).
Figure 7.
2D CHHC spectra of V6I8-Vpu1–40 (a,b) V6A4-Vpu1–40 (c,d) and A4I8-Vpu1–40 (e,f) in DOPC/DOPG bilayers at various mixing times, with 1D slices at color-coded positions. Green polygons in the 2D spectra indicate regions where intermolecular crosspeaks would appear if intermolecular 13C-13C distances were less than roughly 4 Å. Green arrows in the 1D slices indicate observed intermolecular crosspeaks. 2D CHHC experiments were performed at −50°C.
As explained in Materials and Methods section, 2D CHHC experiments were performed at low temperatures (−50°C). To test whether the intermolecular contacts detected in 2D CHHC spectra were also present at higher temperatures, we performed 2D 13C-13C spin diffusion measurements on the same samples at 30°C. As shown in Figure 8, the 2D spin diffusion spectra with 400 ms spin diffusion periods also show intermolecular crosspeaks for V6A4-Vpu1–40 and V6I8-Vpu1–40, but not A4I8-Vpu1–40. As expected, intermolecular crosspeaks are weak compared with intramolecular crosspeaks, but are clearly above the noise levels. Specifically, crosspeaks are observed between Ile Cδ and Val Cγ [Fig. 8(a)] and between Ala Cβ and Val Cα and Cβ [Fig. 8(b)]. Crosspeaks between Ala Cβ and Val Cγ are also observed but are not fully resolved from diagonal signals. As expected, intermolecular (but not intramolecular) crosspeaks are absent from spectra with 4 ms spin diffusion periods. From these data, we conclude that intermolecular contacts involving Val-Ala pairs and Val-Ile pairs exist in both the frozen and the fluid states.
Figure 8.
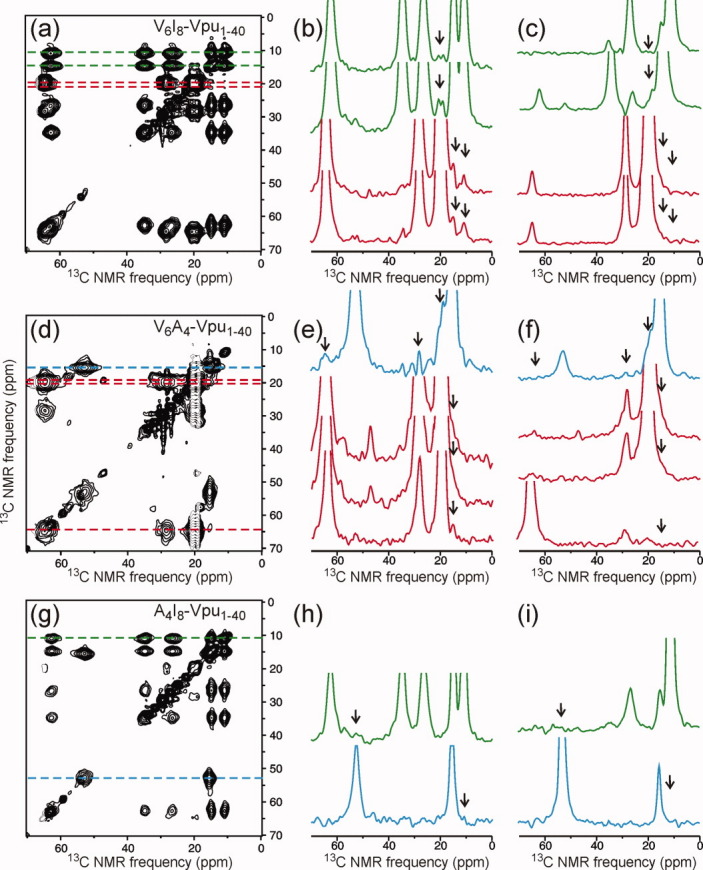
2D spin diffusion spectra and color-coded 1D slices from experiments on V6I8-Vpu1–40 (a, b, c), V6A4-Vpu1–40 (d, e, f), and A4I8-Vpu1–40 (g, h, i) in DOPC/DOPG bilayers. 2D spectra in panels (a, d, g) were obtained with 400 ms spin diffusion periods. 1D slices from these spectra are in panels (b, e, h), with black arrows indicating intermolecular crosspeaks. 1D slices from spectra with 4 ms spin diffusion periods are in panels (c, f, i). 2D spin diffusion experiments were performed at 30°C. [Color figure can be viewed in the online issue, which is available at wileyonlinelibrary.com.]
DIPSHIFT experiments were performed at 50°C sample temperatures where rotational diffusion of Vpu1–40 oligomers about axes perpendicular to the plane of the bilayer is rapid. In these experiments, 2D 13C-13C spectra of multiply labeled Vpu1–40 samples were recorded after a variable period τLG of 1H-13C dipolar evolution under Lee-Goldburg 1H-1H decoupling. The dependencies of 2D signal intensities on τLG reflect the apparent strengths of one-bond 1H-13C dipole–dipole couplings dapp, which in turn are strongly affected by molecular motions at this temperature. Assuming that the dominant motion is rigid-body rotational diffusion about the bilayer normal direction, as has been shown to be true in previous studies of similar systems,53–55 the motion scales all 1H-13C couplings by factors of the form  , where θ is the angle between an individual 1H-13C internuclear vector and the bilayer normal (i.e., the rotational diffusion axis). Of particular interest are one-bond couplings between 1Hα and 13Cα, because 1Hα-13Cα internuclear vectors are directly related to the peptide backbone orientation (in this case, in an α-helical conformation) and are independent of side-chain conformations.
The orientation of an ideal Vpu1–40 helix relative to the bilayer is defined by two angles, conventionally called τ and ρ, where τ is the angle between the helix axis and the bilayer normal and ρ is the angle of rotation about the helix axis. For each residue, the 1Hα-13Cα coupling angle θ depends on τ and ρ in a different way. Our strategy for determining τ and ρ was then to determine experimental values of | | for multiple residues from the quasi-3D DIPSHIFT data, and then search for pairs of τ and ρ values that simultaneously produce the experimentally observed |
 | values.
2D spectra at τLG = 0 are shown in Figure 9 for the three Vpu1–40 samples used in DIPSHIFT experiments. In these spectra, crosspeaks in the indicated Cα slices for A10, A18, V25, A14, L11, and I16 were sufficiently intense and well-resolved that crosspeak volumes could be determined reliably. 13C chemical shifts determined from these spectra are given in Table I. Where possible, multiple crosspeak volumes in the same horizontal slice were summed to improve the signal-to-noise, as all of these crosspeaks arise from spin polarization that was present on Cα at the end of the 1H-13C dipolar evolution period. The dependencies of crosspeak volumes on τLG are shown in Figure 10, along with simulations for various values of dapp. The simulations assume very rapid rotational diffusion, in which limit the signals at τLG = 0 and τLG = 2τR are equal. Experimental data in Figure 10 were corrected for an overall decay of 20–30%, attributable to deviation from the very-rapid-motion limit as previously described in detail,56 by multiplication with an increasing exponential function. For comparison, uncorrected data are shown in Figure S10 of the Supporting Information. Values of dapp determined from Figure 10 for A10, L11, A14, I16, A18, and V25 are 5.5 ± 1.0 kHz, 3.5 ± 1.5 kHz, 5.0 ± 0.5 kHz, 2.0 ± 1.0 kHz, 5.5 ± 0.5 kHz, and 7.5 ± 1.0 kHz, respectively.
Figure 9.
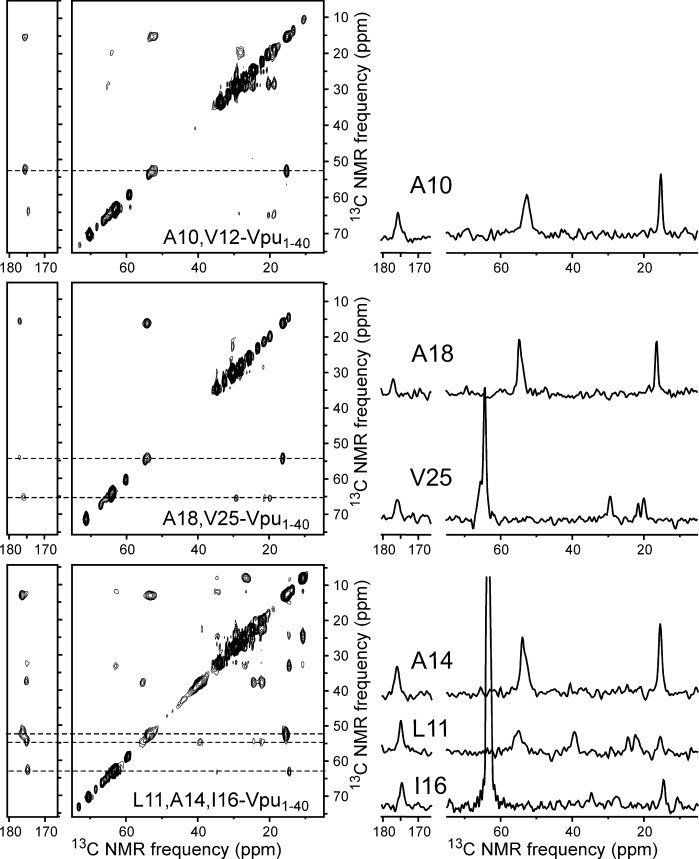
2D 13C-13C NMR spectra of the three Vpu1–40 samples used in DIPSHIFT experiments, with 1D slices at dashed lines. These are spectra with τLG = 0, corresponding to the first point in the curves in Figure 10. DIPSHIFT experiments were performed at 50°C.
Table I.
13C NMR Chemical Shifts of Labeled Sites in 2D DIPSHIFT Spectra of Vpu1–40 at 50°C
| Residue | CO | Cα | Cβ | Cγ | Cδ |
|---|---|---|---|---|---|
| A10 | 176.9 | 53.9 | 16.8 | ||
| L11 | 175.2 | 56.5 | 39.1 | 24.2 | 22.1 |
| A14 | 176.1 | 54.1 | 15.4 | ||
| I16 | 174.3 | 64.9 | 34.4 | 27.5/14.5 | 10.6 |
| A18 | 177.5 | 54.4 | 16.6 | ||
| V25 | 176.4 | 65.7 | 29.5 | 21.7/20.0 |
Shifts (ppm) are referenced to tetramethylsilane and have a precision of approximately ±0.2 ppm.
Figure 10.
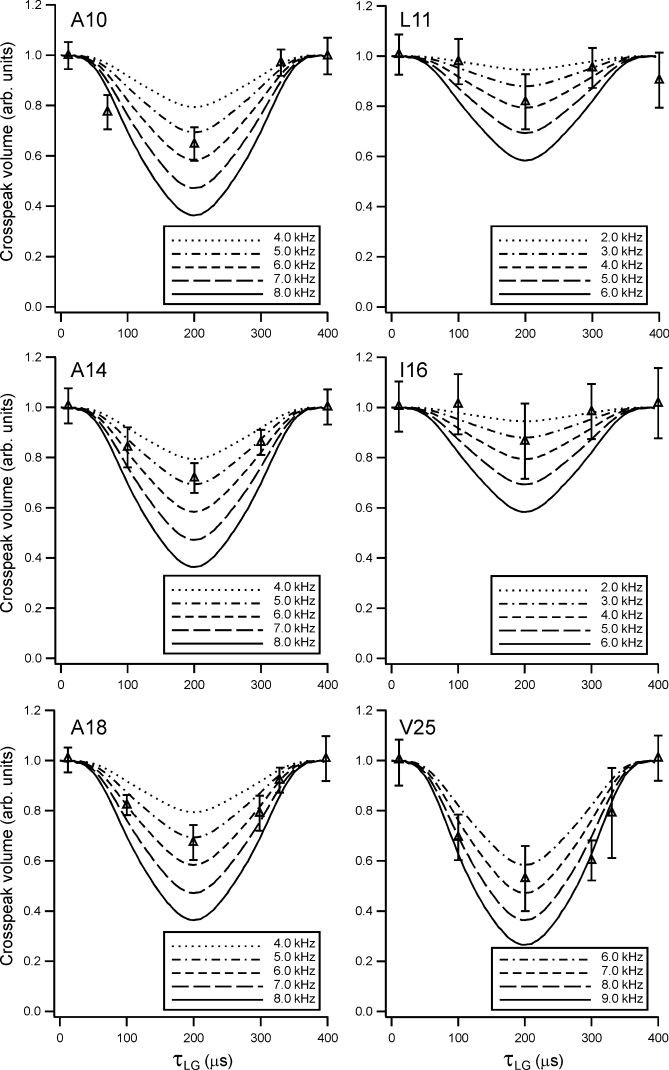
Experimental DIPSHIFT curves for individual Cα sites in Vpu1–40, extracted from 2D 13C-13C NMR spectra as in Figure 9. Simulated curves with the indicated values of motionally averaged 1Hα-13Cα dipole–dipole couplings are superimposed on the experimental data points.
Values of | | for individual sites in Vpu1–40 were determined by comparing these values of dapp with DIPSHIFT data for U-15N,13C-L-leucine powder at 24°C (Supporting Information Figure S10a). For this model compound, which should represent the motionless limit of
  = 1, the 1Hα-13Cα coupling was found to be 23 ± 2 kHz. This coupling strength corresponds to a Cα-Hα distance of 1.095 ± 0.033 Å, in good agreement with previous distance determinations.57 Values of |
  | for A10, L11, A14, I16, A18, and V25 are then 0.24 ± 0.05, 0.15 ± 0.07, 0.22 ± 0.03, 0.09 ± 0.04, 0.24 ± 0.03, and 0.33 ± 0.05, respectively.
Comparison with molecular models
Models for residues 7–27 of Vpu1–40 in symmetric helical-bundle oligomers were generated as described in Materials and Methods section, starting with ideal, straight α-helices with specified τ and ρ angles and using restrained energy minimization to improve intermolecular packing. Residues 7–27 were chosen because earlier solid-state NMR measurements17 indicated that the N-terminal helix of Vpu includes residues 3–27, and because all data in Figures 7–10 pertain to sites in residues 7–27. Figure 11 shows a typical example of initial and energy-minimized models, for a pentameric bundle with τ = −30° and ρ = 0°. Energy-minimized models were compared with the experimental 2D CHHC and spin diffusion data (which indicate detectable Val-Ala and Val-Ile, but not Ala-Ile, proximities) by using our own FORTRAN program to calculate all intermolecular distances between methyl protons of the relevant Val-Ala, Val-Ile, and Ala-Ile pairs. Models in which at least one intermolecular Ala-Ile distance was less than 2.0 Å were rejected, since such a close intermolecular methyl–methyl contact would have produced detectable Ala-Ile crosspeaks in Figures 7(e,f) or 8(g). Models in which no Val-Ala distance or no Val-Ile distance was less than 4.0 Å were also rejected, since methyl–methyl distances greater than 4.0 Å could not have produced the Val-Ala or Val-Ile crosspeaks in Figures 7(a–d) and 8(a,d). Remaining models were accepted, that is, considered consistent with the experimental 2D CHHC and spin diffusion data. Red areas in Figure 12(a) indicate values of τ and ρ that lead to consistent models.
Figure 11.
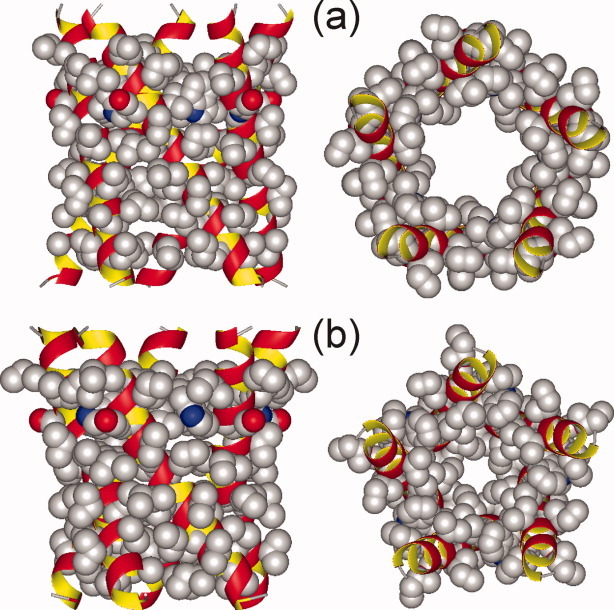
Example of a molecular model for a Vpu TM oligomer, constructed as described in the text, both before (a) and after (b) energy minimization. Views are shown perpendicular (left) and parallel (right) to the bilayer normal, for a pentamer with τ = −30° and ρ = 0°. [Color figure can be viewed in the online issue, which is available at wileyonlinelibrary.com.]
Figure 12.
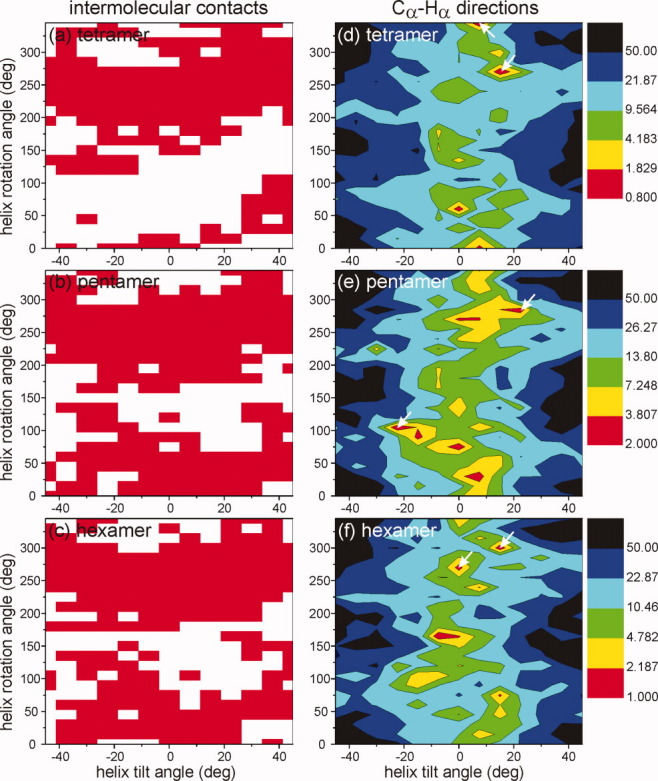
Evaluation of energy-minimized tetrameric (a, d), pentameric (b, e), and hexameric (c, f) molecular models, for helix tilt angles −45° ≤ τ ≤ 45° and rotation angles 0° ≤ ρ ≤ 345°. In panels (a, b, c), models that are consistent with experimental 2D CHHC and spin diffusion spectra are indicated by red regions in the τ,ρ plane. In panels (d, e, f), the deviation Δ (defined in the main text) between experimental and calculated DIPSHIFT results is plotted as a function of τ and ρ, with minima in Δ colored red.
We consider these distance criteria to be quite conservative in light of the facts that proton–proton distances of ∼2.1 Å have been shown to produce strong 13C-13C crosspeaks in 2D CHHC spectra58 and proton–proton distances greater than 4.0 Å are known to produce very weak crosspeaks,59 which would not be detected with the signal-to-noise ratios of our experimental 2D CHHC spectra of Vpu1–40.
Energy-minimized models were compared with experimental DIPSHIFT data by extracting the values of | | for individual Cα-Hα sites from the final atomic coordinates of each model. Calling the calculated value of |
 | for site i in a model with given τ and ρ values si(τ,ρ), the total deviation from the experimental values
  described above was calculated as
  , where σi was the estimated uncertainty in
  . The number of sites was M = 6. Figure 12(b) shows contour plots of Δ(τ,ρ). Large variations in Δ(τ,ρ) are observed, indicating that the DIPSHIFT data are strong constraints on both τ and ρ.
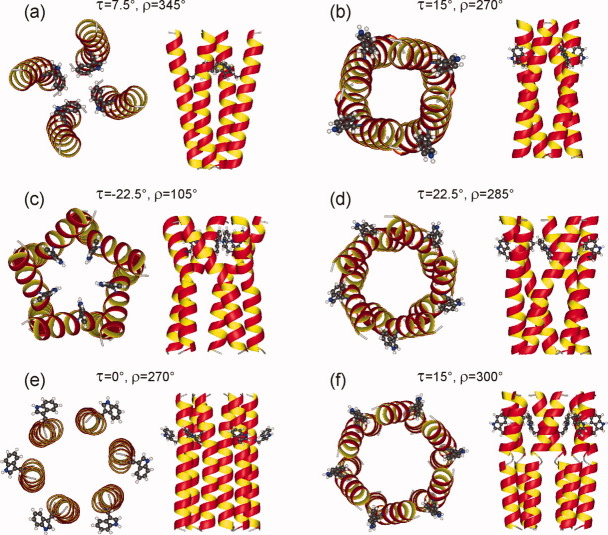
Relatively few τ,ρ pairs are consistent with both the 2D CHHC and the DIPSHIFT data, represented by red regions in both panels of Figure 12. For each value of N, the two energy-minimized models with smallest Δ(τ,ρ) that are also consistent with the 2D CHHC data are shown in Figure 13. These models have apparently diverse structures, but all have relatively small tilts, that is, |τ| ≤ 22.5°. Only one model has τ < 0, namely the pentamer with τ = −22.5° and ρ = 105°, corresponding to an overall left-handed twist of the helix bundle. Remaining models have a right-handed twist or are untwisted. In four of the six models in Figure 13, the side chain of Trp22 is on the outside of the helix bundle. The tetramer with τ = 7.5° and ρ = 345° has the Trp22 side chain on the inside. In the pentamer with τ = −22.5° and ρ = 105°, the Trp22 side chain of each Vpu1–40 helix points toward a neighboring helix. This prevents close contacts between neighboring helices, and is apparently an unrealistic structure.
Figure 13.
Models for tetrameric (a, b), pentameric (c, d), and hexameric (e, f) Vpu TM oligomers that simultaneously satisfy constraints from 2D CHHC and spin diffusion spectra and DIPSHIFT measurements. These models correspond to τ and ρ values indicated by white arrows in Figure 12. [Color figure can be viewed in the online issue, which is available at wileyonlinelibrary.com.]
Discussion
Analytical ultracentrifugation data presented above indicate that Vpu1–40 does not form a single, stable oligomeric species in C8E5 micelles. We interpret the PICUP results as evidence for a variety of coexisting oligomers in DOPC/DOPG bilayers, apparently including tetramers, pentamers, and hexamers. An alternative interpretation that the PICUP data reflect the existence of a single type of oligomer with relatively high molecular weight (e.g., a heptamer), with lower molecular weight species resulting solely from incomplete crosslinking within the oligomers, seems unlikely because the lower molecular weight species do not disappear as the PICUP reaction time increases. Another alternative interpretation that the PICUP data reflect the existence of a single type of oligomer with relatively low molecular weight (e.g., a tetramer), with higher molecular weight species resulting solely from interoligomer crosslinks, seems unlikely because the Vpu1–40 concentrations in the bilayer are low (0.3 mol% in Figures 4–6; 0.1 mol% in Supporting Information Figure S7) and because hexamers are prominent even at short reaction times (0.5 s). Data in Figures 5 and 6 and Supporting Information S7 suggest that pentamers may be the thermodynamically preferred oligomers, but differences in stability for various oligomers appear to be small. Comparable stability for structurally diverse oligomers in bilayers may explain experimental observations of multiple conductance levels for Vpu ion channels.1,10,13–15
Given that a variety of Vpu1–40 oligomer structures coexist in DOPC/DOPG bilayers, we can not analyze our solid-state NMR data unequivocally in terms of a single structure. However, the fact that 2D 13C-13C spectra of Vpu1–40 in bilayers show a single set of 13C chemical shifts17 suggests that peptide conformations and intermolecular interactions in the predominant oligomers are similar. Moreover, the sharp crosspeak signals in solid-state NMR spectra of Vpu TM peptides in uniaxially aligned bilayers reported by Opella and coworkers1,11,18–22 suggest that peptide orientations relative to the bilayer are similar, as orientational variations greater than ∼5° would produce significant line-broadening in their spectra. Therefore, although it is generally not valid to use data obtained from a structural ensemble to generate a single structural model, in the case of Vpu1–40 oligomers it is reasonable to assume that oligomers of different size share common helix orientations and intermolecular contacts and to apply the constraints from our solid-state NMR measurements to oligomers with specific sizes. The structural models in Figure 13 can then be taken to represent possible oligomer structures that are consistent with the data. Although it is not possible (even in principle) to determine a single structure from our data, it is useful to make comparisons with experimental and theoretical studies of Vpu TM oligomers that have been reported previously by other groups.
Opella and coworkers have performed a series of solid-state NMR and solution NMR studies of Vpu peptides in micelles and in bilayers.1,11,18–22 Solid-state NMR techniques employed in their studies are qualitatively different from the techniques described above, as they do not involve MAS and are applicable to uniaxially aligned bilayer systems. Specific models for Vpu TM tetramers and pentamers (Protein Data Bank files 1PI8 and 1PI7, respectively) have been proposed by Opella and coworkers. These models are remarkably similar to our models in Figure 13(b,d), with good agreement for both helix tilt and helix rotation. Figure 14 shows a direct comparison of our preferred pentamer model [from Fig. 13(d)] with 1PI7. That the models are similar despite their being derived from qualitatively different experimental data sets provides additional support for their validity as realistic models for Vpu TM oligomers.
Figure 14.
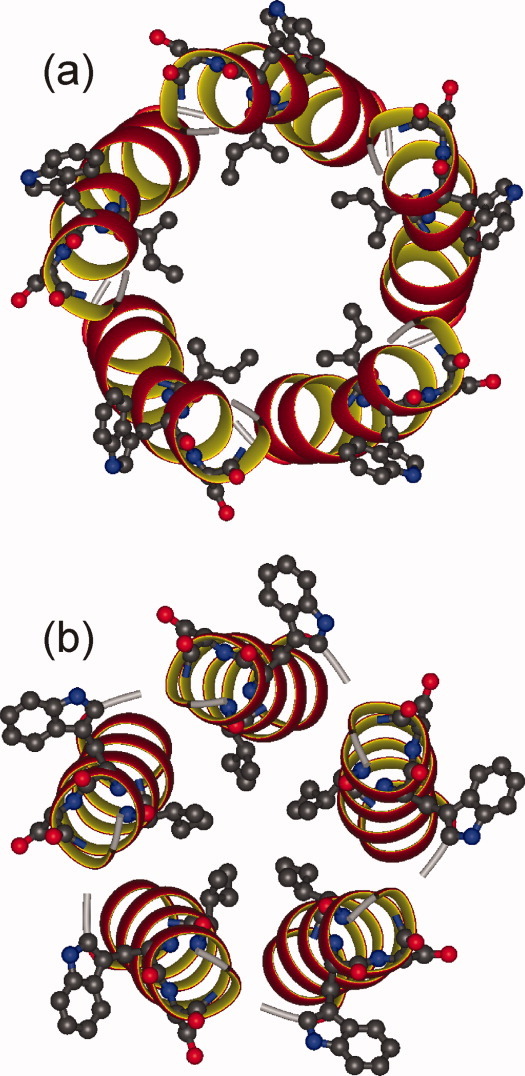
Comparison of the Vpu TM oligomer model from Figure 13d (a) with Protein Data Bank file 1PI7, as developed by Opella and coworkers (b). For both models, the backbone of residues 7–25 is shown as a ribbon representation, with a ball-and-stick representation of I17, W22, and S23. [Color figure can be viewed in the online issue, which is available at wileyonlinelibrary.com.]
The oligomer models of Opella and coworkers were developed from NMR-derived monomer models by energy minimization, with the only free variables being the intermolecular distances, the angle of rotation of each monomer about the bilayer normal, and side-chain conformations.20 Tilt and rotation axes were fixed, as was the backbone conformation. In our approach, the axis for helix tilt by angle τ was initially chosen to coincide with the direction from the center of mass of the monomer to the center of mass of the oligomer. The tilt axis could then vary during energy minimization, along with side-chain conformations, intermolecular distances, and (to a limited extent) backbone conformation. Tilt and rotation angles were varied over the series of candidate models. The two modeling approaches are related, but not equivalent.
Lee et al. have performed a different analysis of the aligned-sample data from the Opella group, in which experimental restraints from anisotropic 15N chemical shifts and 1H-15N dipole–dipole couplings were represented by artificial potential energy terms in torsion-angle molecular dynamics simulations.29 The simulations by Lee et al. produced multiple tetrameric and pentameric models for Vpu TM oligomers that are consistent with the aligned-sample data, including models with both right-handed twists and left-handed twists (corresponding to positive and negative values of τ, respectively, using our definition of the tilt angle). In at least some of the left-handed oligomers, the side chain of W22 was located within the central pore. In contrast, the only left-handed oligomer that we find to be a good fit to our 2D CHHC, spin diffusion, and DIPSHIFT data is shown in Figure 13(c). This left-handed model is implausible because of its pronounced distortion of the α-helices and steric clashes between W22 side chains and neighboring peptides. Thus, our data are in general agreement with the right-handed, but not the left-handed, oligomer models suggested by Lee et al.
Model 1PI7 was used by Ulmschneider and Ulmschneider as the initial state for Monte Carlo simulations in an implicit membrane environment, which showed that the Vpu TM pentamer remained structurally stable throughout the simulations.28 Similar stability is then expected for our model in Figure 13(d). Lopez et al. carried out molecular dynamics simulations for a Vpu TM pentamer with all-atom representations of the phospholipid bilayer and aqueous layers,26 starting with helix orientations similar to those in Figure 13(d). Although the fivefold symmetry of the pentamer was lost as the simulations proceeded, the helix orientations were generally preserved, again supporting the stability of such pentamer structures.
Rather different pentamer models were used in simulations by Pertagias et al.,32 Grice et al.,25 and Cordes et al.10 In these simulations, helix orientations were chosen such that the side chain of S23 was located in the central pore, with the assumption that such an orientation would be thermodynamically preferred. Using our definition of the helix rotation angle, such models have ρ ≈ 150° and do not fit our 2D CHHC and DIPSHIFT data.
Thus, our data provide information that is useful for interpreting and evaluating previous experimental and computational studies of Vpu TM oligomers in bilayers. Our data may also help guide future experimental and computational studies of the Vpu protein and its intermolecular interactions. Finally, the experimental techniques demonstrated above are applicable to structural studies of other integral membrane peptide and protein systems, including both homo-oligomers and hetero-oligomers.
Materials and Methods
Preparation of Vpu1–40 samples
Vpu1–40 was synthesized and purified as previously described.17 Samples for NMR were prepared in DOPC/DOPG multilamellar vesicles (MLVs), containing a 9:1 molar ratio of the two phospholipids, a 33:1 molar ratio of phospholipid to peptide. Roughly 10 mg of peptide was dissolved in trifluoroethanol and mixed with the appropriate amounts of lipids in chloroform. The organic solvent was removed under a dry nitrogen gas stream. Dried samples were left under vacuum overnight. Water was added the next day to produce a 60% hydration level (water mass with respect to the total sample mass). The samples were vortexed extensively and subjected to three freeze–thaw cycles to produce homogeneous vesicles. 31P NMR spectra confirmed the bilayer nature of the MLVs.
Analytical ultracentrifugation
Lyophilized peptide samples were dissolved in phosphate buffered saline containing 10 mM or 40 mM octyl-pentaoxyethylene (C8E5). Samples for analytical ultracentrifugation were prepared by dilution of these protein stocks into the same buffer. Sedimentation equilibrium experiments were conducted at 20.0°C on a Beckman Optima XL-A analytical ultracentrifuge. Wild-type Vpu1–40 samples were studied at loading concentrations ranging from 45 μM to 140 μM in 10 mM C8E5, whereas samples of the Y29T mutant were studied at loading concentrations ranging from 50 μM to 160 μM in both 10 mM and 40 mM C8E5. Samples were loaded into six-channel, 12 mm path length cells (135 μL) and data were acquired at 25–45 krpm, as an average of four absorbance measurements at 280 nm using a radial spacing of 0.001 cm. Sedimentation equilibrium at each rotor speed was achieved within 48 h. Data collected at different speeds were analyzed globally in terms of various species analysis models60 using SEDPHAT 7.03 software (available at: http://www. analyticalultracentrifugation.com/); to account for all of the loading material and constrain the data fitting, mass conservation was implemented with certain models. Protein partial specific volumes ν were calculated based on the amino acid composition in SEDNTERP 1.0961 (available at: http://www.jphilo. mailway.com/), and corrected for 13C and 15N isotopic substitutions in the Vpu1–40 samples.
Because the peptide is in a complex with the detergent, the buoyant molecular mass of the sedimenting species M2(1 − φ′ρ) determined by sedimentation equilibrium contains contributions from both Vpu1–40 and bound C8E5. Using the formalism developed by Eisenberg and coworker,62 the buoyant molecular mass of the complex can be expressed in terms of its components as M2(1 − φ′ρ) = M2[(1 − ν2ρ) + B3(1 − ν3ρ)], where M2 is the (monomeric or oligomeric) peptide mass, ν2 and ν3 are the partial specific volumes of the protein and C8E5, respectively, B3 is the amount of bound detergent expressed in grams per gram of protein, ρ is the solvent density and φ′ is the effective partial specific volume. C8E5 has a partial specific volume63v3 = 0.993 cm3 g−1, so that ν3ρ = 0.9982. The detergent is then nearly neutrally buoyant, with a molecular mass contribution of 0.6 Da per C8E5. Neglecting this contribution results in a Vpu1–40 mass error of less than 1%, even with 45 bound detergent molecules, corresponding to B3 = 3.3. This error is smaller than the imprecision of the measurements. Thus, we ignore any possible contribution from the detergent to M2.
Sedimentation velocity experiments were conducted at 20.0°C on a Beckman Coulter Proteome XL-I analytical ultracentrifuge using both absorbance and Rayleigh interference optical detection systems. Wild type and Y29T mutant Vpu1–40 samples were loaded into two-channel, 12-mm path length sector-shaped cells (400 μL) at concentrations ranging from 50 μM to 140 μM. 130 scans were acquired at 7-min intervals and rotor speeds of 50 krpm; absorbance data were collected as single absorbance measurements at 280 nm using a radial spacing of 0.003 cm. Absorbance data were analyzed in SEDFIT 11.9b (available at: http://www.analyticalultra centrifugation.com/) in terms of a continuous c(s) distribution64 using solution densities ρ and viscosities η calculated using SEDNTERP 1.2.61 The c(s) analyses were carried out using an s range of 0.5–5.0 S with a linear resolution of 100 and confidence levels (F-ratio) of 0.68. In all cases, excellent fits were observed with root mean square deviations ranging from 0.0037–0.0066 absorbance units. Sedimentation coefficients were corrected to standard conditions at 20.0°C in water, s20,w.
The optical absorbance at 280 nm, A280, is related to the sample molar concentration cM through the Beer–Lambert law A280 = ɛcMl, where ɛ is the molar extinction coefficient in M−1 cm−1 and l the path length. The fringes J measured using the interference optical detection system are related to cM through the refractive index increment dn/dc in cm3 g−1, according to the relation J = cMM(dn/dc)l/1000λ, where M is the molecular mass and λ the wavelength in cm. To estimate the amount of detergent in the Vpu1–40:C8E5 complexes, the absorbance data were used to determine the protein molar concentration and its contribution to J; excess fringes then represent bound C8E5. A standard dn/dc value of 0.187 cm3 g−1 was used for Vpu1–40, whereas a value of 0.125 cm3 g−1 was used for C8E5, based on data published for octyl-tetraoxyethylene.65
Photochemical crosslinking
Vpu1–40 oligomers in phospholipid bilayers were crosslinked using the PICUP technique, in which photoexcitation of tris(2,2′-bipyridyl)dichlororuthenium(II) (RuCl2(bipy)3) in the presence of the electron acceptor ammonium persulfate (APS) produces tyrosyl and other reactive radicals in polypeptides, which can then form intermolecular crosslinks in protein complexes on time scales of seconds or less.48–50 For these experiments, Vpu1–40 was dissolved in trifluoroethanol and then mixed with DOPC/DOPG (9:1) in chloroform, producing a 0.1–3.0% mole fraction of peptide relative to phospholipids. The mixture was dried under nitrogen gas and left in vacuum for 4 h, then hydrated using 10 mM sodium phosphate buffer (pH 7.4) to produce a final Vpu1–40 concentration of 20 μM for a 0.3% mole fraction. The mixture was vortexed thoroughly and subjected to three freeze–thaw cycles to produce homogenous MLVs. Typically, 22 μL of 1 mM RuCl2(bipy)3 (Sigma-Aldrich) and 22 μL of 20 mM APS (Sigma-Aldrich) in 10 mM sodium phosphate buffer (pH 7.4) were added to 500 μL of Vpu1–40/MLV solution in the dark. The mixture was irradiated at 24°C for periods ranging from 0.5 s to 5 min, using the output of a 150 watt incandescent fiber optic lamp (Dolan-Jenner model 180) and an electronically timed shutter (Melles-Griot model IES 3). The PICUP reaction was quenched immediately with 20 μL of 1M dithiothreitol.
Crosslinked Vpu1–40 was extracted from MLVs as described by Wessel and Flugge.66 Crosslinked material was thoroughly mixed with an equal volume of methanol and a ¼ volume of chloroform and incubated on ice for 10 min. After centrifugation, the upper aqueous phase was discarded without disturbing the interphase. The organic phase at the bottom of the tube and the interphase material were retained. Three volumes of methanol were added to the tube and gently mixed by inverting the tube several times. Crosslinked Vpu1–40 was then pelleted and collected.
The resulting crosslinked material was analyzed both by sodium dodecylsulfate polyacrylamide gel electrophoresis (SDS-PAGE) and by matrix-assisted laser desorption ionization time-of-flight (MALDI-TOF) mass spectrometry. For MALDI-TOF, the pellet from methanol/chloroform extraction was first dissolved in 100 μL TFE. A saturated α-cyano-4-hydroxy cinnamic acid solution in 50% acetonitrile AcCN was prepared as the matrix. Crosslinked Vpu1–40 in TFE was mixed with the matrix solution in a 5:1 volume ratio, deposited on the MALDI target plate, and analyzed with a Waters MALDI micro MX spectrometer, using the linear positive acquisition mode. A detection mass range from 3 to 50 kDa was used to observe the crosslinked products.
For SDS-PAGE analysis, 3–6 μL of TFE solution was mixed with lithium dodecyl sulfate (LDS) gel loading buffer (4×), then diluted with H2O to 2% LDS. Samples were analyzed using Novex NuPAGE 4–12% Bis-Tris Mini gels (for which LDS is recommended by the manufacturer). Peptide bands were visualized by silver staining using a kit from GE Healthcare Bio-Sciences. Gels were scanned and the images were saved in TIFF format. ImageJ software (available at: http://rsbweb.nih.gov/ij/) was used to obtain the densitometric profile of each SDS-PAGE lane. Relative intensities of oligomer bands were determined by fitting the densitometric profile with a sum of Gaussian peaks after baseline correction. Vpu1–40 directly dissolved in LDS gel loading buffer (50 μM), without any crosslinking reagents, was also run in the same SDS-PAGE gel as a control.
Solid-state NMR experiments
Proton-mediated 2D 13C-13C spectra,58,67 also called 2D CHHC spectra, of Vpu1–40 samples in DOPC/DOPG MLVs were obtained with the radio-frequency (rf) pulse sequence shown in Figure S1a of the Supporting Information, using a Varian InfinityPlus spectrometer and Varian 3.2 mm magic-angle spinning (MAS) NMR probe operating at 100.4 MHz 13C NMR frequency (9.39 T magnetic field). Sample volumes were 36 μL, and each sample contained ∼5 mg of Vpu1–40, consisting of 1:1 mixtures of peptides with uniformly 15N,13C-labeled alanine, valine, or isoleucine residues as shown in Figure 1(b). Sample temperatures were −50°C, MAS frequencies were 9.00 kHz, 13C rf fields were 47 kHz (with an amplitude ramp during initial 1H-13C cross-polarization (CP)), and 1H rf fields were 56 kHz during CP (with ±8% amplitude ramps in the mixing period) and 115 kHz during t1 and t2 periods. The initial CP period was 1.1 ms. The two CP periods within the mixing period were 250 μs. 2D CHHC spectra were recorded with 1H-1H spin diffusion periods in the 100–750 μs range. In general, longer spin diffusion periods permit 13C-13C crosspeaks to develop over longer internuclear distances, but lead to lower signal-to-noise. Each CHHC spectrum required ∼3 days of signal averaging, using 1.5 s recycle delays and maximum t1 values of 4.4–6.9 ms.
The 250 μs CP periods within the mixing period of the 2D CHHC measurements were longer than the corresponding periods used previously to detect proximities of Cα sites, for example in studies of amyloid fibrils.58 The longer CP periods were required because intermolecular contacts in Vpu1–40 oligomers primarily involve side-chain methyl groups, and rotations of methyl groups attenuate the 1H-13C dipole–dipole couplings. The 2D CHHC spectra were recorded in the frozen state (−50°C) to suppress rotational and translational diffusion, which would further attenuate the 1H-13C and 1H-1H couplings. Attempts to observe intermolecular crosspeaks in 2D CHHC spectra of Vpu1–40 at higher temperatures (40°C) failed due to lower signal-to-noise and, most likely, attenuation of intermolecular 1H-1H dipole–dipole couplings by diffusional motions.
To complement the 2D CHHC measurements, 2D 13C-13C exchange spectra of the same samples were recorded at 30°C, with crosspeaks developing through direct 13C-13C spin diffusion rather than through proton mediated polarization transfers (Supporting Information Figure S1b). 2D spin diffusion spectra were recorded at 150.7 MHz 13C NMR frequency (14.1 T magnetic field), using a Varian InfinityPlus spectrometer and Varian 3.2 mm MAS NMR probe. MAS frequencies were 12.00 kHz, and spin diffusion periods were 4–400 ms. Total measurement times were 56–112 h. As discussed above, both 2D CHHC and 2D spin diffusion spectra indicate the same intermolecular contacts in Vpu1–40 oligomers, despite the large difference in sample temperatures during the two measurements.
1H-13C dipolar-shift correlation (DIPSHIFT) measurements53,56,68 were performed in a quasi-three-dimensional manner with the rf pulse sequence in Supporting Information Figure S1c, using a Varian InfinityPlus spectrometer and Varian 5.0 mm MAS NMR probe operating at 150.7 MHz 13C NMR frequency (14.1 T magnetic field). Sample volumes were 160 μL and contained ∼20 mg of Vpu1–40, with the larger volume and higher field being required for adequate signal-to-noise. MAS frequencies were 5.00 kHz. Sample temperatures were 50°C, calibrated by the 1H NMR frequency of H2O within the sample under MAS and with the experimentally relevant 1H rf duty cycle to account for rf heating.6913C rf fields were 50 kHz, with ramped amplitude during CP. 1H rf fields were 68 kHz during t1 and t2 periods and 68 kHz during the 13C-1H dipolar evolution periods (corresponding to effective Lee-Goldburg decoupling fields70 of 83 kHz). The DIPSHIFT data were acquired as a series of 2D 13C-13C spectra, each requiring ∼2 days of signal averaging with 0.8 s recycle delays and 2.3 ms maximum t1 values, with variable Lee-Goldburg periods τLG. 2D data were acquired in blocks (roughly 6 h each) and summed to produce the final data sets. Attempts to obtain equivalent information from a series of 1D 13C spectra did not succeed because of spectral overlap with strong natural-abundance 13C NMR signals from phospholipids. DIPSHIFT experiments at lower sample temperatures (20–40°C range) did not produce data consistent with the rapid uniaxial rotation of Vpu1–40 oligomers required for proper analysis of the data (i.e., the data showed monotonic signal decays indicative of slower motion, as discussed by Deazevedo et al.56). We attribute the temperature dependence of DIPSHIFT data to temperature-dependent rotational diffusion rates, primarily due to the lower membrane viscosity at higher temperatures56. 2D NMR spectra were processed and crosspeak volumes were extracted with NMRPipe software.7113C chemical shift values are relative to tetramethylsilane, based on an external reference of 1-13C-L-alanine powder at 177.95 ppm. Simulations of DIPSHIFT data were performed with SIMPSON72 and SPINEVOLUTION.73
Sample degradation during lengthy solid-state NMR experiments was assessed by monitoring NMR spectra and signal intensities at various time points during the measurements. Questionable data were discarded. In addition, MAS rotors were opened and samples were visually inspected after the measurements. After several days of MAS, samples were typically distributed toward the inner wall of the rotor by centrifugal forces, leaving a small opening in the center. Occasionally, clear buffer was observed in the center, suggesting partial separation of excess water from the MLVs.
Oligomer modeling
Models for oligomeric bundles of Vpu TM helices were generated as follows: (1) coordinates for a 29-residue peptide monomer in an α-helical conformation, representing residues 7–27 of Vpu with tetraglycine capping segments at either end, were generated within MOLMOL.74 The helix axis was aligned with the z direction, considered to be the bilayer normal direction; (2) initial models for oligomeric bundles with given values of the helix rotation angle ρ, the helix tilt angle τ, and the oligomer number N were generated by our own FORTRAN computer program (available upon request to robertty@mail.nih.gov) that applied rotations about z by ρ and about y by τ to the monomer coordinates (with y being the direction from the center of mass of the monomer to the center of mass of the oligomer), and then applied rotations about z by 2π/N to the new coordinates to create the N copies of the peptide in the oligomer. The N copies were then displaced symmetrically in the xy plane by the minimum displacement that produced at least a 1.0 Å separation between all atoms. Oligomers with N = 4, 5, and 6 were created, with τ from −45° to +45° in 7.5° increments and ρ from 0° to 345° in 15° increments (312 models for each N); (3) restrained energy minimization was performed on each oligomer model, using the TINKER program (available at: http://dasher. wustl.edu/tinker/) with the CHARMM27 force field and a 3.0 Å electrostatic cut-off distance. All backbone ω angles were restrained to 180° with a 1.0 kcal/deg2 harmonic force constant. All backbone φ and ψ angles were restrained to −60° and −40°, respectively, with 0.01 kcal/deg2 harmonic force constant. The final energy-minimized oligomer models were used in comparisons with experimental NMR data. Energy minimization had the effect of adjusting intermolecular distances and both backbone and side-chain torsion angles to maximize intermolecular contacts and to ensure realistic intermolecular distances, determined by the atomic van der Waals radii. The α-helices generally acquired small (<15°) deviations from ideal linearity during energy minimization, but the τ and ρ angles were not changed greatly. In certain cases, the α-helices acquired bends up to 30°. All Vpu TM oligomers retained their initial N-fold rotational symmetry about the bilayer normal after energy minimization.
Note that our modeling procedure did not include solvent or phospholipid molecules. The goal was simply to generate well-packed oligomer models with the full range of possible τ and ρ angles for comparison with experimental data, not to predict the structures or other properties of Vpu TM oligomers by molecular dynamics simulations in a realistic bilayer environment, as has been done previously (without direct experimental constraints) by other groups.10,26,30–32 Our approach to modeling and data analysis is similar to the approach used by Kukol and Arkin to interpret Fourier-transform infrared (FTIR) measurements on Vpu TM oligomers.16
In our modeling procedure, oligomers with a right-handed twist about the symmetry axis have positive τ, whereas those with left-handed twist have negative τ. With ρ = 0°, Cα sites of I8, I15, and W22 are in the central pore of the oligomer, whereas Cα sites of V13, V20, and I27 are on the outside, nearly diametrically opposite to the symmetry axis. Increasingly positive values of ρ correspond to increasing right-handed rotations of each helix about its axis, running from C-terminal end to N-terminal end.
References
- 1.Marassi FM, Ma C, Gratkowski H, Straus SK, Strebel K, Oblatt-Montal M, Montal M, Opella SJ. Correlation of the structural and functional domains in the membrane protein Vpu from HIV-1. Proc Natl Acad Sci USA. 1999;96:14336–14341. doi: 10.1073/pnas.96.25.14336. [DOI] [PMC free article] [PubMed] [Google Scholar]
- 2.Schubert U, Bour S, FerrerMontiel AV, Montal M, Maldarelli F, Strebel K. The two biological activities of human immunodeficiency virus type 1 Vpu protein involve two separable structural domains. J Virol. 1996;70:809–819. doi: 10.1128/jvi.70.2.809-819.1996. [DOI] [PMC free article] [PubMed] [Google Scholar]
- 3.Strebel K, Klimkait T, Martin MA. A novel gene of HIV-1, Vpu, and its 16-kilodalton product. Science. 1988;241:1221–1223. doi: 10.1126/science.3261888. [DOI] [PubMed] [Google Scholar]
- 4.Margottin F, Bour SP, Durand H, Selig L, Benichou S, Richard V, Thomas D, Strebel K, Benarous R. A novel human WD protein, h-βTrCP, that interacts with HIV-1 Vpu connects CD4 to the ER degradation pathway through an F-box motif. Mol Cell. 1998;1:565–574. doi: 10.1016/s1097-2765(00)80056-8. [DOI] [PubMed] [Google Scholar]
- 5.Margottin F, Benichou S, Durand H, Richard V, Liu LX, Gomas E, Benarous R. Interaction between the cytoplasmic domains of HIV-1 Vpu and CD4: role of Vpu residues involved in CD4 interaction and in vitro CD4 degradation. Virology. 1996;223:381–386. doi: 10.1006/viro.1996.0491. [DOI] [PubMed] [Google Scholar]
- 6.Lindwasser OW, Chaudhuri R, Bonifacino JS. Mechanisms of CD4 downregulation by the nef and Vpu proteins of primate immunodeficiency viruses. Curr Mol Med. 2007;7:171–184. doi: 10.2174/156652407780059177. [DOI] [PubMed] [Google Scholar]
- 7.Estrabaud E, Le Rouzic E, Lopez-Verges S, Morel M, Belaidouni N, Benarous R, Transy C, Berlioz-Torrent C, Margottin-Goguet F. Regulated degradation of the HIV-1 Vpu protein through a βTrCP-independent pathway limits the release of viral particles. PLoS Pathog. 2007;3:995–1004. doi: 10.1371/journal.ppat.0030104. [DOI] [PMC free article] [PubMed] [Google Scholar]
- 8.Besnard-Guerin C, Belaidouni N, Lassot I, Segeral E, Jobart A, Marchal C, Benarous R. HIV-1 Vpu sequesters β-transducin repeat-containing protein (βTrCP) in the cytoplasm and provokes the accumulation of β-catenin and other SCF βTrCP substrates. J Biol Chem. 2004;279:788–795. doi: 10.1074/jbc.M308068200. [DOI] [PubMed] [Google Scholar]
- 9.Klimkait T, Strebel K, Hoggan MD, Martin MA, Orenstein JM. The human immunodeficiency virus type 1-specific protein Vpu is required for efficient virus maturation and release. J Virol. 1990;64:621–629. doi: 10.1128/jvi.64.2.621-629.1990. [DOI] [PMC free article] [PubMed] [Google Scholar]
- 10.Cordes FS, Tustian AD, Sansom MSP, Watts A, Fischer WB. Bundles consisting of extended transmembrane segments of Vpu from HIV-1: computer simulations and conductance measurements. Biochemistry. 2002;41:7359–7365. doi: 10.1021/bi025518p. [DOI] [PubMed] [Google Scholar]
- 11.Ma C, Marassi FM, Jones DH, Straus SK, Bour S, Strebel K, Schubert U, Oblatt-Montal M, Montal M, Opella SJ. Expression, purification, and activities of full-length and truncated versions of the integral membrane protein Vpu from HIV-1. Protein Sci. 2002;11:546–557. doi: 10.1110/ps.37302. [DOI] [PMC free article] [PubMed] [Google Scholar]
- 12.Schubert U, FerrerMontiel AV, OblattMontal M, Henklein P, Strebel K, Montal M. Identification of an ion channel activity of the Vpu transmembrane domain and its involvement in the regulation of virus release from HIV-1-infected cells. FEBS Lett. 1996;398:12–18. doi: 10.1016/s0014-5793(96)01146-5. [DOI] [PubMed] [Google Scholar]
- 13.Mehnert T, Lam YH, Judge PJ, Routh A, Fischer D, Watts A, Fischer WB. Towards a mechanism of function of the viral ion channel Vpu from HIV-1. J Biomol Struct Dyn. 2007;24:589–596. doi: 10.1080/07391102.2007.10507148. [DOI] [PubMed] [Google Scholar]
- 14.Becker CFW, Oblatt-Montal M, Kochendoerfer GG, Montal M. Chemical synthesis and single channel properties of tetrameric and pentameric TASPs (template-assembled synthetic proteins) derived from the transmembrane domain of HIV virus protein u (Vpu) J Biol Chem. 2004;279:17483–17489. doi: 10.1074/jbc.M313212200. [DOI] [PubMed] [Google Scholar]
- 15.Mehnert T, Routh A, Judge PJ, Lam YH, Fischer D, Watts A, Fischer WB. Biophysical characterization of Vpu from HIV-1 suggests a channel-pore dualism. Proteins. 2008;70:1488–1497. doi: 10.1002/prot.21642. [DOI] [PMC free article] [PubMed] [Google Scholar]
- 16.Kukol A, Arkin IT. Vpu transmembrane peptide structure obtained by site-specific Fourier transform infrared dichroism and global molecular dynamics searching. Biophys J. 1999;77:1594–1601. doi: 10.1016/S0006-3495(99)77007-4. [DOI] [PMC free article] [PubMed] [Google Scholar]
- 17.Sharpe S, Yau WM, Tycko R. Structure and dynamics of the HIV-1 Vpu transmembrane domain revealed by solid state NMR with magic-angle spinning. Biochemistry. 2006;45:918–933. doi: 10.1021/bi051766k. [DOI] [PubMed] [Google Scholar]
- 18.Park SH, de Angelis AA, Nevzorov AA, Wu CH, Opella SJ. Three-dimensional structure of the transmembrane domain of Vpu from HIV-1 in aligned phospholipid bicelles. Biophys J. 2006;91:3032–3042. doi: 10.1529/biophysj.106.087106. [DOI] [PMC free article] [PubMed] [Google Scholar]
- 19.Kochendoerfer GG, Jones DH, Lee S, Oblatt-Montal M, Opella SJ, Montal M. Functional characterization and NMR spectroscopy on full-length Vpu from HIV-1 prepared by total chemical synthesis. J Am Chem Soc. 2004;126:2439–2446. doi: 10.1021/ja038985i. [DOI] [PubMed] [Google Scholar]
- 20.Park SH, Mrse AA, Nevzorov AA, Mesleh MF, Oblatt-Montal M, Montal M, Opella SJ. Three-dimensional structure of the channel-forming trans-membrane domain of virus protein “U” (Vpu) from HIV-1. J Mol Biol. 2003;333:409–424. doi: 10.1016/j.jmb.2003.08.048. [DOI] [PubMed] [Google Scholar]
- 21.Zheng S, Strzalka J, Jones DH, Opella SJ, Blasie JK. Comparative structural studies of Vpu peptides in phospholipid monolayers by x-ray scattering. Biophys J. 2003;84:2393–2415. doi: 10.1016/S0006-3495(03)75045-0. [DOI] [PMC free article] [PubMed] [Google Scholar]
- 22.Zheng SY, Strzalka J, Ma C, Opella SJ, Ocko BM, Blasie JK. Structural studies of the HIV-1 accessory protein Vpu in Langmuir monolayers: synchrotron x-ray reflectivity. Biophys J. 2001;80:1837–1850. doi: 10.1016/S0006-3495(01)76154-1. [DOI] [PMC free article] [PubMed] [Google Scholar]
- 23.Hussain A, Das SR, Tanwar C, Jameel S. Oligomerization of the human immunodeficiency virus type 1 (HIV-1) Vpu protea genetic, biochemical and biophysical analysis. Virol J. 2007;4:81. doi: 10.1186/1743-422X-4-81. [DOI] [PMC free article] [PubMed] [Google Scholar]
- 24.Cordes FS, Kukol A, Forrest LR, Arkin IT, Sansom MSP, Fischer WB. The structure of the HIV-1 Vpu ion channel: modelling and simulation studies. Biochim Biophys Acta. 2001;1512:291–298. doi: 10.1016/s0005-2736(01)00332-7. [DOI] [PubMed] [Google Scholar]
- 25.Grice AL, Kerr ID, Sansom MSP. Ion channels formed by HIV-1 Vpu: a modelling and simulation study. FEBS Lett. 1997;405:299–304. doi: 10.1016/s0014-5793(97)00198-1. [DOI] [PubMed] [Google Scholar]
- 26.Lopez CF, Montal M, Blasie JK, Klein ML, Moore PB. Molecular dynamics investigation of membrane-bound bundles of the channel-forming transmembrane domain of viral protein U from the human immunodeficiency virus HIV-1. Biophys J. 2002;83:1259–1267. doi: 10.1016/S0006-3495(02)73898-8. [DOI] [PMC free article] [PubMed] [Google Scholar]
- 27.Moore PB, Zhong QF, Husslein T, Klein ML. Simulation of the HIV-1 Vpu transmembrane domain as a pentameric bundle. FEBS Lett. 1998;431:143–148. doi: 10.1016/s0014-5793(98)00714-5. [DOI] [PubMed] [Google Scholar]
- 28.Ulmschneider JP, Ulmschneider MB. Folding simulations of the transmembrane helix of virus protein U in an implicit membrane model. J Chem Theory Comput. 2007;3:2335–2346. doi: 10.1021/ct700103k. [DOI] [PubMed] [Google Scholar]
- 29.Lee J, Chen JH, Brooks CL, Im WP. Application of solid state NMR restraint potentials in membrane protein modeling. J Magn Reson. 2008;193:68–76. doi: 10.1016/j.jmr.2008.04.023. [DOI] [PMC free article] [PubMed] [Google Scholar]
- 30.Lemaitre V, Ali R, Kim CG, Watts A, Fischer WB. Interaction of amiloride and one of its derivatives with Vpu from HIV-1: a molecular dynamics simulation. FEBS Lett. 2004;563:75–81. doi: 10.1016/S0014-5793(04)00251-0. [DOI] [PubMed] [Google Scholar]
- 31.Candler A, Featherstone M, Ali R, Maloney L, Watts A, Fischer WB. Computational analysis of mutations in the transmembrane region of Vpu from HIV-1. Biochim Biophys Acta-Biomembr. 2005;1716:1–10. doi: 10.1016/j.bbamem.2005.07.012. [DOI] [PubMed] [Google Scholar]
- 32.Patargias G, Martay H, Fischer WB. Reconstructing potentials of mean force from short steered molecular dynamics simulations of Vpu from HIV-1. J Biomol Struct Dyn. 2009;27:1–12. doi: 10.1080/07391102.2009.10507291. [DOI] [PubMed] [Google Scholar]
- 33.Ewart GD, Mills K, Cox GB, Gage PW. Amiloride derivatives block ion channel activity and enhancement of virus-like particle budding caused by HIV-1 protein Vpu. Eur Biophys J Biophys Lett. 2002;31:26–35. doi: 10.1007/s002490100177. [DOI] [PubMed] [Google Scholar]
- 34.Hsu K, Seharaseyon J, Dong PH, Bour S, Marban E. Mutual functional destruction of HIV-1 Vpu and host TASK-1 channel. Mol Cell. 2004;14:259–267. doi: 10.1016/s1097-2765(04)00183-2. [DOI] [PubMed] [Google Scholar]
- 35.Varthakavi V, Smith RM, Bour SP, Strebel K, Spearman P. Viral protein U counteracts a human host cell restriction that inhibits HIV-1 particle production. Proc Natl Acad Sci USA. 2003;100:15154–15159. doi: 10.1073/pnas.2433165100. [DOI] [PMC free article] [PubMed] [Google Scholar]
- 36.Neil SJD, Zang T, Bieniasz PD. Tetherin inhibits retrovirus release and is antagonized by HIV-1 Vpu. Nature. 2008;451:U425–U421. doi: 10.1038/nature06553. [DOI] [PubMed] [Google Scholar]
- 37.van Damme N, Goff D, Katsura C, Jorgenson RL, Mitchell R, Johnson MC, Stephens EB, Guatelli J. The interferon-induced protein BST-2 restricts HIV-1 release and is downregulated from the cell surface by the viral Vpu protein. Cell Host Microbe. 2008;3:245–252. doi: 10.1016/j.chom.2008.03.001. [DOI] [PMC free article] [PubMed] [Google Scholar]
- 38.Perez-Caballero D, Zang T, Ebrahimi A, McNatt MW, Gregory DA, Johnson MC, Bieniasz PD. Tetherin inhibits HIV-1 release by directly tethering virions to cells. Cell. 2009;139:499–511. doi: 10.1016/j.cell.2009.08.039. [DOI] [PMC free article] [PubMed] [Google Scholar]
- 39.Douglas JL, Viswanathan K, McCarroll MN, Gustin JK, Fruh K, Moses AV. Vpu directs the degradation of the human immunodeficiency virus restriction factor BST-2/tetherin via a βTrCP-dependent mechanism. J Virol. 2009;83:7931–7947. doi: 10.1128/JVI.00242-09. [DOI] [PMC free article] [PubMed] [Google Scholar]
- 40.Mangeat B, Gers-Huber G, Lehmann M, Zufferey M, Luban J, Piguet V. HIV-1 Vpu neutralizes the antiviral factor tetherin/BST-2 by binding it and directing its βTrCP-dependent degradation. PLoS Pathog. 2009;5:e1000574. doi: 10.1371/journal.ppat.1000574. [DOI] [PMC free article] [PubMed] [Google Scholar]
- 41.Gupta RK, Hue S, Schaller T, Verschoor E, Pillay D, Towers GJ. Mutation of a single residue renders human tetherin resistant to HIV-1 Vpu-mediated depletion. PLoS Pathog. 2009;5:e1000443. doi: 10.1371/journal.ppat.1000443. [DOI] [PMC free article] [PubMed] [Google Scholar]
- 42.Rong LW, Zhang JY, Lu J, Pan QH, Lorgeoux RP, Aloysius C, Guo F, Liu SL, Wainberg MA, Liang C. The transmembrane domain of BST-2 determines its sensitivity to down-modulation by human immunodeficiency virus type 1 Vpu. J Virol. 2009;83:7536–7546. doi: 10.1128/JVI.00620-09. [DOI] [PMC free article] [PubMed] [Google Scholar]
- 43.Montal M. Vpu matchmakers as a therapeutic strategy for HIV infection. PLoS Pathog. 2009;5:e1000246. doi: 10.1371/journal.ppat.1000246. [DOI] [PMC free article] [PubMed] [Google Scholar]
- 44.Brohm C, Steinmann E, Friesland M, Lorenz IC, Patel A, Penin F, Bartenschlager R, Pietschmann T. Characterization of determinants important for hepatitis C virus p7 function in morphogenesis by using trans-complementation. J Virol. 2009;83:11682–11693. doi: 10.1128/JVI.00691-09. [DOI] [PMC free article] [PubMed] [Google Scholar]
- 45.Madan V, Garcia MD, Sanz MA, Carrasco L. Viroporin activity of murine hepatitis virus E protein. FEBS Lett. 2005;579:3607–3612. doi: 10.1016/j.febslet.2005.05.046. [DOI] [PMC free article] [PubMed] [Google Scholar]
- 46.Kochva U, Leonov H, Arkin IT. Modeling the structure of the respiratory syncytial virus small hydrophobic protein by silent-mutation analysis of global searching molecular dynamics. Protein Sci. 2003;12:2668–2674. doi: 10.1110/ps.03151103. [DOI] [PMC free article] [PubMed] [Google Scholar]
- 47.Gonzalez ME, Carrasco L. Viroporins. FEBS Lett. 2003;552:28–34. doi: 10.1016/s0014-5793(03)00780-4. [DOI] [PubMed] [Google Scholar]
- 48.Fancy DA, Denison C, Kim K, Xie YQ, Holdeman T, Amini F, Kodadek T. Scope, limitations and mechanistic aspects of the photo-induced cross-linking of proteins by water-soluble metal complexes. Chem Biol. 2000;7:697–708. doi: 10.1016/s1074-5521(00)00020-x. [DOI] [PubMed] [Google Scholar]
- 49.Fancy DA, Kodadek T. Chemistry for the analysis of protein-protein interactions: rapid and efficient cross-linking triggered by long wavelength light. Proc Natl Acad Sci USA. 1999;96:6020–6024. doi: 10.1073/pnas.96.11.6020. [DOI] [PMC free article] [PubMed] [Google Scholar]
- 50.Bitan G. Structural study of metastable amyloidogenic protein oligomers by photo-induced cross-linking of unmodified proteins. Methods Enzymol. 2006;413:217–236. doi: 10.1016/S0076-6879(06)13012-8. [DOI] [PMC free article] [PubMed] [Google Scholar]
- 51.Bitan G, Teplow DB. Rapid photochemical cross-linking: a new tool for studies of metastable, amyloidogenic protein assemblies. Acc Chem Res. 2004;37:357–364. doi: 10.1021/ar000214l. [DOI] [PubMed] [Google Scholar]
- 52.Rath A, Glibowicka M, Nadeau VG, Chen G, Deber CM. Detergent binding explains anomalous SDS-page migration of membrane proteins. Proc Natl Acad Sci USA. 2009;106:1760–1765. doi: 10.1073/pnas.0813167106. [DOI] [PMC free article] [PubMed] [Google Scholar]
- 53.Luo WB, Cady SD, Hong M. Immobilization of the influenza A M2 transmembrane peptide in virus envelope-mimetic lipid membranes: a solid state NMR investigation. Biochemistry. 2009;48:6361–6368. doi: 10.1021/bi900716s. [DOI] [PMC free article] [PubMed] [Google Scholar]
- 54.Cady SD, Hong M. Simultaneous extraction of multiple orientational constraints of membrane proteins by 13C-detected N-H dipolar couplings under magic-angle spinning. J Magn Reson. 2008;191:219–225. doi: 10.1016/j.jmr.2008.01.001. [DOI] [PubMed] [Google Scholar]
- 55.Cady SD, Goodman C, Tatko CD, DeGrado WF, Hong M. Determining the orientation of uniaxially rotating membrane proteins using unoriented samples: a 2H, 13C, and 15N solid state NMR investigation of the dynamics and orientation of a transmembrane helical bundle. J Am Chem Soc. 2007;129:5719–5729. doi: 10.1021/ja070305e. [DOI] [PubMed] [Google Scholar]
- 56.Deazevedo ER, Saalwachter K, Pascui O, de Souza AA, Bonagamba TJ, Reichert D. Intermediate motions as studied by solid state separated local field NMR experiments. J Chem Phys. 2008;128:104505. doi: 10.1063/1.2831798. [DOI] [PubMed] [Google Scholar]
- 57.Munowitz MG, Griffin RG, Bodenhausen G, Huang TH. Two-dimensional rotational spin-echo nuclear magnetic-resonance in solids: correlation of chemical-shift and dipolar interactions. J Am Chem Soc. 1981;103:2529–2533. [Google Scholar]
- 58.Tycko R, Ishii Y. Constraints on supramolecular structure in amyloid fibrils from two-dimensional solid state NMR spectroscopy with uniform isotopic labeling. J Am Chem Soc. 2003;125:6606–6607. doi: 10.1021/ja0342042. [DOI] [PubMed] [Google Scholar]
- 59.Loquet A, Bardiaux B, Gardiennet C, Blanchet C, Baldus M, Nilges M, Malliavin T, Bockmann A. 3D structure determination of the Crh protein from highly ambiguous solid state NMR restraints. J Am Chem Soc. 2008;130:3579–3589. doi: 10.1021/ja078014t. [DOI] [PubMed] [Google Scholar]
- 60.Schuck P. On the analysis of protein self-association by sedimentation velocity analytical ultracentrifugation. Anal Biochem. 2003;320:104–124. doi: 10.1016/s0003-2697(03)00289-6. [DOI] [PubMed] [Google Scholar]
- 61.Cole JL, Lary JW, Moody TP, Laue TM. Analytical ultracentrifugation: sedimentation velocity and sedimentation equilibrium. Methods Cell Biol. 2008;84:143–179. doi: 10.1016/S0091-679X(07)84006-4. [DOI] [PMC free article] [PubMed] [Google Scholar]
- 62.Casassa EF, Eisenberg H. Thermodynamic analysis of multicomponent solutions. Adv Protein Chem. 1964;19:287–395. doi: 10.1016/s0065-3233(08)60191-6. [DOI] [PubMed] [Google Scholar]
- 63.Ludwig B, Grabo M, Gregor I, Lustig A, Regenass M, Rosenbusch JP. Solubilized cytochrome C oxidase from Paracoccus denitrificans is a monomer. J Biol Chem. 1982;257:5576–5578. [PubMed] [Google Scholar]
- 64.Schuck P. Size-distribution analysis of macromolecules by sedimentation velocity ultracentrifugation and Lamm equation modeling. Biophys J. 2000;78:1606–1619. doi: 10.1016/S0006-3495(00)76713-0. [DOI] [PMC free article] [PubMed] [Google Scholar]
- 65.Corti M, Minero C, Degiorgio V. Cloud point transition in nonionic micellar solutions. J Phys Chem. 1984;88:309–317. [Google Scholar]
- 66.Wessel D, Flugge UI. A method for the quantitative recovery of protein in dilute solution in the presence of detergents and lipids. Anal Biochem. 1984;138:141–143. doi: 10.1016/0003-2697(84)90782-6. [DOI] [PubMed] [Google Scholar]
- 67.Lange A, Luca S, Baldus M. Structural constraints from proton-mediated rare-spin correlation spectroscopy in rotating solids. J Am Chem Soc. 2002;124:9704–9705. doi: 10.1021/ja026691b. [DOI] [PubMed] [Google Scholar]
- 68.Cady SD, Hong M. Amantadine-induced conformational and dynamical changes of the influenza M2 transmembrane proton channel. Proc Natl Acad Sci USA. 2008;105:1483–1488. doi: 10.1073/pnas.0711500105. [DOI] [PMC free article] [PubMed] [Google Scholar]
- 69.Dvinskikh SV, Castro V, Sandstrom D. Heating caused by radiofrequency irradiation and sample rotation in 13C magic-angle spinning NMR studies of lipid membranes. Magn Reson Chem. 2004;42:875–881. doi: 10.1002/mrc.1477. [DOI] [PubMed] [Google Scholar]
- 70.Lee M, Goldburg WI. Nuclear magnetic resonance line narrowing by a rotating rf field. Phys Rev. 1965;140:1261–1271. [Google Scholar]
- 71.Delaglio F, Grzesiek S, Vuister GW, Zhu G, Pfeifer J, Bax A. NMRpipe: a multidimensional spectral processing system based on Unix pipes. J Biomol NMR. 1995;6:277–293. doi: 10.1007/BF00197809. [DOI] [PubMed] [Google Scholar]
- 72.Bak M, Rasmussen JT, Nielsen NC. SIMPSON: a general simulation program for solid state NMR spectroscopy. J Magn Reson. 2000;147:296–330. doi: 10.1006/jmre.2000.2179. [DOI] [PubMed] [Google Scholar]
- 73.Veshtort M, Griffin RG. SPINEVOLUTION: a powerful tool for the simulation of solid and liquid state NMR experiments. J Magn Reson. 2006;178:248–282. doi: 10.1016/j.jmr.2005.07.018. [DOI] [PubMed] [Google Scholar]
- 74.Koradi R, Billeter M, Wuthrich K. MOLMOL: a program for display and analysis of macromolecular structures. J Mol Graph. 1996;14:51–55. doi: 10.1016/0263-7855(96)00009-4. [DOI] [PubMed] [Google Scholar]


