Abstract
Phage holins and endolysins have long been known to play key roles in lysis of the host cell, disrupting the cytoplasmic membrane and peptidoglycan (PG) layer, respectively. For phages of Gram-negative hosts, a third class of proteins, the spanins, are involved in disrupting the outer membrane (OM). Rz and Rz1, the components of the lambda spanin, are, respectively, a class II inner membrane protein and an OM lipoprotein, are thought to span the entire periplasm by virtue of C-terminal interactions of their soluble domains. Here, the periplasmic domains of Rz and Rz1 have been purified and shown to form dimeric and monomeric species, respectively, in solution. Circular dichroism analysis indicates that Rz has significant alpha-helical character, but much less than predicted, whereas Rz1, which is 25% proline, is unstructured. Mixture of the two proteins leads to complex formation and an increase in secondary structure, especially alpha-helical content. Moreover, transmission electron-microscopy reveals that Rz–Rz1 complexes form large rod-shaped structures which, although heterogeneous, exhibit periodicities that may reflect coiled-coil bundling as well as a long dimension that matches the width of the periplasm. A model is proposed suggesting that the formation of such bundles depends on the removal of the PG and underlies the Rz–Rz1 dependent disruption of the OM.
Keywords: lysis, coiled-coil, two-component spanins, endolysin
INTRODUCTION
The process of λ host cell lysis has three steps that compromise, in turn, the inner membrane (IM), the peptidoglycan (PG) layer, and the outer membrane (OM), a sequence also reflected in the order of the genes involved.1 The first two steps are now well established.2 First, after accumulating harmlessly in the IM throughout late gene expression, the holin S105, encoded by S, suddenly forms extremely large, irregular holes.3 Besides terminating macromolecular synthesis and virion assembly, this event allows the lambda endolysin R, a soluble cytoplasmic transglycosylase, to escape to the periplasm, thus allowing the second step, degradation of the PG, to occur. The destruction of the PG is followed by the third step, which requires the products of the last two genes, Rz and Rz1. Both genes are necessary for lysis in liquid culture if the medium is supplemented with millimolar concentrations of divalent cations.4,5 Under these conditions, defects in either Rz or Rz1 block lysis and lead to the accumulation of spherical, mechanically fragile cells. This morphology and the dependency of the phenotype on divalent cations suggest that the third step is an Rz–Rz1-dependent disruption of the OM. Rz–Rz1 function depends only on endolysin function, as lysis by signal-anchor-release endolysins, which are secreted to the periplasm by the sec system independently of holin activity, exhibits the same divalent-cation dependent requirement for Rz and Rz1.1 The genes for these two lysis proteins have an unusual architecture, in that Rz1 is completely embedded in the +1 reading frame within Rz.6,7 Aided by the striking architecture, which is unique in biology for two genes involved in the same function, we identified equivalents of Rz–Rz1 in nearly all genomes of phages that infect Gram-negative bacteria.8 The ubiquity and diversity (37 unrelated gene families) suggested that, for phage lysis, Rz and Rz1 are just as important as holins and endolysins.
The Rz protein has an N-terminal transmembrane domain (TMD) and a C-terminal periplasmic domain that is exceptionally rich in acidic and basic residues (46 of 123 total) [Fig. 1(A)]. Secondary structure analyses of Rz proteins, including those of which are unrelated based on sequence analysis, indicate that the majority of the periplasmic domain (70%) consists of two stretches of alpha-helix interrupted by a short, largely unstructured linker [Fig. 1(A)].8 The mature Rz1 protein is a 40 residue OM lipoprotein containing 10 Pro residues and devoid of predicted secondary structure [Fig. 1(B)].8,10 Multiple lines of genetic, physiological, and molecular evidence suggest that Rz and Rz1 form a complex, which, as it must span the periplasm, has been designated as the spanin complex. According to this formalism, Rz and Rz1 are the large and small spanin subunits, respectively. Here, we present in vitro studies that characterize the properties of the periplasmic domains of Rz and Rz1. The results are discussed in terms of a model for the conformational change of spanins following endolysin-mediated PG degradation.
Figure 1.
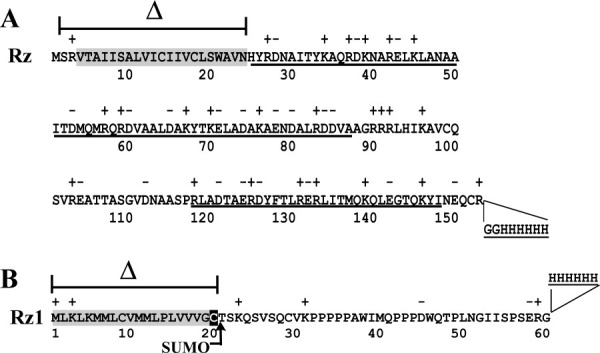
The primary structure of λRz and Rz1. (A) Rz. The predicted N-terminal TMD and α-helical regions are highlighted and underlined, respectively.8 The region of Rz deleted during the construction of pSRzH6 (see “Materials and methods”) is indicated by a cross bar and Δ symbol. The sequence and location of the C-terminal oligohistidine tag are also indicated. (B) Rz1. The predicted lipoprotein signal sequence is highlighted in grey with the processed Cys residue highlighted in black.10 The region of Rz1 deleted during the construction of pSUMOφsRz1H6 (see “Materials and Methods”) is indicated by a cross bar and Δ symbol. The locations at which a SUMO and oligohistidine tag were fused to the Rz1 protein during construction of pSUMOφsRz1H6 is indicated by an arrow and two lines, respectively.
RESULTS
Purification of the Rz and Rz1 periplasmic domains
Purification of full length Rz and mature, processed Rz1 were complicated both by poor solubility in detergent and by low levels of accumulation. However, genetic and biochemical evidence indicates that the TMD of Rz [Fig. 1(A)] functions solely in a tethering capacity and can be replaced by other TMDs.1 Moreover, a soluble form of Rz lacking the TMD, while nonfunctional in lysis, is still capable of forming a complex with Rz1. These considerations suggested that Rz–Rz1 complex formation could be studied with soluble forms of both proteins.
For Rz, an expression allele was created encoding soluble Rz (sRz), composed of the soluble periplasmic domain and a C-terminal oligohistidine tag. Induction of cells carrying this construct resulted in the cytoplasmic accumulation of an 18 kDa species [Fig. 2(A)]. Initial attempts at purification were plagued by apparent proteolytic degradation. However, proteolytic activity was minimized by conducting all steps through the separation by immobilized metal affinity chromatography (IMAC) at 4°C [Fig. 2(A), lane 2]. A final yield of 1.5 mg of sRz per liter of induced culture. During gel-filtration chromatography, sRz migrated as a single peak corresponding to a mass of ∼36 kDa, indicating the sRz is a dimer at room temperature [Fig. 3(A)]. This dimer was stably soluble in the cold but only at concentrations below 1 mg mL−1; above this level, irreversible aggregation and precipitation invariably occurred (see “Discussion”).
Figure 2.
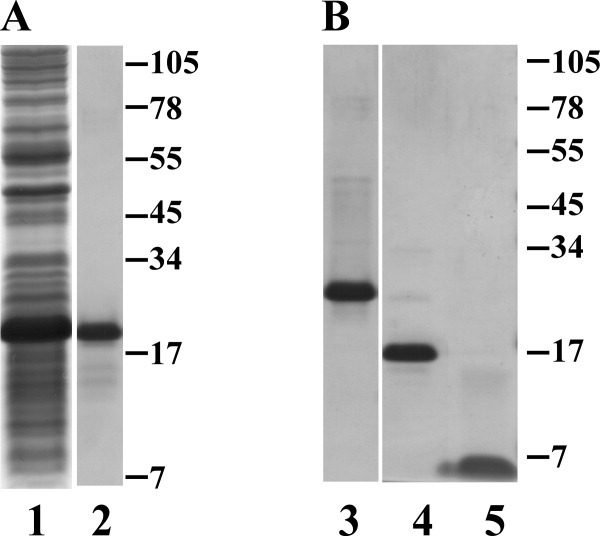
Purification of the Rz and Rz1 periplasmic domains. (A) Coomassie blue-stained SDS gels showing total protein from the crude lysate following overexpression of sRz (lane 1) and IMAC-pooled elution fractions (lane 2). MW standards expressed in kilodaltons are indicated to the right of lane 2. (B) Coomassie blue-stained SDS gels showing total protein from pooled IMAC elution fractions following overexpression of SUMOφsRz1 (lane 3), freed SUMO tag (lane 4), and sRz1 protein (lane 5) following ULPI cleavage and gel filtration, see Figure 3(B). MW standards expressed in kilodaltons are indicated to the right of lane 5.
Figure 3.
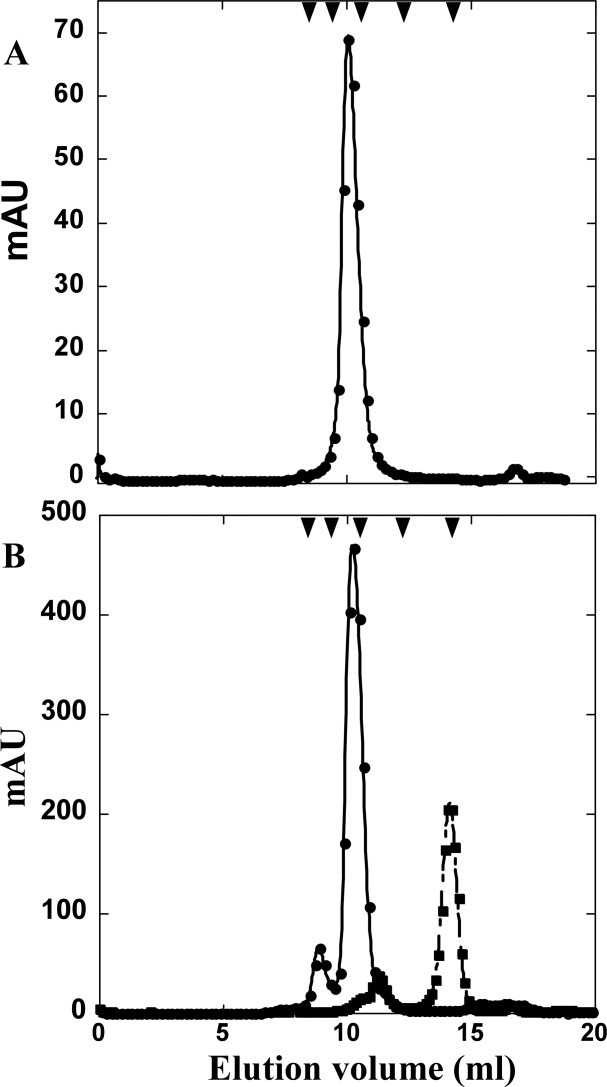
S-75 gel filtration of sRz and sRz1. (A) Elution profile of sRz (•). (B) Elution profiles of SUMOφsRz1 (•) and SUMOφsRz1 ULPI cleavage reaction (▪). S-75 standards are indicated by arrow heads, from left to right: 75, 44, 29, 13.7, and 6.5 kDa.
An analogous allele for Rz1, in which the lipoprotein signal sequence was removed [Fig. 1(B)], was also constructed. However, inductions of this allele did not result in accumulation of useful amounts of Rz1 protein (data not shown), probably due to its small size (40 residues) and high proline content (25%) rendering it susceptible to proteolysis. To overcome this obstacle, we first constructed an allele encoding a hybrid Rz1 protein, with an oligohistidine-tagged SUMO domain11 fused at its N-terminus. However, material produced from inductions of this allele was still characterized by substantial degradation of the Rz1 domain, detectable as smeared bands in Western blot analysis (data not shown). Ultimately, it was found that further modification of the construct by relocating the oligohistidine tag from the N-terminus of SUMO to the C-terminus of the SUMO-Rz1 fusion was necessary [Fig. 1(B)]. Induction of this construct resulted in the accumulation of a soluble, 24 kDa species. This protein, designated SUMOφsRz1, could be purified to near homogeneity through IMAC [Fig. 2(B), lane 3]. Cleavage of the SUMO tag by treatment with UlpI protease freed the soluble 6 kDa protein, designated as soluble Rz1 (sRz1), which was separated from the protease and SUMO tag by gel-filtration chromatography [Fig. 2(B), lanes 4 and 5]. The elution volume of the sRz1 indicated the protein was monomeric in solution [Fig. 3(B)]. Unlike sRz, the sRz1 protein is stable at concentrations above 1 mg mL−1 when stored at low temperatures. Final yield for the freed sRz1 protein was 0.5 mg L−1.
Tertiary changes are associated with Rz–Rz1 complex formation
The secondary structures of the sRz and sRz1 proteins were assessed by circular dichroism (CD) spectroscopy. Figure 4(A) shows the CD spectra of the individual sRz and sRz1 proteins. Analysis of the spectra using various deconvolution methods (see “Materials and Methods”) indicated that the sRz dimer was ∼27% helical, significantly less than the predicted 73%, whereas the sRz1 protein was estimated at only ∼6% helical and mostly random coil, as anticipated based on its high proline content.
Figure 4.
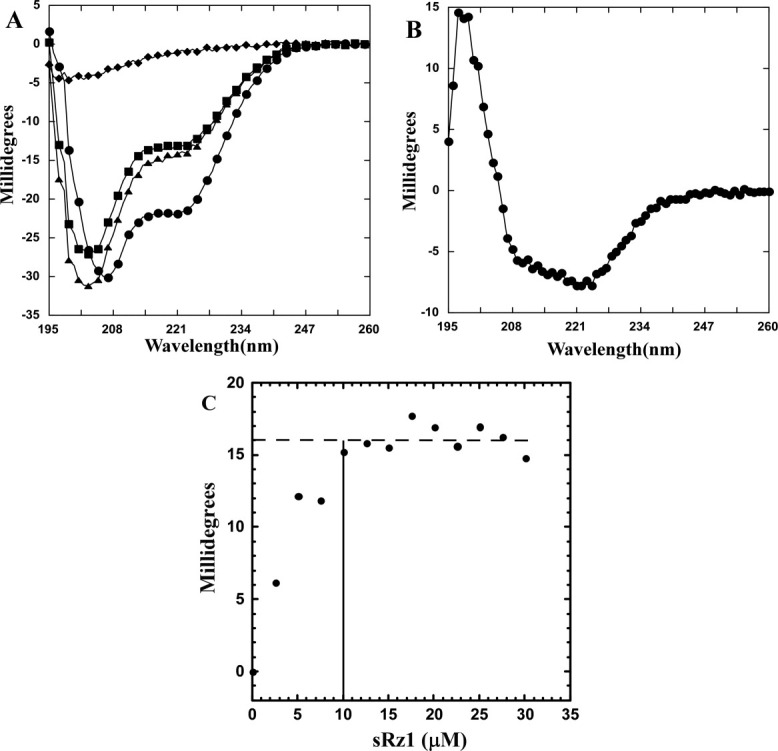
sRz and sRz1 complex results in increased alpha-helical content. (A) CD analysis of sRz, sRz1, and sRz–sRz1 mixture. The individual sRz (▪) and sRz1 (♦) spectrum at a final concentration of 20 and 5 μM, respectively. Theoretical spectrum for non-interacting sRz and sRz1 (▴). Spectrum for a 4:1 molar ratio (20 μM sRz:5 μM sRz1) mixture of sRz and sRz1 (•). (B) Difference plot for sRz–sRz1 complex. Spectrum shown was generated by subtracting spectrum of the sRz–sRz1 mixture from the sum of the individual sRz and sRz1spectra. (C): Titration of complex formation by change in alpha-helical content. A solution of sRz (10 μM) was titrated with a concentrated stock of sRz1 in 2.5 μM increments and the change in ellipticity at 222 nm was monitored. A horizontal dotted line indicates the mean millidegree value (16.1) for those points that reside in the plateau region of the spectrum. A solid vertical line indicates the lowest concentration of sRz1 that falls within the standard deviation (0.9) of points within plateau region. Spectra were corrected for dilution and ellipticity of the sRz1 stock solution alone.
The previous isolation of a detergent solubilized Rz–Rz1 complex following lysogenic induction1 did not rule out the possibility of an indirect association of the two proteins. The successful purification of sRz and sRz1 made it possible to investigate the potential for a direct interaction between the Rz and Rz1 periplasmic domains. Mixing of sRz and sRz1 resulted in an increase in negative ellipticity [Fig. 4(A)], indicating that sRz and sRz1 formed a complex accompanied by a conformational change. Multiple linear regression (MLR) analysis of the difference spectrum [Fig. 4(B)] indicates that the changes in secondary structure due to sRz–sRz1 complex formation are primarily alpha-helical (50%). Figure 4(C) shows the change in ellipticity at 222 nm as sRz is titrated with increasing amounts of the sRz1 protein. The ellipticity change is saturated on addition of 10 μM sRz1, indicating the complex consists of an equimolar amount of sRz to sRz1.
The Rz protein is stabilized by Rz1 in vivo
The simplest interpretation of these results is that the sRz protein becomes more ordered, assuming more alpha-helical character, on forming a complex with sRz1. Both topology and genetics mandate that this interaction occurs via the C-termini of both proteins.1,8 Evidence that this interaction occurs in vivo was obtained by assessing the state of the full-length Rz protein in whole cells in which the Rz gene was expressed at physiological levels (Fig. 5). In the absence of Rz1, but not in its presence, a significant fraction of the Rz protein accumulated as a ∼12 kDa species. These samples were collected by rapid trichloroacetic acid (TCA) precipitation from induced cells in which neither holin nor endolysin was produced. The results indicate that in vivo, Rz1 protects the C-terminal domain of Rz from proteolysis by forming a complex that spans the entire periplasm through the meshwork of the intact PG.
Figure 5.
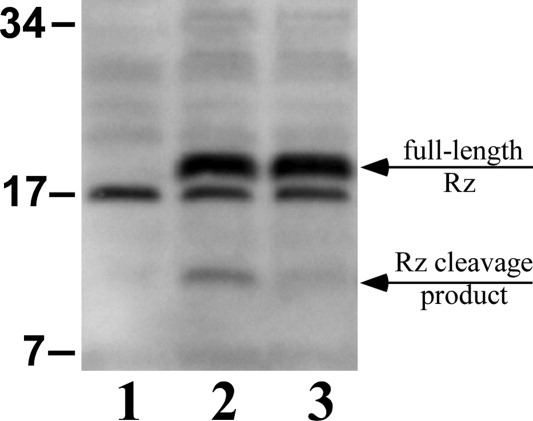
Apparent proteolysis of Rz in whole cells lacking Rz1 expression. Probing of total cellular protein with an anti-Rz antibody following SDS-PAGE. The plasmids pRE (lane 1), pRz (lane 2), and pRzRz1 (lane 3) were induced. An arrow indicates the position of the Rz degradation product in lane 2 as well as the full-length Rz protein in lanes 2 and 3. MW standards expressed in kilodaltons are indicated to the left of the western blot.
TEM and single particle analysis of the Rz–Rz1 complex
Attempts to assess the mass of the sRz–sRz1 complex by gel-filtration chromatography were unsuccessful because of the tendency of the mixtures to aggregate and precipitate at concentrations above 1 mg mL−1. Negatively stained specimens of samples prepared by mixing the proteins and incubating for 10 min revealed a field of mono-disperse rod-shaped particles [Fig. 6(A)]. The length of the rods varied from 14 to 45 nm with an average length of 24 nm and a width of 5.7 nm. Although a lengthwise heterogeneity existed, single particle analysis of ∼1300 particles revealed some class averages with a coil-like or helical pattern and a repeat length of ∼4 nm [Fig. 6(B), Boxes 4–6]. This pattern, although noisier, was also apparent in raw images of the complexes [Fig. 6(B), Boxes 1–3]. Importantly, no particles were observed by transmission electron microscopy (TEM) for either sRz or sRz1 alone at the concentrations used for complex formation (data not shown).
Figure 6.
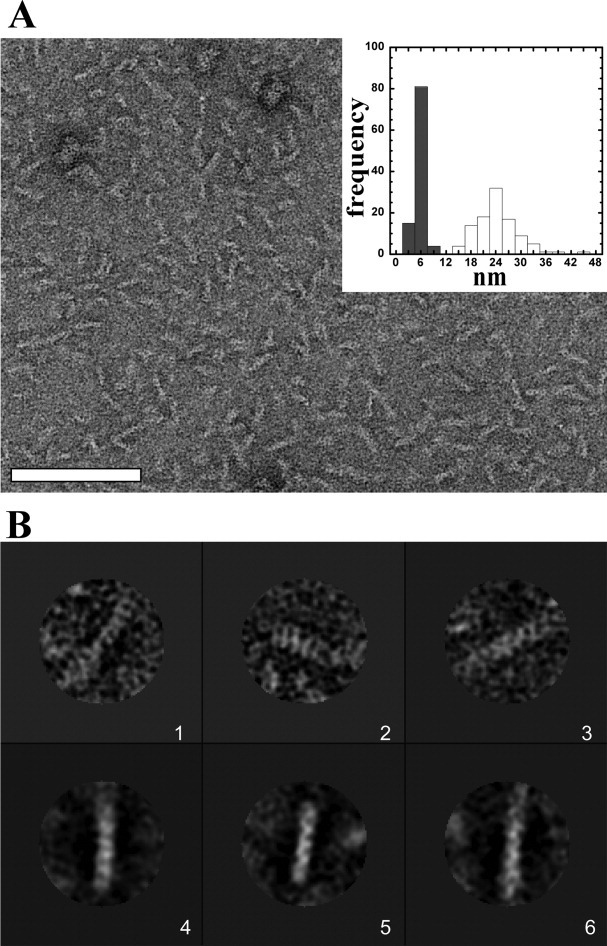
TEM and single particle analysis of sRz–sRz1 complex. (A) The sRz–sRz1 complex is an extended rod-shaped structure. Image is of a negative-stained sample containing a 4:1 molar ratio of sRz:sRz1 (6.3 μM sRz: 1.5 μM sRz1 or 0.1 mg mL total protein). Inset is a histogram representing the length (white bars) and width (grey bars) distribution of the sRz–sRz1 complexes. Scale bar is 100 nm. (B) Single particles and characteristic class averages of the sRz–sRz1 complex. Panels 1-3 are single particles and panels 4-6 are class averages. Scale bar is 10 nm.
The width of the E. coli periplasm matches the average length of the sRz–sRz1 complexes
In vivo, the Rz–Rz1 complex must span the periplasm, so it was of interest to compare the dimensions of the particles formed by oligomerization of sRz and sRz1 with the distance between the outer surface of the IM and the inner surface of the OM. Systematic measurements of the width of the periplasm are surprisingly scarce, especially if electron-microscopy studies that involve dehydration and fixation of the cell are excluded. The periplasmic width was previously reported to be 23.89 ± 4 nm, but, even in this study, osmoprotectants that might influence the geometry of the periplasm were used.12 Accordingly, we measured the width of the periplasm under our standard growth conditions, using cryogenic electron microscopy (cryo-EM) without osmoprotectants or fixation, in 31 cells (Fig. 7). Excluding the polar regions of the cell, where the periplasmic width was highly variable, we obtained a width of 25.5 ± 3.1 nm, which is also consistent with the average length of the sRz–Rz1 complexes.
Figure 7.
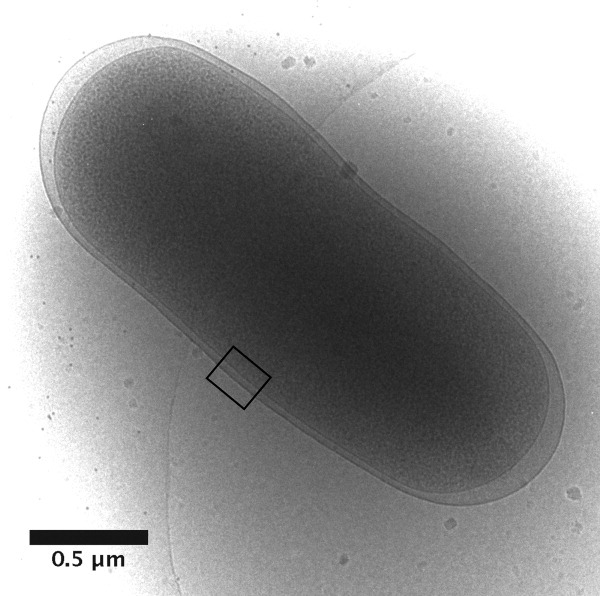
Determination of periplasmic dimensions using cryo-electron microscopy. E. coli K-12 cells in logarithmic phase were plunged into liquid ethane and imaged by cryo-electron microscopy. Shown is a representative whole, frozen-hydrated cell with an inset box indicating the region of interest. The average distance between the inner and outer membranes at the mid-length of 31 such cells was 25.5 ± 3.1 nm. The periplasmic distance increases at the poles as shown in this example.
DISCUSSION
Compelling genetic and evolutionary arguments have been made that Rz and Rz1 function as a complex, mediated by the C-terminal elements of their periplasmic domains.8 Indeed, an Rz–Rz1 complex was isolated by detergent extraction of membranes following lysogenic induction.1 However, this finding neither did rule out the possibility of an indirect interaction or a requirement for other phage or host proteins nor could it be ruled out that the complex formed during detergent extraction. Here, using purified periplasmic domains of the two proteins, we have unambiguously demonstrated Rz–Rz1 complex formation, detectable both by changes in the CD spectrum following titration of sRz with sRz1 [Fig. 4(C)] and by TEM analysis of the protein mixtures (Fig. 6). Moreover, the significant increase in protein order revealed by the CD analysis of the complex, compared with the individual purified proteins, is consistent with the proteolytic instability of Rz in vivo in the absence of Rz1 (Fig. 5). In turn, the Rz1-dependent stabilization of Rz in whole cells indicates that, during the latent period, the two proteins accumulate in this complex while the PG is intact.
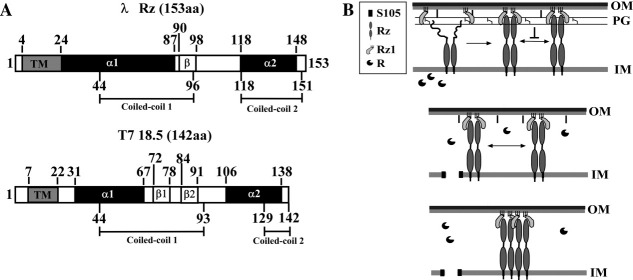
Taken together and with the perspective of previous studies, these results allow the formulation of a more detailed model for Rz–Rz1 structure and function. We suspect that the increase in alpha-helical structure associated with sRz–sRz1 binding is primarily due to changes in sRz as the CD analysis of the Rz dimer falls well short of its predicted alpha-helical content (73%). A guide for thinking about the Rz–Rz1 interaction can be derived from a yeast two-hybrid analysis done on a library prepared from phage T7 deoxyribonucleic acid (DNA), revealing that the minimum interacting domains were the last 10 residues of gp18.5 and the last 50 residues of gp18.7, the Rz and Rz1 equivalents, respectively.13 The simplest notion is that sRz1 binds to the disordered C-terminal domain of sRz and causes extension of alpha-helical conformation in the C-terminal direction. In addition, an exceptional content of heptad-repeat coiled-coil determinants characterize the predicted alpha-helical regions of Rz and its equivalents [Fig. 8(A)]. The Rz1-dependent extension of the Rz alpha-helical structure would bring more of these determinants into register in the Rz dimer. The concomitant formation of the large supramolecular rod-like structures could be explained by formation of polymeric coiled-coil structures, a notion supported by the helical periodicities that are observed in some of the image classes [Fig. 6(B), Boxes 4––6]. The extended particles, which display a distinctive left-handed helical pattern, suggest that the parallel coiled-coil sRz dimers are arranged longitudinally with respect to one another. In fact, coiled-coil bundling may underlie the tendency of concentrated mixtures of sRz–sRz1 to aggregate and precipitate, perhaps because the sRz–sRz1 complexes, if free in solution, can undergo heptad-repeat coiled-coil interactions out of register. The Rz and mature Rz1 proteins contribute 129 and 39 periplasmic residues respectively, with the former predicted to be ∼ two-thirds alpha-helical and the latter likely to be in an extended conformation, given the high (10/39) proline content [Fig. 1(A,B)]. Using axial translations of 0.15 nm/residue and 0.3 nm/residue for alpha-helical and extended conformations, respectively, the Rz–Rz1 complexes could span the ∼26 nm width of the E. coli periplasm, determined by cryo-EM measurements (Fig. 7), even if the interhelical coiling of the Rz domains reduces the overall length. The average width of an individual complex particle (i.e., 5.7 nm) is consistent with four to five sRz coiled-coil complexes (8–10 sRz proteins, respectively) bundled together in a manner analogous to that observed with protofilaments of α-keratin.14 An equimolar number of sRz1 proteins [Fig. 4(C)] could interact with the sRz polymeric bundle in a C-terminal to C-terminal manner resulting in the rod-shaped particles visualized in Figure 6(A). In passing, we note that concentrated solutions of sRz have a tendency to become opaque and particulate if placed on ice, a phenomenon reversed by the simple expedient of warming to room temperature (Berry and Young, unpublished). This behavior may reflect that lower temperature may have a similar effect on stabilizing alpha-helical content of the C-terminus of sRz as does binding of sRz1.
Figure 8.
Coiled-coil propensity of the large spanin subunit and lateral oligomerization model for the spanin complex. (A) The location of potential coiled-coil regions within λRz and T7 18.5 is indicated by amino acid position underneath the respective illustration. The amino acid positions of relevant secondary structure features are indicated above the illustrations and are based on previously published predictions.8 (B) Three step model for lambda lysis. The molecules involved are: the holin, S105, shown as an integral membrane protein (black boxes); the endolysin, R, shown as globular soluble protein with a wedge-shaped cavity, representing the murein transglycosylase active site; Rz, a type II integral membrane protein with an N-terminal TMD (black rectangles) and a periplasmic domain with two predicted alpha-helical domains (ovals); and Rz1, a small OM lipoprotein shown as a crescent shape tethered to the membrane by three lines representing the three fatty acyl groups that decorate the N-terminal Cys residue. As illustrated in the upper panel, the C-terminal end of each subunit constituting the Rz dimer is unordered before Rz1 binding. Following formation of the spanin complex via C-terminal interactions between Rz and Rz1, the PG blocks the lateral diffusion and thus interaction of Rz–Rz1 complexes. The R protein is shown escaping through a hole formed by triggering of the holin S105 and attacking the PG (middle panel). This leads to at least local destruction of the PG (middle panel). In turn, this allows lateral diffusion of Rz–Rz1 complexes and oligomeric bundling of Rz–Rz1 complexes (lower panel). Other important features of the envelope, including the IM, the network of PG, the OM, and the major OM lipoprotein Lpp, attached covalently to the PG, are shown for context. The dark gray portion of the OM represents the lipopolysaccharide layer.
At this point, it is important to determine whether the supramolecular rod-shaped structures formed by sRz–sRz1 are biologically significant. Genetic studies are underway to identify lysis-defective Rz/Rz1 missense mutants, with the goal of identifying mutants blocked in each step of the pathway. Biochemical analysis of mutant periplasmic domains may allow us to correlate biological function and rod formation. In addition, cross-linking studies may allow us to detect the formation of higher-order oligomers after PG removal. Nevertheless, the average length of the polymers is 24 nm, consistent with the 25.5 nm value for the width of the periplasm obtained from our cryo-EM measurements on whole cells. Moreover, the heterogeneity of the lengths might be due to the tendency of coiled-coil structures to match up out of register. In vivo, the alpha-helical domains of Rz would be fixed in register by the anchoring N-terminal TMD, so that the coiled-coil polymers would be expected to be homogeneous in length. We suggest that the rod structures are representative of an oligomerization underlying the Rz–Rz1-mediated disruption of the OM, the last of three sequential steps of the lysis program, as shown in cartoon form in Figure 8(B). In this scheme, stable Rz–Rz1 heterotetramers (two Rz and Rz1 subunits) are formed during the latent period, resulting in conformational changes toward more helical order in the C-terminal domain of Rz [Fig. 8(B)]. As each heterotetramer would be trapped within the meshwork of the PG, lateral, high-order coiled-coil interactions would be blocked. These complexes linking the two membranes would accumulate harmlessly in the envelope throughout the late gene expression period of the infection cycle. For phages with canonical holins and endolysins, the first step in the lytic program finally begins with the lethal triggering of the holin in the IM, resulting in the termination of macromolecular synthesis and formation of micron-scale holes in the bilayer. The second step is the destruction of the PG by the endolysin molecules released from the cytoplasm. The removal of the PG meshwork would then allow lateral, coiled-coil oligomerization of the Rz–Rz1 complexes. How these oligomers might affect OM disruption is unclear, but it is worth noting that coiled-coil interactions are thought to be responsible for bringing membranes into proximity and potentiating membrane fusion events in the trafficking of secretory vesicles in eukaryotic cells.15 At the end of the phage infection cycle, even localized fusion of the IM and OM would likely be catastrophic to maintain the envelope integrity once the PG layer is compromised.
Finally, it is also worth noting that in some phages, Rz–Rz1 is replaced by a single protein, the prototype for which is gp11 of coliphage T1. Gp11 not only has an OM lipoprotein signal at its N-terminus but also has a TMD at its extreme C-terminus, and thus is predicted to span the periplasm as a single molecule. It too would be liberated to undergo lateral oligomerization when the murein is degraded by the endolysin. However, the conformational basis of this interaction is likely to be completely different, as the periplasmic domain of gp11 has no predicted alpha-helical structure or heptad repeats.8
MATERIALS AND METHODS
Bacterial growth and induction
The bacterial strains used in this study are listed in Supporting Information (Table I). Bacterial cultures were grown in standard LB media supplemented with MgCl2 (10 mM), ampicillin (100 μg mL−), kanamycin (40 μg mL), and chloramphenicol (10 μg mL) when appropriate. Culture growth and lysis profiles were monitored as previously described.16 Briefly, overnight and starter cultures were diluted 300:1 and grown with aeration at 30°C for lysogenic cultures and 37°C for cultures of BL21(DE3) and RY17299 lacIq1. Small-scale starter cultures intended for inoculation of large-scale batch cultures were started from a slurry of ∼100 fresh overnight colonies and grown to mid-log phase before subculture. Lysogens were thermally induced at A550 ∼0.3 by aeration at 42°C for 20 min, followed by continued growth at 37°C. Large-scale batch cultures carrying the indicated plasmids were induced for expression by the addition of 1 mM final concentration of isopropyl β-d-thiogalactosidase (IPTG) at an A550 of 0.6.
Before the purification of the Rz and Rz1 periplasmic domains, complementation analysis was utilized as described previously,1,7 to demonstrate that various missense alleles of Rz and Rz1 retain function. Briefly, the plasmids carrying an Rz or Rz1 mutant allele, pRzC99S, pRzC152S, pRzC99S,C152S, and pRz1C29S, are derivatives of the medium-copy plasmid pRE carrying the late promoter, pR′. In all cases, the λ late gene activator Q is supplied in trans from an induced prophage. Complementation was assessed by monitoring A550 following lysogenic induction. All mutants of Rz and Rz1 were found to complement nonfunctional RzQ100am and Rz1W38am alleles, respectively. A functional Rz and Rz1 are essential for host lysis when the growth medium is supplemented with 10 mM MgCl2.
DNA manipulations
Isolation of plasmid DNA, DNA amplification by polymerase chain reaction (PCR), DNA transformation, and DNA sequencing were performed as previously described.17 Oligonucleotides (primers) were obtained from Integrated DNA Technologies (Coralville, IA) and were used without further purification. Restriction and DNA-modifying enzymes were purchased from New England Biolabs (Ipswich, MA); all reactions using these enzymes were performed according to the manufacturer's instructions. Site-directed mutagenesis was performed using the QuikChange kit from Stratagene (La Jolla, CA) as described previously.18 Oligonucleotide (primer) sequences are listed in Supporting Information (Table II). Inverse PCR was carried out through a modified version of QuickChange site-directed mutagenesis. Forward and reverse primers, which anneal to regions directly flanking the desired deletion region, were generated. These forward and reverse primers, unlike traditional QuickChange primers, anneal to the plus and minus strands, respectively. The entire inverse PCR reaction is then treated with DpnI. The PCR product is purified with a PCR purification kit (Qiagen) and treated with T4 polynucleotide kinase before ligation. The DNA sequence of all constructs was verified by automated fluorescence sequencing performed at the Laboratory for Plant Genome Technology at the Texas Agricultural Experiment Station.
Plasmid construction
All plasmids used and generated in the course of this study are listed in Supporting Information (Table I). The plasmid pSRzH6, used for overexpression of sRz, was generated by Inverse PCR using pRzH6 as a template. The plasmid pRzH6 was generated by direct PCR using a forward primer (RzHISFor-2), which contains an NdeI site and a reverse primer (RzHISRev-2), which contains a GGHHHHHH tag followed by a BglII site. Using pRz as a template, these forward and reverse primers were used to amplify the Rz gene. The RzHIS fragment was then ligated to a pETduet backbone, which was previously subjected to NdeI and BglII digestion. The nucleotides of pRzH6 corresponding to residues 2-24 of the Rz reading frame were then deleted by Inverse PCR using the primers RzHISdelFor and RzHISdelRev. Cysteine to serine substitutions at positions 99 and 152 of the Rz reading frame were achieved by site-directed mutagenesis using the primer pair RzC99SFor/Rev and RzHISC152SFor/Rev, respectively. The resulting plasmid was pSRzH6.
Two plasmids, pH6SUMOφsRz1 and pSUMOφsRz1H6, were generated for the overexpression and purification of the Rz1 periplasmic domain (residues 21-60). The plasmid pH6SUMOφsRz1 was produced by first amplifying codons 21–60 of Rz1 using primer pair SUMORz1For/Rev and pRz1 as a template. The resulting fragment and the plasmid pTB146 were digested with SapI and XhoI. The cleaved fragment was then ligated to the pTB146 backbone. The use of a SapI site junction between the smt3 and Rz1 reading frames results in a seamless in-frame fusion of the two respective gene fragments. The plasmid pSUMOφsRz1H6 was generated by relocating the oligohistidine tag from the N-terminus of smt3 to the extreme C-terminus of the Rz1 fragment. Using pH6SUMOφsRz1 as a template, the primer pair SUMORz1For-2/Rev-2 was used to amplify the sumoφRz1 region. The forward primer contained an NdeI site and annealed to the template beginning at the start codon of smt3, just downstream of the oligohistidine tag. The reverse primer contains an oligohistidine tag followed by a HindIII site flanking the stop codon. The resulting PCR fragment, which contains the smt3φRz1 region and a oligohistidine tag following codon 60 of Rz1, was ligated to pET11a following digestion of both with NdeI and BamHI. The substitution of cysteine at position 29 of the Rz1 reading frame for serine was performed through site-directed mutagenesis using the primer pair SUMORz1C29SFor/Rev.
Protein purification
Proteins containing oligohistidine tags were isolated through immobilized metal affinity chromatography (IMAC). Six 1 L cultures of BL21(DE3) carrying the plasmid pSUMOφsRz1H6, pSRzH6, or pTB145 (SUMO tag protease, ULPI) were harvested approximately 5 h after induction by centrifugation in a Beckman JA-10 rotor at 8 K rpm for 10 min. Unless indicated otherwise, all following steps were conducted at 4°C. Cell pellets were resuspended in 60 mL of 20 mM sodium phosphate, 300 mM NaCl, pH7.5 supplemented with 1 mM PMSF, Protease Inhibitor Cocktail (Sigma-Aldrich, P8849), and 100 μg mL−1 final concentrations of DNase and RNase (Sigma Aldrich). Cells were broken by passage through a French pressure cell (Spectronic Instruments, Rochester, NY) at 16 K lb in−2 and the resulting lysate was cleared by centrifugation in a Sorvall SS-34 rotor at 15 K rpm for 20 min. Cleared lysates were passed successively through a 5 and 0.45 μm filter before the addition of 1M imidazole pH7.5 to a final concentration of 20 mM imidazole. Lysates were then passed over 1 mL bed volume of Talon metal affinity resin (Clontech), which was pre-equilibrated with 20 mM sodium phosphate, 300 mM NaCl, and 20mM Imidazole pH7.5. The resin bed was then washed with 10 bed volumes of equilibration buffer. Bound protein was eluted with six bed volumes of 20 mM sodium phosphate, 300 mM NaCl, and 500 mM Imidazole pH7.5. Elution fractions were pooled and concentrated to 3 mL final volume with an Ultra-4 3,000 MWCO centrifugal filter device (Amicon) and loaded successively onto a prep grade HiLoad 16/60 Superdex-75 column (GE healthcare) pre-equilibrated at room temperature with 10 mM sodium phosphate, 100 mM NaCl, and pH 7.5. The peak A280 fractions were collected and assessed for purity by SDS-PAGE and coomassie blue staining before pooling or concentration.
Cleavage of the N-terminal SUMO tag to yield sRz1 (residues 21-60 of Rz1 followed by a oligohistidine tag) required treatment of the fusion protein with the catalytically active yeast UlpI protease. UlpI was expressed from plasmid pTB145 and purified as described previously.19 Pooled S-75 peak elution fractions (see above) containing the N-terminal SUMO-tagged sRz1 were concentrated to 1 mL with an Ultra-4 3,000 MWCO centrifugal filter device (Amicon) and dialyzed extensively against UlpI protease reaction buffer (50 mM Tris-Cl, 150 mM NaCl, 10% glycerol, 1mM DTT, 0.05% Triton X-100, and pH 8) before the addition of UlpI protease to a 1:100 molar ratio. The reaction was incubated overnight on ice. The sRz1 polypeptide was separated from the UlpI protease and the freed SUMO domain gel filtration on a Superdex-75 column (Amersham) pre-equilibrated with 10 mM sodium phosphate, 100 mM NaCl, and pH 7.5. Specificity of the cleavage reaction was confirmed by automated Edman protein sequencing on an ABI 492 Procise protein sequencer at the Protein Chemistry Laboratory of Texas A&M University.
Western blotting
Strain RY17299 lacIq1 harboring pQ and the indicated plasmid was induced with 1 mM IPTG at an A550 of 0.3. At 50-min postinduction, precipitation of total cellular protein was achieved by the rapid addition of 1 mL of culture to a solution of 100% TCA to achieve a final concentration of 10% TCA. Precipitation reactions were mixed thoroughly by vortexing and left on ice for 15 min. Precipitated protein was collected by centrifugation in a tabletop microcentrifuge at 18 K g for 10 min. Excess TCA was removed by twice resuspending pellets in 1 mL of cold acetone before pelleting protein in the microcentrifuge at 18,000× rcf. TCA pellets were air dried and resuspended in 1× SDS-PAGE sample loading buffer supplemented with 100 mM β-mercaptoethanol. SDS-PAGE and western blotting with the anti-Rz antibody were performed as described previously.1
Gel filtration
Size exclusion chromatography was carried out using a Superdex 75 10/300 GL column calibrated with the Low Molecular Weight Gel Filtration Calibration Kit on a AKTA FPLC (GE Healthcare).
Electron microscopy
Extinction coefficients for the sRz and sRz1 proteins were calculated using the ExPASy Proteomics server.20 Protein concentrations of purified sRz and sRz1 stock solutions were determined by absorbance at 280 nm using the molar extinction coefficients 7450 and 11,000 M−1 cm−1, respectively. Purified sRz and sRz1 dialyzed extensively against TBS buffer pH 7.4 were mixed at a molecular ratio of 4:1 (6.3 μM sRz: 1.5 μM sRz1), respectively and left to incubate for ∼10 min. Specimens were prepared for electron microscopy according to the method of Valentine.21 Briefly, a 50 to 100 μL drop of sample was placed on parafilm, and carbon on mica was floated onto the surface of the drop for 60 s to allow the protein complexes to adhere. The carbon was subsequently floated onto a 100 μL drop of 2% (w/v) aqueous uranyl acetate for 15 s and finally picked up with a 400 mesh copper grid and blotted dry. Specimens were observed using a JEOL 1200EX transmission electron microscope operating at 100 kV. Images were recorded at a nominal magnification of 25,000× on Kodak 4489 film and developed using standard procedures. Negatives were scanned using a Leafscan 45 scanner. The final pixel size was 4.08 Å on the specimen scale.
For cryo-electron microscopy, whole cells were frozen and imaged as described before.3 Briefly, the host RY16504 carrying the plasmid p0 was induced for 60 min with 1 mM IPTG at A550 = 0.4 and 5 μL of culture was immediately applied to holey carbon films (C-Flat, Protochips). Grids were plunge frozen in liquid ethane using an FEI Vitrobot. Specimens were observed under low-dose conditions using an FEI Tecnai F20 transmission electron microscope operating at 200 kV and equipped with a Gatan Tridiem GIF. Images were recorded at underfocus values ranging between 10 and 15 μm and a 20 eV slit on the energy filter.
Single particle averaging
Approximately 1300 Rz–Rz1 particles were manually boxed using the Boxer software in the EMAN package.22 Particle images were then low-pass filtered to remove spatial frequencies beyond 15 Å. Particles were then subjected to rotational and translational alignment using an artificial image of a rod as a reference. Finally, reference-free class averages were calculated using the refine 2d.py routine in EMAN.
Circular dichroism measurements
CD spectra were obtained using an Aviv model 202SF spectropolarimeter. The sRz and sRz1 proteins were dialyzed extensively against 10 mM sodium phosphate, 100 mM NaCl pH 7.5. Samples were loaded into a 0.1 cm quartz cuvette and equilibrated to 25°C for 5 min before being scanned. Scans from 260–190 nm with a 1 nm step size and 5 s averaging time were applied to all samples in triplicate. Protein concentrations for stock solutions of sRz and sRz1 were determined by A280. CD and difference spectra were fit by nonconstrained MLR23 using a polypeptide reference set.24 Spectra of the individual sRz and sRz1 proteins were also fit using the CONTINLL25,26 and CDSSTR27 programs available on the DICHROWEB server.28 To determine the molar ratio of sRz to sRz1 in the complex, a 10 μM solution of sRz in 10 mM sodium phosphate, 100 mM NaCl, pH 7.5, at 25°C was titrated, in 2.5 μM increments, with a stock solution of sRz1 supplemented with 10 μM sRz. The change in ellipticity due to binding was corrected for the sRz1 stock solution alone and dilution from 200 to 350 μL.
Coiled-coil prediction
The amino acid sequences of λRz and the unrelated functional equivalent from T7, gp18.5, were examined for their propensity to form coiled-coils through the use of the COILS29 and CCHMM_PROF30 programs.
Acknowledgments
The constructive criticism and suggestions from the rest of the Young group are gratefully acknowledged, as is the kind gift of plasmids and reagents by T. Bernhardt (Department of Microbiology and Molecular Genetics, Harvard Medical School). M. Scholtz and his group generously provided the equipment and expertise needed for obtaining the CD spectra. The expert technical support and collegial interactions of the staff of the Protein Chemistry Laboratory were critical for assessing the progress of Rz1 purification.
References
- 1.Berry J, Summer EJ, Struck DK, Young R. The final step in the phage infection cyclfe: the Rz and Rz1 lysis proteins link the inner and outer membranes. Mol Microbiol. 2008;70:341–351. doi: 10.1111/j.1365-2958.2008.06408.x. [DOI] [PMC free article] [PubMed] [Google Scholar]
- 2.Young R, Wang IN. Phage lysis. In: Calendar R, editor. The bacteriophages. Oxford: Oxford University Press; 2006. pp. 104–126. [Google Scholar]
- 3.Dewey JS, Savva CG, White RL, Vitha S, Holzenburg A, Young R. Micron-scale holes terminate the phage infection cycle. Proc Natl Acad Sci USA. 2010;107:2219–2223. doi: 10.1073/pnas.0914030107. [DOI] [PMC free article] [PubMed] [Google Scholar]
- 4.Casjens S, Eppler K, Parr R, Poteete AR. Nucleotide sequence of the bacteriophage P22 gene 19 to 3 region: identification of a new gene required for lysis. Virology. 1989;171:588–598. doi: 10.1016/0042-6822(89)90628-4. [DOI] [PubMed] [Google Scholar]
- 5.Young R, Way J, Way S, Yin J, Syvanen M. Transposition mutagenesis of bacteriophage lambda: a new gene affecting cell lysis. J Mol Biol. 1979;132:307–322. doi: 10.1016/0022-2836(79)90262-6. [DOI] [PubMed] [Google Scholar]
- 6.Hanych B, Kedzierska S, Walderich B, Uznanski B, Taylor A. Expression of the Rz gene and the overlapping Rz1 reading frame present at the right end of the bacteriophage lambda genome. Gene. 1993;129:1–8. doi: 10.1016/0378-1119(93)90689-z. [DOI] [PubMed] [Google Scholar]
- 7.Zhang N, Young R. Complementation and characterization of the nested Rz and Rz1 reading frames in the genome of bacteriophage lambda. Mol Gen Genet. 1999;262:659–667. doi: 10.1007/s004380051128. [DOI] [PubMed] [Google Scholar]
- 8.Summer EJ, Berry J, Tran TA, Niu L, Struck DK, Young R. Rz/Rz1 lysis gene equivalents in phages of Gram-negative hosts. J Mol Biol. 2007;373:1098–1112. doi: 10.1016/j.jmb.2007.08.045. [DOI] [PubMed] [Google Scholar]
- 9.Juncker AS, Willenbrock H, Von Heijne G, Brunak S, Nielsen H, Krogh A. Prediction of lipoprotein signal peptides in Gram-negative bacteria. Protein Sci. 2003;12:1652–1662. doi: 10.1110/ps.0303703. [DOI] [PMC free article] [PubMed] [Google Scholar]
- 10.Kedzierska S, Wawrzynow A, Taylor A. The Rz1 gene product of bacteriophage lambda is a lipoprotein localized in the outer membrane of Escherichia coli. Gene. 1996;168:1–8. doi: 10.1016/0378-1119(95)00712-1. [DOI] [PubMed] [Google Scholar]
- 11.Mossessova E, Lima CD. Ulp1-SUMO crystal structure and genetic analysis reveal conserved interactions and a regulatory element essential for cell growth in yeast. Mol Cell. 2000;5:865–876. doi: 10.1016/s1097-2765(00)80326-3. [DOI] [PubMed] [Google Scholar]
- 12.Matias VR, Al-Amoudi A, Dubochet J, Beveridge TJ. Cryo-transmission electron microscopy of frozen-hydrated sections of Escherichia coli and Pseudomonas aeruginosa. J Bacteriol. 2003;185:6112–6118. doi: 10.1128/JB.185.20.6112-6118.2003. [DOI] [PMC free article] [PubMed] [Google Scholar]
- 13.Bartel PL, Roecklein JA, SenGupta D, Fields S. A protein linkage map of Escherichia coli bacteriophage T7. Nat Genet. 1996;12:72–77. doi: 10.1038/ng0196-72. [DOI] [PubMed] [Google Scholar]
- 14.Watts NR, Jones LN, Cheng N, Wall JS, Parry DA, Steven AC. Cryo-electron microscopy of trichocyte (hard alpha-keratin) intermediate filaments reveals a low-density core. J Struct Biol. 2002;137:109–118. doi: 10.1006/jsbi.2002.4469. [DOI] [PubMed] [Google Scholar]
- 15.Jahn R, Scheller RH. SNAREs—engines for membrane fusion. Nat Rev Mol Cell Biol. 2006;7:631–643. doi: 10.1038/nrm2002. [DOI] [PubMed] [Google Scholar]
- 16.Smith DL, Chang CY, Young R. The lambda holin accumulates beyond the lethal triggering concentration under hyperexpression conditions. Gene Expr. 1998;7:39–52. [PMC free article] [PubMed] [Google Scholar]
- 17.Tran TA, Struck DK, Young R. Periplasmic domains define holin-antiholin interactions in t4 lysis inhibition. J Bacteriol. 2005;187:6631–6640. doi: 10.1128/JB.187.19.6631-6640.2005. [DOI] [PMC free article] [PubMed] [Google Scholar]
- 18.Grundling A, Blasi U, Young R. Biochemical and genetic evidence for three transmembrane domains in the class I holin, lambda S. J Biol Chem. 2000;275:769–776. doi: 10.1074/jbc.275.2.769. [DOI] [PubMed] [Google Scholar]
- 19.Bendezu FO, Hale CA, Bernhardt TG, de Boer PA. RodZ (YfgA) is required for proper assembly of the MreB actin cytoskeleton and cell shape in E. coli. EMBO J. 2009;28:193–204. doi: 10.1038/emboj.2008.264. [DOI] [PMC free article] [PubMed] [Google Scholar]
- 20.Gasteiger E, Hoogland C, Gattiker A, Duvaud S, Wilkins MR, Appel RD, Bairoch A. Protein identification and analysis tools on the ExPASy server. In: Walker JM, editor. The proteomics protocols handbook. Totowa, New Jersey: Humana Press; 2005. pp. 571–607. [Google Scholar]
- 21.Valentine RC, Shapiro BM, Stadtman ER. Regulation of glutamine synthetase. XII. Electron microscopy of the enzyme from Escherichia coli. Biochemistry. 1968;7:2143–2152. doi: 10.1021/bi00846a017. [DOI] [PubMed] [Google Scholar]
- 22.Ludtke SJ, Baldwin PR, Chiu W. EMAN: semiautomated software for high-resolution single-particle reconstructions. J Struct Biol. 1999;128:82–97. doi: 10.1006/jsbi.1999.4174. [DOI] [PubMed] [Google Scholar]
- 23.Greenfield NJ. Methods to estimate the conformation of proteins and polypeptides from circular dichroism data. Anal Biochem. 1996;235:1–10. doi: 10.1006/abio.1996.0084. [DOI] [PubMed] [Google Scholar]
- 24.Brahms S, Brahms J. Determination of protein secondary structure in solution by vacuum ultraviolet circular dichroism. J Mol Biol. 1980;138:149–178. doi: 10.1016/0022-2836(80)90282-x. [DOI] [PubMed] [Google Scholar]
- 25.Provencher SW, Glockner J. Estimation of globular protein secondary structure from circular dichroism. Biochemistry. 1981;20:33–37. doi: 10.1021/bi00504a006. [DOI] [PubMed] [Google Scholar]
- 26.van Stokkum IH, Spoelder HJ, Bloemendal M, van Grondelle R, Groen FC. Estimation of protein secondary structure and error analysis from circular dichroism spectra. Anal Biochem. 1990;191:110–118. doi: 10.1016/0003-2697(90)90396-q. [DOI] [PubMed] [Google Scholar]
- 27.Sreerama N, Woody RW. Estimation of protein secondary structure from circular dichroism spectra: comparison of CONTIN, SELCON, and CDSSTR methods with an expanded reference set. Anal Biochem. 2000;287:252–260. doi: 10.1006/abio.2000.4880. [DOI] [PubMed] [Google Scholar]
- 28.Whitmore L, Wallace BA. Protein secondary structure analyses from circular dichroism spectroscopy: methods and reference databases. Biopolymers. 2008;89:392–400. doi: 10.1002/bip.20853. [DOI] [PubMed] [Google Scholar]
- 29.Lupas A, Van Dyke M, Stock J. Predicting coiled coils from protein sequences. Science. 1991;252:1162–1164. doi: 10.1126/science.252.5009.1162. [DOI] [PubMed] [Google Scholar]
- 30.Bartoli L, Fariselli P, Krogh A, Casadio R. CCHMM_PROF: a HMM-based coiled-coil predictor with evolutionary information. Bioinformatics. 2009;25:2757–2763. doi: 10.1093/bioinformatics/btp539. [DOI] [PubMed] [Google Scholar]


