

Abstract
We present an improved version of RosettaHoles, a methodology for quantitative and visual characterization of protein core packing. RosettaHoles2 features a packing measure more rapidly computable, accurate and physically transparent, as well as a new validation score intended for structures submitted to the Protein Data Bank. The differential packing measure is parameterized to maximize the gap between computationally generated and experimentally determined X-ray structures, and can be used in refinement of protein structure models. The parameters of the model provide insight into components missing in current force fields, and the validation score gives an upper bound on the X-ray resolution of Protein Data Bank structures; a crystal structure should have a validation score as good as or better than its resolution.
Keywords: protein folding, protein design, protein core packing, protein structure validation, crystallography
Computationally generated protein structures are often incorrect, suggesting some aspect of the physical chemistry is not modeled properly. For Rosetta1 models, bond geometry is ideal by construction, low scoring models have very few clashes, and van der waals attractive interactions are comparable to corresponding crystal structures; these models easily pass standard structure validation tests such as MolProbity2 and Whatcheck.3 In contrast, visual inspection suggests that computational models have more volumetric packing flaws than observed in crystal structures. This is at least in part due to some missing piece in the Rosetta energy function; crystal structures that are energy minimized in the Rosetta force field display the same packing flaws seen in decoy structures, though to a lesser extent (Supporting Information 1). A missing piece of the puzzle could be the cavity free energy, which is inherently volumetric in nature. However, the total cavity volume is not a good discriminator between computational predictions and corresponding X-ray structures (Supporting Information 2). The original version of RosettaHoles4 showed that discrimination between computational models and crystal structures can be achieved using volumetric information. In this updated version, we seek to achieve better performance with a simplified method.
To define a packing score that captures cavity free energy, we take an approach inspired by the implicit solvation model of Lazaridis and Karplus.5 We define the volume occupied by an atom VOCC to consist of all space that is closer to the surface of that atom than any other. We assume a radially symmetrical form for the packing energy density, and for each atom determine the total packing energy by integrating the packing energy density over the volume VOCC occupied by that atom. For computational convenience, VOCC is divided into 20 radial bins so that the packing score of an atom is the dot product of 20 energy weights with the volumes of 20 concentric spherical shells within the confines of VOCC. For a visual illustration and further details, see Supporting Information 3. The concentric shells are spaced closer together near the molecular surface to give more detail, and further apart farther from the surface to improve computation time. Volumes are computed using a customized version of the DAlphaBall program,6 which efficiently computes exact surfaces and volumes, as well as their derivatives with regard to atomic coordinates.
To allow this new term to also capture inaccuracies in the solute–solvent contribution to the solvation energy described in Rosetta by the Lazaridis-Karplus model, we make it atom type dependent, defining 28 atom types and allowing the packing score density vectors to differ between them. The 16 sidechain atom types comprise six carbon types, six nitrogen types, three oxygen types, and one sulfur type. The 12 backbone types are N, CA, C, and O for each of three secondary structures: helix, loop, and sheet. Because most structures in the Protein Data Bank7 specify neither the positions of hydrogen atoms nor complete information about solvent molecules, we ignore water and hydrogen atoms. Early tests based on crystal structures that included all hydrogen atoms indicated that ignoring hydrogen atoms did not significantly affect performance. Other atoms such as ligands and crystallization agents are not scored directly but are included in surface and volume calculations. Therefore, the atoms that are scored feel their effects.
We make no further assumptions about the forms of the radial packing score density vector, instead learning it from structures in the Protein Data Bank. The packing energy density values are determined by a combination of support vector discrimination and regression carried out using the R language.8,9 Linear kernels were used exclusively to preserve differentiability, facilitate combination and interpretation of models, and reduce risk of over-fitting. Two data sets were used in training and testing: the 40,000+ X-ray crystal structures from the Protein Data Bank as of December 2008 along with ∼25,000 decoy structures computationally generated from 128 different protein sequences with Rosetta. To produce a packing score SDECOY to be used in molecular modeling, we take volume distributions (see above) from crystal structures of 1.28 Å or better from the Protein Data Bank as positive examples and volume distributions from computationally generated decoy structures as negative examples. The SDECOY for a whole structure is the sum of the score for each atom. Full details of the training procedure are available in Supporting Information 4.
The parameters defining the SDECOY score are shown in Figure 1, with atom types grouped into three categories: hydrophobic atoms, polar atoms, and backbone atoms. A handful of atom types, such as sulfur, proline, nitrogen, and aromatic carbons did not fit well into these categories and are shown in the bottom panel (all parameter values are shown individually in Supporting Information 4). Values below the dashed horizontal line indicate that void volume at the given distance from the atomic surface is favorable (more like high-resolution crystal structures), and values above the dashed line indicate that void volume at the given distance from the atomic surface is unfavorable (more like low-resolution or computationally generated models). Three dashed vertical lines are drawn at radii of 0.4, 0.7, and 1.4 Å, which are of particular interest (as explained in the next three paragraphs).
Figure 1.
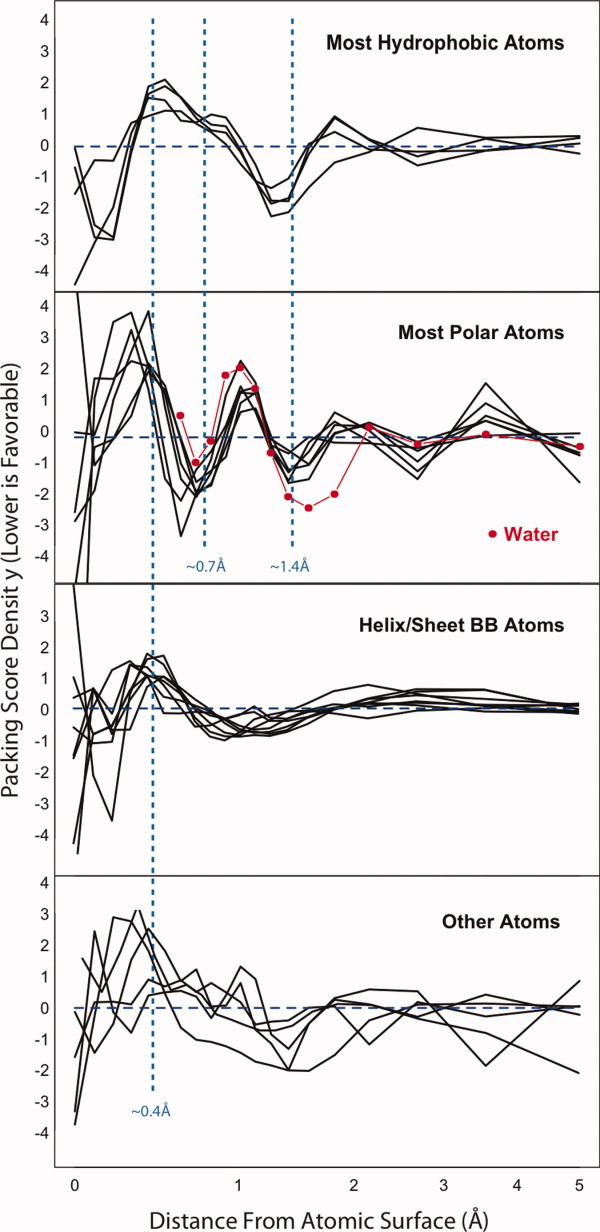
The complete set of parameters of the RosettaHoles2 score. The x axis is shown on a logarithmic scale for clarity. The first category (top panel) includes hydrophobic side chain atoms CH1, CH2, CH3 and hydrophobic backbone atoms in loops. The second category (second panel) consists of polar side chain atoms and polar backbone atoms in loop configurations. The third group of atoms comprises the four backbone atom types in helix or sheet configurations (third panel). The fourth group of atoms, proline backbone nitrogen, sulfur, aromatic carbons, and the outermost sidechain carbon on glutamine and asparagine, do not cluster with the others. The contribution to the RosettaHoles2 score for an atom is simply the dot product of the binned atomic volumes with the relevant parameters above. The parameter values shown are for the SDECOY score; the parameters of the SVal and SRESL models follow similar trends.
The first category (Fig. 1, top panel) includes hydrophobic side chain atoms CH1, CH2, CH3 as well as hydrophobic backbone atoms in loops, which are more similar to side chain hydrophobic atoms than those atoms in sheet or helix configurations. For the parameters up to the radius of hydrogen, this group of atoms displays spatial preferences consistent with more uniform packing in crystal structures and clumped arrangements in decoys, as observed previously4; these hydrophobic atoms prefer a small amount of void volume immediately surrounding the atom and discourage void volume further from the atomic surface. This effect is observed for all atom types but is most pronounced for hydrophobic atoms. Based on a simple analysis of sphere packing in a box, we interpret this as an entropic effect (Supporting Information 4); evenly distributed atoms are likely to have higher vibrational freedom than clumped atoms. Void volume at the radius of a water molecule (1.4 Å) is favorable, because the solvent is not explicitly represented in our model. In reality, surface atoms will pack with solvent molecules and when solvent is removed, the effect will be more void volume at 1.4 Å and less slightly below and slightly above this distance.
The second category (Fig. 1, middle panel) consists of polar side chain atoms and polar backbone atoms in loop configurations. These atoms show some of the clumping and solvation effects seen in hydrophobic atoms. There is a significant difference between hydrophobic and polar atoms in void volume ∼0.7 Å from the atomic surface (the middle line dotted blue line on the plot). Such void volume is favorable for polar atoms and unfavorable for hydrophobic atoms. Shown in red are the parameters that result from a support vector machine model trained to discriminate hydroxyl oxygen atoms in computationally generated models vs. water oxygen atoms in sub 1.0 Å resolution crystal structures. The crystal waters show preferences quite similar to side chain polar atom types, including favoring void volume around 0.7 Å from the atomic surface, at least in comparison to computationally generated models. Based on the similarity in packing of polar side chain atoms to water, we believe the 0.7 Å peak is due to formation of water-like hydrogen bonding networks, an effect unique to polar atoms.
The third group of atoms comprises the four backbone atom types in helix or sheet configurations (Fig. 1, bottom panel). The shape of the packing energy density for all backbone atoms in regular secondary structure elements is similar. Mid-sized voids around 0.4 Å in radius are uniformly disfavored, consistent with clumping and general packing defects in low resolution and computationally generated structures. In a trend unique to the backbone atoms, void volume at 1–1.5 Å from the atomic surface is slightly favored, which could indicate that the helices and sheets of the decoy and low-resolution crystal structures are overly ideal; increasing curvature of the secondary structure elements should slightly increase void volume in this range.
Because RosettaHoles2 is differentiable, it can be used in computational refinement of protein structures. One of the clearest indicators of a missing component in pairwise decomposable Rosetta energy functions is that sub 1.3 Å resolution crystal structures, which have good SDECOY scores with essentially no exceptions, often have quite poor SDECOY scores after refinement in the Rosetta full-atom force field. We have found that if the RosettaHoles2 SDECOY score is included in this refinement weighted such that SDECOY contributes ∼10% of the total variance, the refined models do not have degraded SDECOY scores. Decoys refined with and without the SDECOY score included undergo an equal improvement in Rosetta full-atom energy, so inclusion of SDECOY does not adversely impact the ability to improve the Rosetta energy (Supporting Information 5). Further, sub 1.3 Å crystal structures refined with the SDECOY score included stay ∼5% closer to the native configuration than those refined without SDECOY. Although this analysis was conducted with the Rosetta full-atom force field, in previous work we have observed that similar packing flaws appear in all computationally generated structures submitted to past Critical Assessment of Structure Prediction experiments.4 For this reason, we would expect including RosettaHoles2 in other force fields to yield similar improvements in packing quality.
For validation of experimental crystal structures, we have produced a second score SRESL via support vector regression using the resolution of the crystal structure as the target value. The support vector regression analysis is more involved than the discriminatory approach taken in the packing score, but the resulting score SRESL has the same form and number of parameters as the SDECOY score. Some trends in the parameters are similar to those discussed above (full detail in Supporting Information 6). To help in the identification of particularly bad packing defects, the validation score also includes a contribution from SDECOY:
The SDECOY term is quite small for most Protein Data Bank structures, so its effect is to penalize the minority of entries that have packing flaws uncommon in crystal structure of any resolution. Such defects are invisible to SRESL because it is trained only on crystal structures, very few of which contain major flaws. Figure 2 shows how the SVAL, SRESL, and SDECOY scores change with increasingly grievous structural flaws. Based on two structures of T4 lysozyme (177L and 179L), which are nearly identical except for the packing flaws in 179L, a spectrum of intermediate structures was generated ranging from good packing (Fig. 2 left side, 177L) to very bad packing (Fig. 2 right side, 179L). The sensitive SRESL score increases linearly with small flaws but plateaus as flaws become more severe, whereas the complementary SDECOY score increases slowly with small flaws but quite rapidly as flaws become more severe. The combined SVAL score increases roughly linearly with the magnitude of the packing flaws, from minor to severe.
Figure 2.
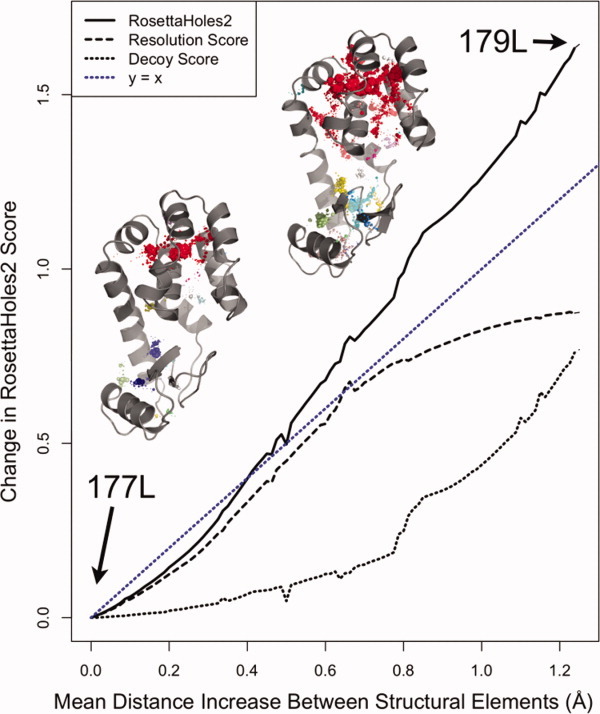
Dependence of SVAL, SRESL, and SDECOY on the extent of structural flaws. Starting from two structures of T4 lysozyme (177L and 179L), which are nearly identical except for the packing flaws in 179L, a spectrum of intermediate structures was generated ranging from good packing (left side, 177L) to very bad packing (right side, 179L). The sensitive SRESL score increases linearly with small flaws but plateaus as flaws become more severe, whereas the complementary SDECOY score increases slowly with small flaws but quite rapidly as flaws become more severe. The combined SVAL score increases roughly linearly with the magnitude of the packing flaws, from minor to severe.
Figure 3 shows SVAL for crystal structures in the Protein Data Bank as of Summer 2009. Only structures that contain primarily protein, are greater than 10 kDa, and have little missing density are shown. The packing score correlates with resolution and is calibrated so that the SRESL score should be lower than the resolution in most cases. Points above the red line in the figure are in the 1th (worst) percentile for structures of similar resolution. All of the 1st percentile outliers were visually inspected, and those without obvious packing flaws are marked in black. Most such structures lack a hydrophobic core, despite having a mass greater than 10 kDa. The most extreme of the inspected structures are labeled on the plot. Those marked with asterisks are older structures, solved before 1990. Those marked in red were submitted by Murthy et al. and have been recommended for retraction by the University of Alabama. The retracted structure 179L mentioned above has a cell parameter error that caused packing flaws by inflating the structure slightly. It is possible that many other outliers can be explained by mistakenly inflated cell parameters.10 Many transmembrane proteins have poor RosettaHoles2 scores due to highly polar cores and hydrophobic surfaces. The entry 2SNS11 is a very old structure from 1977 and considered to be a flawed structure by many authorities. The crystal for entry 1KT3 was produced at pH 2,12 which could be related to its unusual structural features. The two conformers for 1TQG both show packing flaws, possibly due to some issue with multiple conformer refinement.13
Figure 3.
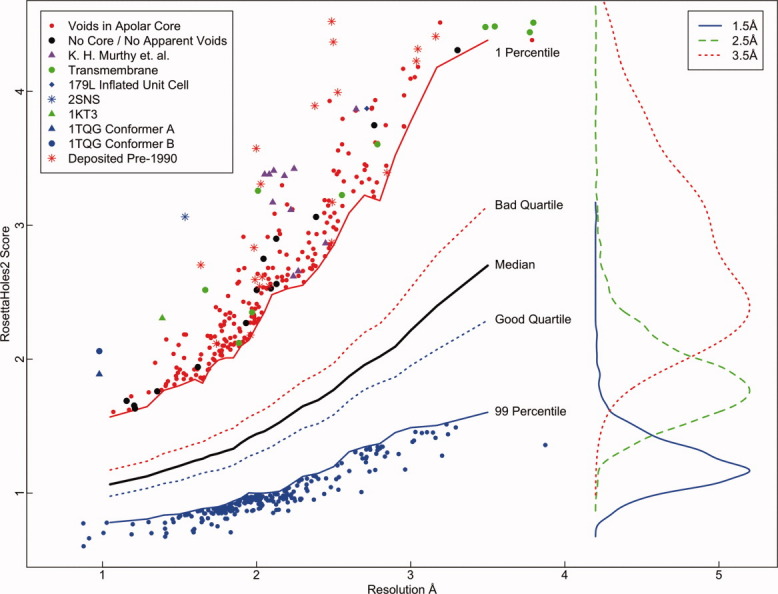
SVAL for crystal structures in the Protein Data Bank as of Summer 2009. Only structures that contain primarily protein, are greater than 10 kDa, and have little missing density are shown. The packing score correlates with resolution and is calibrated so that the SRESL score should be lower than the resolution in most cases. Points above the dashed line in the figure deviate by more than 5 standard deviations from the population of structures of similar resolution. The most extreme of these outlying structures are labeled on the plot. On the right are histograms showing the distribution of RosettaHoles2 scores for structures at 1.5, 2.5, and 3.5 Å resolution.
In summary, RosettaHoles2 offers technical improvements including differentiability, faster runtime, better accuracy, and clearer identification of flawed structures. Additionally, the model and parameters are simplified and more interpretable, providing insight into structural flaws captured by the RosettaHoles measure. The differentiable volumetric score functions SDECOY and SRESL in RosettaHoles2 are complementary to existing molecular force fields and structure validation criteria. All popular molecular mechanics force fields are pairwise decomposable and are thus fundamentally unable to capture the kinds of multibody volumetric effects modeled in RosettaHoles2. The same is true of popular structural validation criteria, which do an excellent job characterizing bond geometry and overpacking (atomic clashes), but do not address volumetric features of structures, chiefly local underpacking. For these reasons, we believe RosettaHoles2 should contribute to improvements in protein structure modeling, design, and validation.
References
- 1.Das R, Baker D. Macromolecular modeling with rosetta. Annu Rev Biochem. 2008;77:363–382. doi: 10.1146/annurev.biochem.77.062906.171838. [DOI] [PubMed] [Google Scholar]
- 2.Davis IW, Leaver-Fay A, Chen VB, Block JN, Kapral GJ, Wang X, Murray LW, Arendall WB, 3rd, Snoeyink J, Richardson JS, Richardson DC. MolProbity: all-atom contacts and structure validation for proteins and nucleic acids. Nucleic Acids Res. 2007;35:W375–W383. doi: 10.1093/nar/gkm216. [DOI] [PMC free article] [PubMed] [Google Scholar]
- 3.Hooft RWW, Vriend G, Sander C, Abola EE. Errors in protein structures. Nature. 1996;381:272–272. doi: 10.1038/381272a0. [DOI] [PubMed] [Google Scholar]
- 4.Sheffler W, Baker D. RosettaHoles: rapid assessment of protein core packing for structure prediction, refinement, design, and validation. Protein Sci. 2009;18:229–239. doi: 10.1002/pro.8. [DOI] [PMC free article] [PubMed] [Google Scholar]
- 5.Lazaridis T, Karplus M. Effective energy function for proteins in solution. Proteins. 1999;35:133–152. doi: 10.1002/(sici)1097-0134(19990501)35:2<133::aid-prot1>3.0.co;2-n. [DOI] [PubMed] [Google Scholar]
- 6.Edelsbrunner E, Koehl P. Goodman Jacob E, Pach János, Emo Welzl. Vol. 52. Cambridge: MSRI publications; The geometry of biomolecular solvation; pp. 243–275. Combinatorial and computational geometry. [Google Scholar]
- 7.Berman HM, Westbrook J, Feng Z, Gilliland G, Bhat TN, WeissigHelge, Shindyalov IN, Bourne PE. The Protein Data Bank. Nucleic Acids Res. 2000;28:235–242. doi: 10.1093/nar/28.1.235. [DOI] [PMC free article] [PubMed] [Google Scholar]
- 8.Drucker H, Burges CJC, Kaufman L, Smola A, Vapnik V. Support vector regression machines. Cambridge, MA: NIPS. MIT Press; pp. 155–161. [Google Scholar]
- 9.R Development Core Team. Vienna, Austria: R Foundation for Statistical Computing; 2008. R: A language and environment for statistical computing. ISBN 3-900051-07-0, Available at: http://www.R-project.org. [Google Scholar]
- 10.Tronrud DE, Matthews BW. Sorting the chaff from the wheat at the PDB. Protein Sci. 2009;18:2–5. doi: 10.1002/pro.13. [DOI] [PMC free article] [PubMed] [Google Scholar]
- 11.Cotton FA, Hazenjunior EE, Jr, Legg MJ. Staphylococcal nuclease: proposed mechanism of action based on structure of enzyme-thymidine 3′,5′-bisphosphate-calcium ion complex at 1.5-A resolution. Proc Natl Acad Sci USA. 1979;76:2551. doi: 10.1073/pnas.76.6.2551. PubMed. [DOI] [PMC free article] [PubMed] [Google Scholar]
- 12.Calderone V, Berni R, Zanotti G. High-resolution structures of retinol-binding protein in complex with retinol: pH-induced protein structural changes in the crystal state. J Mol Biol. 2003;329:841–850. doi: 10.1016/s0022-2836(03)00468-6. [DOI] [PubMed] [Google Scholar]
- 13.Quezada CM, Gradinaru C, Simon MI, Bilwes AM, Crane BR. Helical shifts generate two distinct conformers in the atomicresolution structure of the CheA phosphotransferase domainfrom Thermotoga maritima. J Mol Biol. 2004;341:1283–1294. doi: 10.1016/j.jmb.2004.06.061. [DOI] [PubMed] [Google Scholar]