

Abstract
Efficient methods for quantifying dissociation constants have become increasingly important for high-throughput mutagenesis studies in the postgenomic era. However, experimentally determining binding affinity is often laborious, requires large amounts of purified protein, and utilizes specialized equipment. Recently, pulse proteolysis has been shown to be a robust and simple method to determine the dissociation constants for a protein–ligand pair based on the increase in thermodynamic stability upon ligand binding. Here, we extend this technique to determine binding affinities for a protein–protein complex involving the β-lactamase TEM-1 and various β-lactamase inhibitor protein (BLIP) mutants. Interaction with BLIP results in an increase in the denaturation curve midpoint, Cm, of TEM-1, which correlates with the rank order of binding affinities for several BLIP mutants. Hence, pulse proteolysis is a simple, effective method to assay for mutations that modulate binding affinity in protein–protein complexes. From a small set (n = 4) of TEM-1/BLIP mutant complexes, a linear relationship between energy of stabilization (dissociation constant) and ΔCm was observed. From this “calibration curve,” accurate dissociation constants for two additional BLIP mutants were calculated directly from proteolysis-derived ΔCm values. Therefore, in addition to qualitative information, armed with knowledge of the dissociation constants from the WT protein and a limited number of mutants, accurate quantitation of binding affinities can be determined for additional mutants from pulse proteolysis. Minimal sample requirements and the suitability of impure protein preparations are important advantages that make pulse proteolysis a powerful tool for high-throughput mutagenesis binding studies.
Keywords: pulse proteolysis, binding affinity, dissociation constant, BLIP, TEM-1, protein stability
Introduction
Experimentally evaluating binding affinities for protein–protein interactions is critical for understanding macromolecular interactions in biological systems. Assays that characterize binding commonly rely on experimental methods capable of differentiating bound and unbound forms. For example, intrinsic protein properties such as circular dichroism (CD), fluorescence, and heat capacity, or enzymatic activity (in enzyme–inhibitor interactions) frequently serve as useful experimental probes. In other cases, a reporter chromophore can be introduced to provide a signal that changes upon complexation, though the modification may occasionally alter a protein's native properties. Although these methods provide accurate quantitation of binding, they are often laborious, utilize specialized equipment, and require large amounts of highly purified protein samples. Protein–protein complexes are particularly challenging due to the additional difficulty in distinguishing the signal from the individual protein components using some of these techniques (CD, intrinsic fluorescence, and heat capacity). Therefore, the development of a simple, efficient procedure for quantifying binding energies in protein–protein interactions should be valuable to high-throughput mutagenesis efforts.
Recently, simple, straightforward methods, including pulse proteolysis and cysteine reactivity, have been reported for determining protein stabilities and protein-small molecule dissociation constants.1–3 In these approaches, binding is detected by the ligand's ability to increase the thermodynamic stability of its protein partner.4 By interacting preferentially with the folded conformation(s), the ligand shifts the equilibrium away from the unfolded state, which is measured in a denaturation experiment. Pulse proteolysis relies on the susceptibility of the unfolded population to proteolytic degradation, and thus binding is measured indirectly by the corresponding decrease in the unfolded population.
In pulse proteolysis experiments, proteins are subjected to a short pulse of protease, short enough to completely digest the unfolded species without perturbing the folded population. Because the proteolysis pulse is shorter than the re-equilibration time (unfolding rate) of the protein, it allows an accurate description of the components at equilibrium. When done in the context of a denaturation experiment with urea, one can determine the fraction of folded protein as a function of urea concentration using SDS PAGE and densitometry analysis, similar to what one would do with traditional spectroscopic probes (CD, fluorescence).5 Importantly, the protease thermolysin and SDS PAGE analysis are compatible with the high concentrations of urea used in these experiments. The method is robust, simple, and suitable to crude protein samples and mixtures. For example, experiments on overexpressed proteins from crude Escherichia coli lysates yield accurate  values.2 Here, we extend pulse proteolysis to investigate binding affinities in a protein–protein complex. In addition to its suitability for detection of protein–protein association, its utility toward a protein that displays complex, non-two-state denaturation behavior is demonstrated.
The nanomolar affinity complex between TEM-1 β-lactamase and the β-lactamase inhibitor protein (BLIP) has been exploited to study the determinants of affinity and specificity in protein–protein interactions.6,7 TEM-1 β-lactamase catalyzes the hydrolysis of β-lactam rings of penicillins and early generation cephalosporins, thereby inactivating these clinically useful antibiotics. BLIP competitively occludes the enzyme active site, thereby restoring the antibiotic's effectiveness. The folding pathway of TEM-1 has been described in some detail and is multistate.8,9 In this respect, it presents a nontrivial and realistic test of the method, as many interesting protein interactions are not composed of small, well-behaved, two-state-folding proteins. We propose pulse proteolysis as a high-throughput method for evaluating complex stabilities for a wide variety of protein–protein interactions.
Results and Discussion
TEM-1 and BLIP are suitable candidates for pulse proteolysis experiments
The urea denaturation curves for TEM-1 and BLIP were probed individually by pulse proteolysis and assessed by SDS-PAGE to determine their suitability for binding studies [Fig. 1(A)]. TEM-1 and BLIP show single transitions with urea midpoints, or Cm values, at 2.00M and 4.49M, respectively. BLIP remains resistant to proteolysis at urea concentrations where TEM-1 is degraded, and thus BLIP was chosen to serve as the ligand while the shift in Cm of TEM-1 was probed [Fig. 1(B,C)]. To assure that the proteolysis data was reflecting the equilibrium fraction of unfolded protein, the effect of varying the pulse length (from 1–10 min) at a urea concentration equal to the observed Cm was investigated. Figure 1(D) demonstrates that the concentration of folded TEM-1 is fairly impervious to thermolysin, making it an appropriate candidate for these pulse proteolysis studies.
Figure 1.
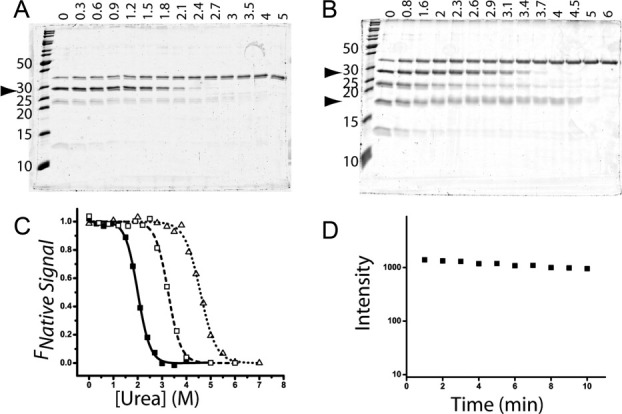
Pulse proteolysis denaturation experiments analyzed on 15% SDS polyacrylamide gels for (A) TEM-1 and (B) TEM-1 with BLIP. Urea concentrations are listed above each lane, and molecular weights for ladder proteins are listed to the left of each gel, with an arrow pointing at the proteins of interest (TEM-1, 29 kDa or BLIP, 17 kDa). The remaining bands are due to thermolysin (35 kDa) and its autolysis products (23 and 12 kDa). (C) Denaturation curves for TEM-1 (solid squares), TEM-1 with BLIP (open squares), or BLIP (open triangles) fitted to a Boltzmann sigmoid to determine the inflection point, 2.00M and 4.49M urea for TEM-1 and BLIP, respectively. (D) Varying the pulse length from 1–10 min at a urea concentration equal to the Cm has little effect on native TEM-1.
ΔCm correlates with binding affinity
In a TEM-1 denaturation experiment, BLIP increases the apparent stability of TEM-1 by preferentially binding to folded conformations, which results in a measureable Cm shift. Furthermore, applying this method to BLIP mutants with different binding affinities, we observed that lower affinity mutants yield a smaller Cm shift. Hence, ΔCm correlates with affinity (Table I). Thus, pulse proteolysis serves as a simple, effective method to assay for mutations that affect affinity in protein–protein interactions.
Table 1.
The Addition of BLIP Increases the Cm of TEM-1
| BLIP mutation | TEM-1 ΔCm (M) | TEM-1/BLIP Kd (nM) |
|---|---|---|
| WT | 1.25 ± 0.07 | 1.7 ± 0.1 |
| E73M | 1.11 ± 0.05 | 7.8 ± 0.4 |
| E73M/S130K/S146M | 0.71 ± 0.06 | 53 ± 3 |
| E73M/S130K | 0.69 ± 0.05 | 83 ± 5 |
The ΔCm values observed by proteolysis experiments are shown along with the independently determined dissociation constants for each complex.
Dissociation constants can be determined with a suitable proteolysis basis set
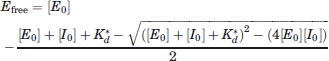
In a two-state system (U-N), where the ligand binds the native conformation, the stability increase due to a ligand (Δ) is dependent on two parameters: the dissociation constant for the protein–ligand complex (Kd), and the concentration of free ligand ([L]; Eq. (1)].
| (1) |
In addition, the stability, , is related to the Cm by a scalar quantity that relates energy (kcal/mol) to denaturant concentration (M), and is termed an m-value, ( = mCm). Hence, for such a two-state system, the change in Cm (ΔCm) at a given ligand concentration should be a direct measure of the dissociation constant, Kd [Eq. (2)].
| (2) |
In the TEM-1/BLIP system, the ΔCm should therefore also depend on the dissociation constant and ligand concentration [Eq. (3)].
| (3) |
The TEM-1 unfolding reaction is complex and does not follow a two-state mechanism, as investigated using traditional spectroscopic probes. CD and fluorescence experiments show two transitions that follow a three-state model of denaturation (see Supporting Information). The spectroscopic probes yield different Cm values, indicating that TEM-1 unfolds through multiple intermediate species. The single transition revealed by proteolysis occurs at a lower urea concentration than the events observed by either of the traditional methods, suggesting that there must be a previously undetected intermediate (or partially unfolded conformation) susceptible to proteolysis.
To observe a shift in the Cm of the probe protein, the ligand must interact preferentially with the native state relative to the proteolytically susceptible state. If the ligand binds equally well to the folded and proteolytically susceptible conformation, then proteolysis can not serve as a probe for ligand binding. Athough the proteolytically susceptible state of TEM-1 appears to be an intermediate with significant secondary and tertiary structure (by CD and fluorescence), BLIP must preferentially bind to the native state to account for the Cm shift. Therefore, the ligand's preference for the native state (relative to the proteolytically susceptible state) is required for an observable ΔCm. Although for many proteins, the susceptible state may also bind the ligand, it is reasonable to assume that in the majority of cases, the ligand's affinity for this conformation will be lower than for the fully folded form. This approach should therefore be valid for a wide array of systems.
Because TEM-1 denaturation is clearly not two-state, the dissociation constant cannot simply be calculated from the observed ΔCm. However, using data from the first four TEM-1/BLIP complexes, a plot of RTln([BLIP]/Kd) (where the Kd values have been derived from enzymatic assays, see methods) versus the observed ΔCm from proteolysis experiments demonstrates a linear relationship, allowing us to determine an effective m-value for our system [3.3 ± 0.1 kcal/(mol × M), R = 0.97 (see Supporting Information)].
The strong correlation between RTln([BLIP]/Kd) and ΔCm suggests that in addition to rank ordering the binding affinities of the BLIP mutants, the method may also provide accurate Kd values. Therefore, two additional TEM-1/BLIP mutant complexes were investigated: BLIP Y50A and F142A, which have higher and lower affinities for TEM-1, compared with the other BLIP proteins utilized. Using the proteolysis ΔCm and the calibration curve determined from the basis set above, accurate binding affinities for these two mutant complexes were obtained (Table II).
Table 2.
The Proteolysis Assay Determines Accurate Dissociation Constants for Two Additional BLIP Mutants
| BLIP Y50Aa | BLIP F142Ab | |
|---|---|---|
| ΔCm | 1.41M | 0.73M |
| Kd proteolysis assay | 0.9 nM | 150 nM |
| Kd enzyme assay | 0.57 nM | 96 nM |
The free BLIP concentration utilized was 2 μM.
The free BLIP concentration utilized was 8 μM.
Advantages of pulse proteolysis as a binding assay
We have demonstrated that in addition to provide a rapid screen for mutations that perturb binding, pulse proteolysis can provide accurate quantification of dissociation constants in protein–protein complexes. After calibrating pulse proteolysis experiments on a small set (n = 4) of known TEM-1/BLIP complexes, accurate dissociation constants were calculated for two additional mutants from the observed Cm shift. Because urea can denature both protein partners, successful candidates for this method must have distinct Cm values, where the protein displaying the lower Cm serves as the probe. As the results demonstrate, the protein probed does not necessarily need to display classical two-state folding properties. Additionally, neither protein partner needs to be highly purified, as stabilities using pulse proteolysis have been reported from crude lysates. Though a reliable concentration of the protein ligand is required for calculating dissociation constants, SDS PAGE is an accurate method of quantifying protein concentration in crude samples.10 Furthermore, small sample quantities are required; less than 200 μg of each partner was used for each binding experiment. This method is ideal for high-throughput mutagenesis studies, where large quantities of highly purified protein are difficult to obtain. Thus, calculating accurate Kd values from ΔCm measured by urea pulse proteolysis represents a powerful tool for high-throughput mutagenesis studies of protein–protein systems.
Materials and Methods
Protein expression and purification
BLIP was expressed and purified as described previously.11 The bla TEM-1 gene was cloned behind an OmpA signal to direct periplasmic localization, and expressed by isopropyl-β-d-thiogalactopyranoside induction in Escherichia coli BL21(DE3). The periplasmic fraction was isolated by osmotic shock and passed over an anion exchange column (HiPrep 16/10 DEAE, GE Healthcare). Fractions containing TEM-1 were further purified by size exclusion chromatography (HiLoad 26/60 Superdex 75, GE Healthcare), after which single-use protein aliquots were stored at −80°C.
Pulse proteolysis
The pulse proteolysis protocol described by Park and Marqusee was utilized.5 For monomer denaturation experiments, samples containing 3 μM TEM-1 or 7 μM BLIP and the appropriate urea concentration in reaction buffer (50 mM Tris, 50 mM NaCl, 10 mM CaCl2, pH 8.0) were allowed to equilibrate overnight at room temperature. In binding assays, 3 μM TEM-1 was mixed with 5 μM BLIP (total concentration) in reaction buffer, except for BLIP E73M/S130K and BLIP F142A where 6.5 μM and 10 μM BLIP were used, respectively. Thermolysin (Sigma Chemical) was prepared in 2.5M NaCl and 10 mM CaCl2. A pulse of enzyme to a final concentration of 0.2 mg/mL was applied to begin proteolysis, and reactions were quenched with EDTA sixty seconds after initiation. Samples were analyzed by 15% SDS-PAGE, stained with SYPRO Red (Molecular Probes), and imaged using a Typhoon Trio Variable Mode Imager (GE Healthcare). The free image analysis software, ImageJ, was used to quantify the observed band intensities. The data were fit to a Boltzmann sigmoid to determine the inflection point, or Cm, using the OriginPro software:
| (4) |
All monomer denaturation experiments were performed in triplicate, and the resulting values and errors are averages and standard deviations from three experiments.
Inhibition assays
TEM-1/BLIP dissociation constants were determined by competition with the β-lactam substrate nitrocefin (Becton Dickinson Biosciences). Reactions were initiated by the addition of substrate using the liquid handling capabilities of the FlexstationIII (Molecular Devices), and monitored by following absorbance at 486 nm. Inhibition constants were determined by fitting with OriginPro [Eq. (5)]:
 |
(5) |
From the apparent equilibrium constant,  , a correction for the presence of substrate was applied to calculate Kd [Eq. (6)].
| (6) |
The Km of the enzyme for the β-lactam substrate, nitrocefin, was determined in a separate experiment, and fit to the Henri–Michaelis–Menten equation.
Acknowledgments
We gratefully thank Chiwook Park and members of the Handel laboratory for useful discussions. The authors thank the UCSD Biological Sciences Department for use of their Typhoon Imager.
Glossary
Abbreviations:
- BLIP
β-lactamase inhibitor protein
- CD
circular dichroism
References
- 1.Isom D, Vardy E, Oas T, Hellinga HW. Picomole-scale characterization of protein stability and function by quantitative cysteine reactivity. Proc Natl Acad Sci USA. 2010;107:4908–4913. doi: 10.1073/pnas.0910421107. [DOI] [PMC free article] [PubMed] [Google Scholar]
- 2.Park C, Marqusee S. Pulse proteolysis: a simple method for quantitative determination of protein stability and ligand binding. Nat Methods. 2005;2:207–212. doi: 10.1038/nmeth740. [DOI] [PubMed] [Google Scholar]
- 3.West GM, Tang L, Fitzgerald MC. Thermodynamic analysis of protein stability and ligand binding using a chemical modification- and mass spectrometry-based strategy. Analyt Chem. 2008;80:4175–4185. doi: 10.1021/ac702610a. [DOI] [PubMed] [Google Scholar]
- 4.Pace CN, McGrath T. Substrate stabilization of lysozyme to thermal and guanidine hydrochloride denaturation. J Biol Chem. 1980;255:3862–3865. [PubMed] [Google Scholar]
- 5.Park C, Marqusee S. Quantitative determination of protein stability and ligand binding by pulse proteolysis. Curr Protoc Protein Sci. 2006;46:20.11.21–20.11.14. doi: 10.1002/0471140864.ps2011s46. [DOI] [PubMed] [Google Scholar]
- 6.Albeck S, Schreiber G. Biophysical characterization of the interaction of the β-lactamase TEM-1 with its protein inhibitor BLIP. Biochemistry. 1999;38:11–21. doi: 10.1021/bi981772z. [DOI] [PubMed] [Google Scholar]
- 7.Zhang Z, Palzkill T. Determinants of binding affinity and specificity for the interaction of TEM-1 and SME-1 β-lactamase with β-lactamase inhibitory protein. J Biol Chem. 2003;278:45706–45712. doi: 10.1074/jbc.M308572200. [DOI] [PubMed] [Google Scholar]
- 8.Vanhove M, Lejeune A, Guillaume G, Virden R, Pain RH, Schmid FX, Frere J-M. A collapsed intermediate with nonnative packing of hydrophobic residues in the folding of TEM-1 β-lactamase. Biochemistry. 1998;37:1941–1950. doi: 10.1021/bi972143c. [DOI] [PubMed] [Google Scholar]
- 9.Vanhove M, Raquet X, Frere J-M. Investigation of the folding pathway of the TEM-1 β-lactamase. Proteins. 1995;22:110–118. doi: 10.1002/prot.340220204. [DOI] [PubMed] [Google Scholar]
- 10.Krieg RC, Dong Y, Schwamborn K, Knuechel R. Protein quantification and its tolerance for different interfering reagents using the BCA-method with regard to 2D SDS PAGE. J Biochem Biophys Met. 2005;65:13–19. doi: 10.1016/j.jbbm.2005.08.005. [DOI] [PubMed] [Google Scholar]
- 11.Reynolds KA, Thomson JM, Corbett KD, Bethel CR, Berger JM, Kirsch JF, Bonomo RA, Handel TM. Structural and computational characterization of the SHV-1 β-lactamase-β-lactamase inhibitor protein interface. J Biol Chem. 2006;281:26745–26753. doi: 10.1074/jbc.M603878200. [DOI] [PubMed] [Google Scholar]