Abstract
A multispectral camera is capable of imaging a histologic slide at narrow bandwidths over the range of the visible spectrum. There is currently no clear consensus over the circumstances in which this added spectral data may improve computer-aided interpretation and diagnosis of imaged pathology specimens [1, 2, 3]. Two spectra which are perceived as the same color are called metamers, and the collection of all such spectra are referred to as the metamer set. Highly metameric colors are amenable to separation through multispectral imaging (MSI).
Using the transformation between the spectrum and its perceived color, our work addresses the question of when MSI reveals information not represented by a standard RGB color image. An analytical estimate on the size of the metamer set is derived for the case of independent spectral absorption. It is shown that colors which are closest to the white point on the chromaticity diagram are highly metameric. A numerical method to estimate the metamer set in a domain-specific manner is provided. The method is demonstrated on multispectral data sets of imaged peripheral blood smears and breast tissue microarrays. An a priori estimate on the degree of metamerism from a standard color image is presented.
Index Terms: multispectral, pathology, metamer, color
1. INTRODUCTION: COLOR AND METAMERISM
While several uses for multispectral imaging (MSI) have been demonstrated in pathology [4, 5], there is no unified consensus over when and how MSI might benefit automated analysis [1, 2, 3]. This work examines those scenarios in which imaging the spectrum of an object provides salient information not present in a standard color image.
In 1931, the Commission internationale de l’éclairage (CIE) established an international standard in which three “tristimulus” values, (X, Y, Z), uniquely define a color. The continuous transformation between a spectrum and the associated tristimulus value is given as a weighted integral over the visible spectrum. If Xi = (X, Y, Z) contains the tristimulus color components and ρ(λ) the continuous absorption spectrum, we have,
| (1) |
where the aij are the CIE color matching functions, k a normalizing factor, and ρj the discretely-sampled (measured) representation of ρ(λ). Two different spectra which are perceived as the same color are called metamers. Formally, metamers are different spectral power distributions which induce the same CIE (X, Y, Z) tristimulus value under a given illuminant. Though there are an infinite number of spectral distributions which give rise to each color [6], it is still possible to calculate a probability function on the metamer set. This gives the proportion of a collection of spectra which maps to a given set of tristimulus values.
While the tristimulus values are the standard for defining a color, they are not readily visualized. It is therefore useful to normalize the tristimulus values to attain the relative (x, y, z) chromaticity coordinates,
| (2) |
Since z is uniquely determined by x and y, it is standard to specify the color by (x, y, Y), where x & y give the chromaticity and Y contains the luminance (lightness) of the color. Under these coordinates, the entire gamut of visible chromaticities may be plotted in 2-D, for a fixed luminance value. This plot is known as the chromaticity diagram.
It bears mention that the (x, y, Y) color space is highly nonuniform, meaning the distance between two colors on the chromaticity diagram is not linearly related to the perceptual difference1. MacAdam showed that regions of imperceptible color difference in the CIE (x, y) plane have an elliptical shape (Fig. 1) [8]. The curved edge of the chromaticity diagram, called the spectral locus, represents light comprised of a single, pure wavelength. If one chooses two points of color on the diagram, all the points on the straight line between these colors can be formed by additively mixing the two.
Fig. 1.
Left: MacAdam ellipses in the CIE 1931 chromaticity diagram. Each ellipse is shown as 10 times is actual size. Colors within each ellipse are indistinguishable from the color in the center. 2nd from left: 106 random, independent spectra mapped to the chromaticity diagram. 2nd from right: The highly metameric colors are the “least pure” chromaticities, centered around the white point (1/3, 1/3). A color of a pure wavelength (one near the spectral locus) is highly improbable and least likely to be strongly metameric. Right: The luminosity component is normally distributed.
2. ANALYTICAL SOLUTION
It is possible to derive an analytical expression for a simplified case of the metamer counting problem. The visible spectrum is partitioned in to λ intervals with even spacing Δλ. Consider a set of allowable spectra described by a probability density function,
| (3) |
with This controls the shape of the spectra; it constrains the collection to have the desired properties of smoothness, shape, physical realizability, etc. Note that the size of Δλ is critical in the characterization of P. If Δλ is small, ρj+1 is heavily dependent on ρj (i.e. the spectrum will change little across the two measurements). If Δλ is large, ρj+1 is no longer so dependent on ρj, but there is a danger of under sampling the signal.
We seek the probability density ψ(x, y, Y)dxdydY, namely that a random spectrum, chosen according to the probability density P, falls into a cube of volume dxdydY centered on (x, y, Y). This is the quantitative measure of which colors are most likely metameric. The nonlinearity introduced by the chromaticity transformation (Eqn. 2) makes the direct calculation of ψ(x, y, Y) intractable. Instead, we start by considering the original tristimulus values to first find ψ(X, Y, Z). Additionally, we restrict the problem to the conditions where Δλ is small enough to ensure the sampling frequency is above the Nyquist rate, but large enough that ρj+1 is independent of ρj. Under these conditions, P separates into a product of independent probabilities,
| (4) |
with Due to the independence of each spectral band, Eqn. 1 is a sum of random variables, aijρj. When λ is taken large enough2, the Central Limit Theorem implies a normal distribution for ψ(X, Y, Z),
| (5) |
where Σ is the standard covariance matrix,
| (6) |
and μ⃗ the expected values of the tristimulus coordinates,
| (7) |
In the case where all spectral absorption levels are equally probable, Pj(ρ) = 1, and with Y scaled to the customary range of [0, 100], ψ(X, Y, Z) is a multivariate normal distribution with means and variances given by . The off-diagonal elements of the covariance matrix (not shown) are on the order of the variances, indicating the tristimulus values are strongly dependent3.
As mentioned previously, ψ(x, y, Y) is difficult to solve because the tristimulus values are statistically dependent and the chromaticity coordinates do not reduce to a plain sum of random variables. We can make a change of variables in Eqn. 5 from (X, Y, Z) to (x, y, Y). The volume element dX dY dZ = |J| dxdydY, where the Jacobian is
| (8) |
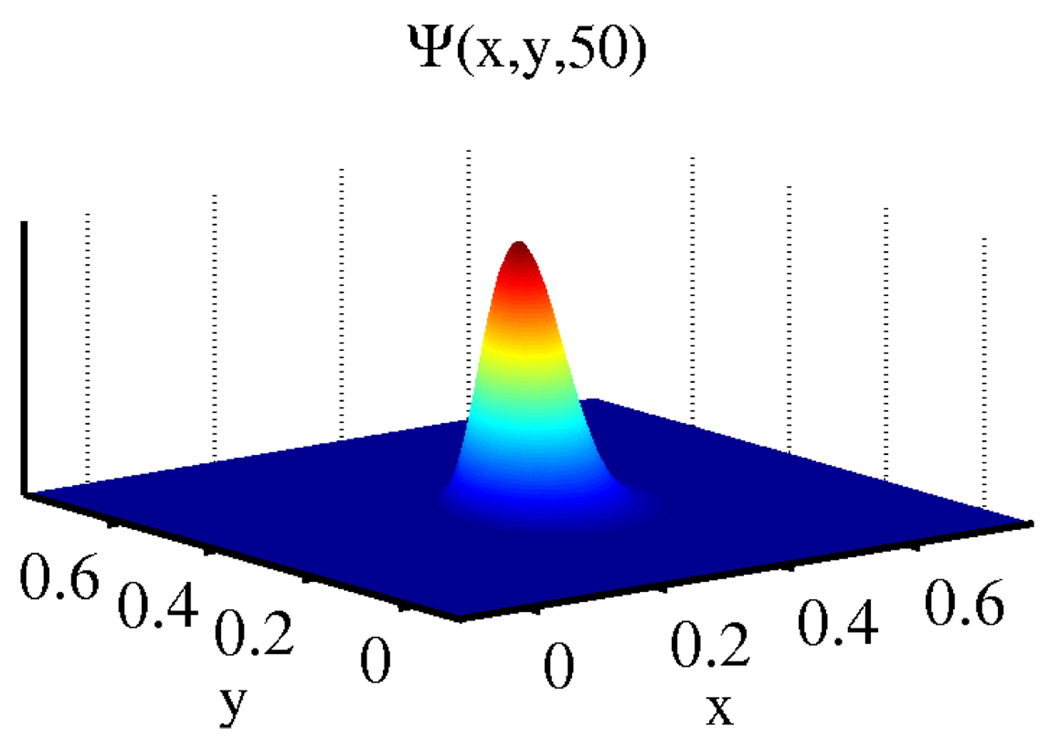
The coordinate vector (X, Y, Z) changes to Y * (x/y, 1, (1 − x − y)/y). The plot of Eqn. 5 with the chromaticity coordinates substituted (Fig. 2) matches the associated empirical distribution (Fig. 1).
Fig. 2.
Theoretical probability density for independent ρj
3. NUMERICAL/EMPIRICAL METHOD
The analytical approach presented in Sec. 2 is highly dependent on the probability density, P(ρ1, ρ2 … ρλ), of the allowable spectral profiles. Unfortunately, it is rarely possible to integrate this expression for any case besides the separable one of Eqn. 4. In this section, a method for numerically constructing the collection of allowable spectra is introduced. It is then possible to empirically solve for the metamer set, without the assumption that ρj+1 is independent of ρj.
We begin by collecting a group of domain-specific “library images.” For example, these may be images of slides with a common stain or sourced from a common tissue type. From these images, a reference library of the spectra is built. A histogram, H, of the differences between consecutive spectral measurements is taken. That is, we tally the distances Δρ = ρj+1 − ρj, Δρ ∈ [−1, 1], for each spectra. Many values satisfying 0 < |Δρ| < 1 imply P(ρj+1 ∩ ρj) ≈ P(ρj+1)P(ρj), whereas values near zero imply the spectra are highly dependent w.r.t. the step size Δλ.
The idea of this method is to use the histogram of Δρ values as an (appropriately normalized) probability density, from which step sizes are drawn for a bounded random walk. A new spectrum is built by starting with a random seed value, ρ1 ∈ [0, 1]. Using random Δρs drawn from H, subsequent values are iteratively constructed according to:
| (9) |
Here, “redraw” indicates that a new Δρ is chosen until ρj + Δρrand ∈ [0, 1]. In this manner, we build a collection of new spectra with similar4 smoothness/independence properties to the spectra in the reference library. A large number of these new spectra are then transformed into the (x, y, Y) space, giving an empirical distribution of the metamer density. We contrast this with simply conducting a large survey of spectra from the reference library images. This method is capable of generating new spectra, thereby circumventing the problem that the most metameric colors would correspond to the most frequently occurring spectra in the library images.
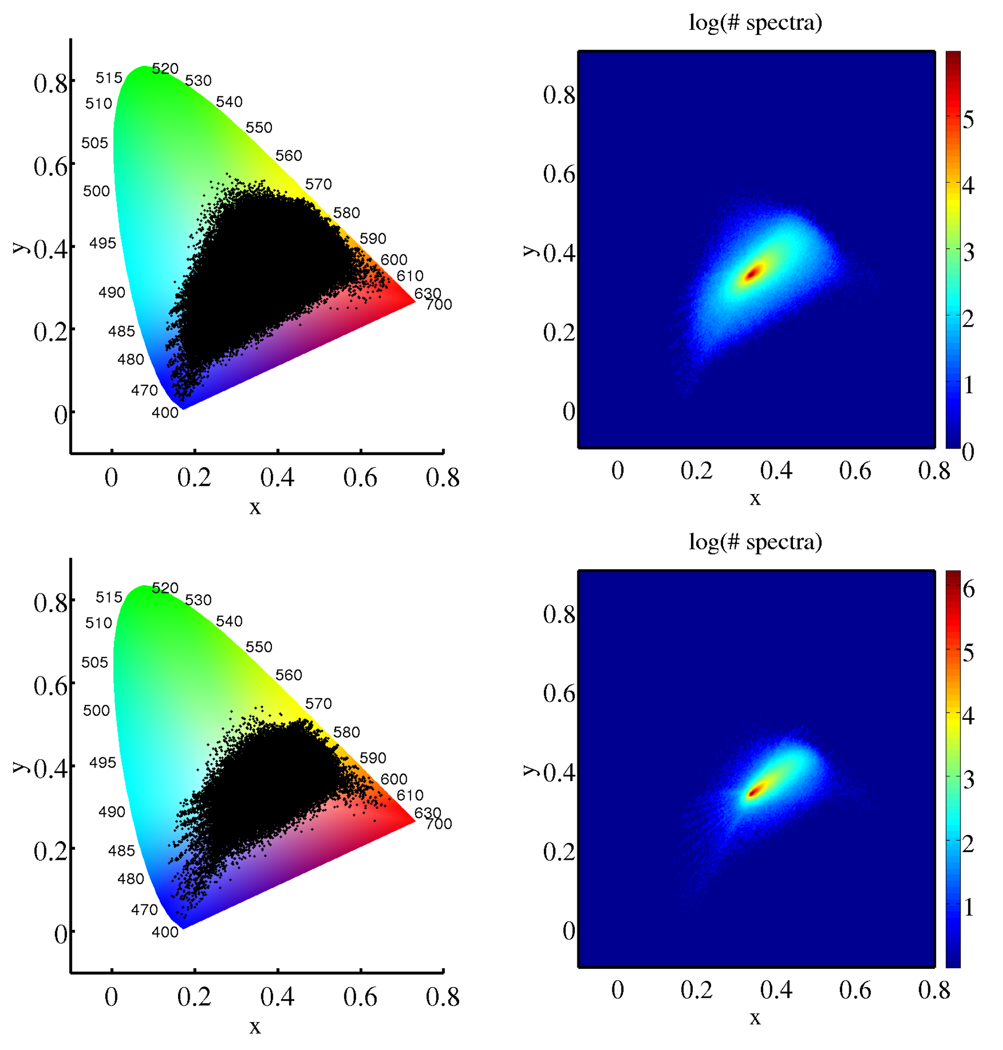
Fig. 3 shows two empirical metamer distributions derived according to the above procedure, one from a data set (15 million library spectra) of Wright-stained peripheral blood smears, and one from a set of hematoxylin/DAB-stained breast tissue microarrays (3 million library spectra). Both decay considerably faster from their maxima than the independent case, but extend closer to the spectral locus on the chromaticity diagram (with measurable probability).
Fig. 3.
Chromaticity histograms of two empirical metamer distributions: N = 107 spectra embedded from a library of 15 million spectra from peripheral blood smears (top), N = 107 spectra embedded from a library of 3 million spectra from breast tissue microarrays (bottom).
4. DISCUSSION
Under the independent spectra assumption used in Sec. 2, it is clear the most highly metameric colors are the colors farthest from the spectral locus on the CIE (x, y) chromaticity diagram and having luminosity centered at Y = 50. This is mathematically explained by the vanishing probability of drawing λ independent values, with just one being appreciably nonzero. Intuitively, it means that chromaticities comprised of many spectral wavelengths (such as white) have more permutations with the same “sum” in human perception.
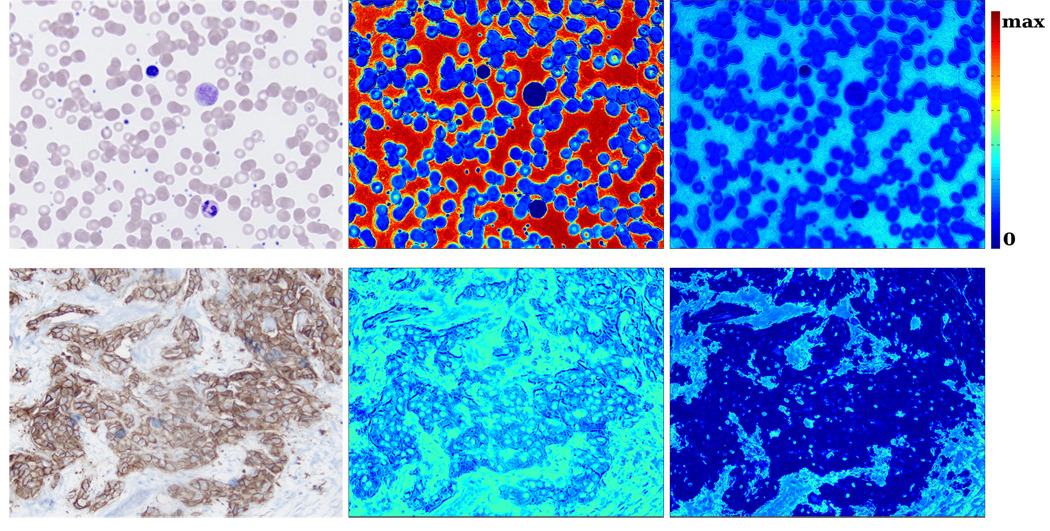
Fig. 4 shows an important application of metamerism for histopathological imaging. Given an a standard color image and choosing a distribution on P(ρ1 … ρλ), we determine a priori which parts of the image have a high probability of being metameric. If a color has a higher probability of being metameric, it is more likely that MSI will improve the task of distinguishing two structures which have similar color, but different absorption spectra. To give a specific examples, consider the leukocytes and lymphocytes (large, darker cells) in Fig. 4. Since a small portion of the allowable spectra maps to these chromaticities, it is less likely a multispectral image will be more informative than a standard image. In the breast tissue, it can be seen that the lighter hematoxylin stain on the stroma is more likely metameric than the darker, DAB-stained epithelial cells.
Fig. 4.
Left column: RGB image. Middle column: heatmap of the metameric probability assuming independence. Right column: heatmap generated from the empirical method described in Sec. 3. The empirical values are plotted on a log scale for visualization purposes. The maximum value corresponds to the peak of the probability density function.
Specification of the probability P is the most difficult barrier to the quantitative application of these methods; for real MSI applications with narrow bandwidth imaging capabilities, the approximation that P(ρj+1 ∩ ρi) ≈ P(ρj+1)P(ρj) begins to break down. Additionally, the same tristimulus values may be highly metameric under P, but not under a different P′. There is therefore a trade-off between picking a generic model, such as the one used in Sec. 2, vs. an application/domain-specific model, which carries the risk of yielding probabilities that simply reflect the frequency of occurrence in the training library.
Both empirical and analytical approaches to metamerism are informative to the task of determining worthwhile applications for MSI in pathology. Particularly advantageous is the fact that, once an appropriate P is specified, the degree of metamerism may be estimated without the need to first image the specimen with a spectral camera. Future studies are planned to determine how well these a priori estimates work for specific pathologies.
Acknowledgments
This research was funded, in part, by grants from the NIH through contract 5R01EB003587-04 from the National Institute of Biomedical Imaging and Bioengineering and contract 5R01LM009239-02 from the National Library of Medicine. Additional funds were provided by IBM through a Shared University Research Award.
Footnotes
The CIE developed the L* u* v* coordinates to create a more perceptually uniform color space. Since this space is still nonuniform (a true perceptually uniform, 3-D Euclidean color space does not exist [7]), we choose to work with (x, y) and avoid quantitative measurements of distance/area on the chromaticity diagram.
This approximation typically holds under real imaging conditions. In this paper, images are taken from 420nm to 720nm with a 10nm step size, for a total of λ = 31 bands.
A plot of the CIE 1931 color matching coefficients readily confirms this result; there is considerable overlap in the cone sensitivities of the human eye, particularly between red and green.
It is similar, as opposed to identical, because of the artifact introduced from bounding the random walk, which is biased towards smaller steps.
REFERENCES
- 1.Roula MA, Bouridane A, Kurugollu F, Amira A. A quadratic classifier based on multispectral texture features for prostate cancer diagnosis. Proc Int Symp Sig Processing. 2003;vol. 2:37–40. [Google Scholar]
- 2.Boucheron L, Bi Z, Harvey N, Manjunath BS, Rimm D. Utility of multispectral imaging for nuclear classification of routine clinical histopathology imagery. BMC Cell Biology. 2007;vol. 8:S8. doi: 10.1186/1471-2121-8-S1-S8. [DOI] [PMC free article] [PubMed] [Google Scholar]
- 3.Cukierski WJ, Qi X, Foran DJ. Moving beyond color: The case for multispectral imaging in brightfield pathology. IEEE ISBI. 2009:1111–1114. doi: 10.1109/ISBI.2009.5193251. [DOI] [PMC free article] [PubMed] [Google Scholar]
- 4.Levenson RM, Hoyt CC. Spectral imaging and microscopy. American Laboratory. 2000 [Google Scholar]
- 5.Macville MV, Van der Laak JA, Speel EJ, Katzir N, Garini Y, Soenksen D, McNamara G, de Wilde PC, Hanselaar AG, Hopman AH., T Ried Spectral imaging of multi-color chromogenic dyes in pathological specimens. Anal Cell Pathol. 2001;vol. 22:133–142. doi: 10.1155/2001/740909. [DOI] [PMC free article] [PubMed] [Google Scholar]
- 6.Stiles W, Wyszecki GW. Counting metameric object colors. J. Opt. Soc. Am. 1962;vol. 52:313–328. doi: 10.1364/josa.58.000032. [DOI] [PubMed] [Google Scholar]
- 7.Urban P, Rosen MR, Berns RS, Schleicher D. Embedding noneuclidean color spaces into euclidean color spaces with minimal isometric disagreement. J. Opt. Soc. Am. A. 2007;vol. 24(no. 6):1516–1528. doi: 10.1364/josaa.24.001516. [DOI] [PubMed] [Google Scholar]
- 8.MacAdam DL. Visual sensitivities to color differences in daylight. J. Opt. Soc. Am. 1942;vol. 32:247–273. [Google Scholar]


