

Abstract
Molecular motors have inspired many avenues of research for nanotechnology but most molecular motors studied so far allow only unidirectional movement. The archaeal RNA-exosome is a reversible motor that can either polymerize or degrade an RNA strand, depending on the chemical environments. We developed a single molecule fluorescence assay to analyze the real time locomotion of this nanomachine on RNA. Despite the multimeric structure, the enzyme followed the Michaelis−Menten kinetics with the maximum speed of ∼3 nucleotides/s, showing that the three catalytic cylinders do not fire cooperatively. We also demonstrate rapid directional switching on demand by fluidic control. When the two reaction speeds are balanced on average, the enzyme shows a memory of the previous reaction it catalyzed and stochastically switches between primarily polymerizing and primarily degrading behaviors. The processive, reversible, and controllable locomotion propelled by this nanomachine has a promising potential in environmental sensing, diagnostic, and cargo delivery applications.
Keywords: Archaeal exosome, RNA degradation, RNA polymerization, nanolocomotion, nanomotor, single molecule FRET technique
Cells orchestrate myriads of different types of molecular motors, each assigned to perform its own biological role in such diverse processes as muscle contraction,1,2 intracellular transport,3,4 ATP synthesis,5,6 and nucleic metabolism.7,8 In order to harness the robust nanomachines Nature optimized through millions of years of evolution, the nanotechnology community is mimicking biological systems by constructing nanoscale machines to carry out specific tasks in a controlled manner.9,10 To achieve such a goal, however, it is necessary to develop controllable motions for nanomachines along specific paths with external remote control for steering and directionality. In addition, their intrinsic properties such as speed, processivity, cooperativity, and stochasticity need to be known.
Several systems have been demonstrated as proof-of-concept devices, including rotary machines,6,11,12 linear stepping motors,9,13−15 and even synthetic DNA16,17 and muscle-based walking devices.(18) However, the field is still in its infancy, and researchers are continuously seeking more biological machines for other types of applications. In particular, reversible locomotion is important for developing transport and surveillance systems that can detect and respond to chemical and biological changes in local environments. However, there exist in nature few machines capable of moving back and forth reversibly and in a manner controllable by chemical stimuli. Here we characterize and visualize the motion of a motor system called the RNA exosome. Exosomes and the distantly related degradosome complex are found in all phylogentic kingdoms and are central enzymes implicated in RNA decay, processing, and quality control.(19)
The archaeal exosome is a nine subunit complex of a double-donut-like structure with a central chamber that degrades RNA (Figure 1). The top trimeric ring (blue) possesses several RNA binding domains and is thought to help recruit RNA substrates and channel them through the pore into the processing chamber within the bottom ring. The bottom ring (red) consists of six subunits, a trimer of Rrp41:Rrp42 dimers, and contains three active sites for the 3′ → 5′ exoribonuclease activity.(20) The top ring (cap) thus acts as a molecular track holder whereas the bottom ring (core) serves as a catalytic motor. Two types of cap proteins (Csl4 and Rrp4) exist in archaea, presumably to impart specificity for different RNA tracks.(20) In the presence of free inorganic phosphate (Pi), the exosome phosphorolytically degrades RNA in the 3′ to 5′ direction, whereas in the presence of ADP (or other NDPs), it polymerizes the RNA by adding AMPs (or other NMPs) to the 3′ end. These two activities are catalyzed by the same active sites and are reversible.(20) It is unknown how the three active sites are utilized and whether they act cooperatively. No information is yet available on the rates of processive RNA degradation and polymerization or on how these two activities are coordinated and controlled in a physiological condition that has both ADP and Pi.
Figure 1.

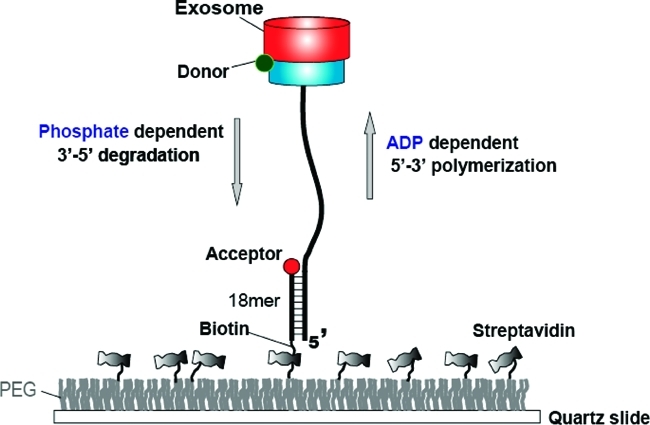
Archaeal Csl4-exosome and experimental setup. (a) Top-to-bottom view of the crystal structure of the Archaseoglobus fulgidus Csl4-exosome complex (PDB code 2BA1). The protein is composed of nine subunits in which the top three units constitute the RNA binding cap ring (blue) while the bottom six form the catalytic core (red). The double-donut-like structure displays a central channel through which ssRNA enters and is further processed. (b) Side view of the crystal structure. The protein is labeled with a Cy3 fluorophore (green) at the interface between the two rings. (c) An RNA substrate annealed to a DNA strand to form a partial duplex is immobilized to a PEG coated surface via the biotin−streptavidin interaction. The protein complex functions in RNA degradation and polymerization in response to Pi and ADP, respectively. The enzymatic motion can be monitored by the single molecule FRET assay in real time. FRET increases during degradation whereas it decreases during polymerization, serving as a sensitive reporter of the reactions.
To monitor both activities in real time via single molecule fluorescence resonance energy transfer (FRET),21,22 the Csl4 exosome complex was site-specifically labeled with a donor (Cy3) at the interface between the two rings with about one donor per complex (Figure 1b). The labeling did not significantly alter its activity (Figure. S1 in Supporting Information). The substrate consists of a single-stranded (ss) DNA annealed to a longer single-stranded RNA (ssRNA) with a polyA 3′ overhang and is labeled with an acceptor (Cy5) at the partial duplex junction (Figure 1c). The hybrid construct is tethered to a polymer-coated surface via the biotinylated duplex end (Figure 1c).
First, we observed the polymerization reaction (Figure 2a). Upon addition of ADP to the exosome preincubated with the surface-immobilized RNA, we observed a gradual FRET decrease caused by the increase in the time-averaged distance between the two fluorophores (Figure 2b). Such FRET decrease was not observed without ADP and is attributed to the extension of the RNA at the 3′ end and the associated movement of the exosome away from the junction. The exosome can be viewed as a nanoscale machine that builds its own molecular track to move along. The monotonically decreasing FRET shows that the polymerization activity of the exosome is indeed processive. If the enzyme were nonprocessive and dissociated quickly, we would have observed such a dissociation event as abrupt disappearance of fluorescence signal before FRET decrease is complete. Pauses have been widely observed in other processive nucleic acids motors such as RNA polymerases23,24 and helicases,25,26 but we did not see any evidence of pauses in the single molecule trajectories of the exosome.
Figure 2.

Processive polymerization. (a) In the presence of ADP the exosome moves away from the junction via polymerization, decreasing FRET. (b) A representative trace shows how the polymerization time is measured. A time interval was determined between when FRET starts to decrease and when it saturates to the lowest value. (c) Representative traces show that polymerization reaction slows down at lower ADP concentrations. (d) The velocity of polymerization vs ADP concentration and a Michaelis−Menten fit. Error bars denote standard error of mean.
Figure 2b illustrates how we determine the rate of polymerization. First, the reaction time was calculated as the time period during which FRET decrease was observed and its average, τ, determined from more than 100 molecules (Figure S2 in Supporting Information). The difference in τ between two constructs with 30 and 15 nucleotide (nt) of 3′ ssRNA-overhang is attributed to the time taken for 15 nt synthesis (Figure S3 in Supporting Information). The polymerization rate then is 15 nt divided by τ difference. Representative single molecule time traces showed the slowdown of the reaction as ADP concentration was lowered (Figure 2c). The polymerization rate vs ADP concentration curve could be well fitted by the Michaelis−Menten kinetics with a maximum velocity of 3 nt/s and a Km value of 1.3 mM (Figure 2d).
The exosome complex has three catalytically active sites, analogous to an automobile with three cylinders. One question we wanted to address is how the three cylinders are coordinated, for example, if they fire independently or collectively. The Michaelis−Menten curve, not a sigmoidal curve expected for a cooperative system, suggests there is no cooperative behavior among the three active sites during polymerization (Figure 2d).
Next, we investigated the activity of phosphorolytic degradation. Because it is difficult to chemically synthesize a long poly(rA) strand (>30 nt), we instead made a long RNA substrate enzymatically by prepolymerizing the substrate with 3′−15 nt ssRNA tail in situ using the exosome and ADP. For the long substrates produced this way, we can detect FRET change only when the exosome enters within ∼8 nm from the acceptor at the junction. Once FRET starts to increase, we expect that FRET will increase monotonically until the distance becomes about 3 nm (Figure S4 in Supporting Information).
In the presence of Pi, we observed a monotonically increasing FRET as the exosome digested the ssRNA strand in the 3′−5′ direction, showing that the degradation reaction is also highly processive without detectable pauses (Figure 3a,b). We determined the degradation time by measuring the time period over which FRET increased (Figure 3b). Single molecule time traces showed that the FRET increase occurs more slowly at lower Pi concentrations, consistent with exonuclease activity (Figure 3c and Figure S5 in Supporting Information). Because we do not know the exact length of the RNA being degraded during the reaction time, we could not determine the absolute speed of degradation from these measurements alone. Instead, we plotted the inverse of the degradation time vs Pi concentration, and an excellent fit to the Michaelis−Menten curve yielded the Km value of ∼450 μM (Figure S6 in Supporting Information). The result also shows the lack of cooperativity among the three active sites during degradation.
Figure 3.

Processive degradation. (a) In the presence of Pi the exosome approaches the junction via degradation, resulting in an increasing FRET. (b) A representative trace shows how the degradation time is determined. A time interval was measured between when FRET starts to increase and when it saturates to the highest value. (c) Representative traces for various Pi concentrations. (d) The Michaelis−Menten curve for the degradation was calibrated using the relative velocity at 10 mM ADP and 10 mM Pi. The Pi concentration of half-maximum velocity (Km) and the maximum velocity (Vmax) were 450 μM and 2.8 nt/s, respectively.
To determine the absolute rate of degradation, we performed a sequential reaction assay where the polymerization was first started and then degradation was triggered subsequently on the same RNA−exosome complex by flushing out 10 mM ADP with a Pi solution at 10 mM (Figure 4a) or 1 mM (Figure 4b). Both experiments showed a period of FRET increase followed by a period of FRET decrease, demonstrating that we can control the direction of the exosome movement by switching between ADP and Pi.
Figure 4.

Switching between degradation and polymerization reactions on demand. (a and b) Buffer exchange via flow was used to reverse the directionality: 10 mM ADP followed by 10 mM Pi (a); 10 mM ADP followed by 1 mM Pi (b). Linear fits to the two reaction segments are also shown. (c) Histogram of the ratio between speeds of degradation at 10 mM Pi and polymerization at 10 mM ADP and a Gaussian fit. (d) Histogram of the ratio between speeds of degradation at 1 mM Pi and polymerization at 10 mM ADP and a Gaussian fit.
Comparison of the apparent slopes between polymerization and degradation of each single complex showed that polymerization at 10 mM ADP is ∼5% faster than degradation at 10 mM Pi (Figure 4c) whereas it is ∼24% faster than degradation at 1 mM Pi (Figure 4d). Using the polymerization rate at 10 mM ADP (Figure 2c, top left corner), we calculate that the maximum rate of degradation at the saturating 10 mM Pi is 2.8 nt/s, and could recast the Michaelis−Menten kinetics now with the absolute rate of degradation (Figure 3d). Moreover, we did not observe any significant delay between the two reactions (Figure 4a and Figure 4b), indicating that the switching between two reactions is rapid. We estimate by how much FRET values change per 1 nt movement from the absolute calibrations and found that 1 nt gives rise to 0.011 change in FRET unit on average.
Superposition of two Michaelis−Menten curves showed a crossing point (∼6.5 mM of ADP or Pi) where the polymerization and degradation speeds are the same (Figure 5a). What would happen if the nominal degradation and polymerization rates are kept equal by having both 6.5 mM ADP and 6.5 mM Pi in solution? In the tug-of-war between degradation and polymerization, will either of the two reactions win over the other? Or will they reach a pseudoequilibrium where the two reactions are balanced out? We initially hypothesized the exosome might add 1 nt and remove 1 nt with an equal probability. However, we observed a series of periods when one of the two reactions is dominant as shown by stretches of FRET increases and decreases (Figure 5b). The apparent slopes of degradation and polymerization were 0.016 FRET unit/s and 0.014 FRET unit/s, respectively (Figure 5c,d). These slopes were different only by a factor 1.6 from those obtained at 6.5 mM ADP alone or 6.5 mM Pi alone (Figure S7 in Supporting Information). The data therefore suggest that the enzyme may have preference for one reaction over the other for some periods and this preference may switch back and forth as a function of time, a mode of action often referred to as the memory effect.27−29
Figure 5.

Stochastic reversals in directionality under a balanced condition. (a) Superposition of both Michaelis−Menten curves (polymerization in blue and degradation in red) yielded a crossing point, where their velocities should match. (b) A representative FRET−time trace at 6.5 mM ADP and 6.5 mM Pi shows stochastic switching behavior between two reactions. Linear fits to the different segments are shown. (c, d) Histograms of the apparent speed of degradation (c) and polymerization (d) determined from segmental fits.
Because random walk alone can generate a stretch of reaction during which one reaction dominates over the other, we attempted to make a quantitative comparison by carrying out simulations of the purely random walk case using two parameters obtained from experiments (∼0.011 FRET unit/nt and ∼2.6 nt/s at 6.5 mM ADP or Pi). The random walk simulation yielded a histogram of slopes that is quite different from the experimental result (Figure 6a,b), further supporting the presence of memory effect.
Figure 6.

Simulation of exosome activity. (a, b) Simulation results for the random walk model. A representative FRET time trace (a) and histograms of slope (FRET vs time) for polymerization (b, top) and for degradation (b, bottom). (c, d) Simulation results for the memory effect model. A representative FRET time trace (c) and histograms of slope (FRET vs time) for polymerization (d, top) and for degradation (d, bottom).
Next, we modeled the memory effect by assuming that the reaction rates depend on whether polymerization or degradation occurred in the previous round. To be specific, we set the rate of the reaction that happened in the previous round, kI, at 2.6 nt/s and the rate of the reaction that did not happen in the previous round, kII, at 1.3 nt/s. An example FRET−time trace and histograms of the slopes based on this simulation of memory effect are remarkably similar to the experimental data (Figure 6c,d), suggesting that indeed the exosome remembers which of the two competing reactions occurred and tends to repeat the same reaction. The mechanistic basis for the memory effect remains to be revealed but could for instance arise from two molecular conformations of the exosome and may offer the possibility for cellular regulation of the two opposing exosome activities.
Future applications using the exosome complex as a reversible and controllable motor require fundamental understanding of the intrinsic activities of the enzyme complex, and our studies represent the first kinetic analysis of processive activities of any exosome complex. We found that both degradation and polyadenylation activities are highly processive, and three catalytic sites do not act cooperatively. The enzyme can switch directions rapidly and remembers and prefers to repeat the previous reaction catalyzed. The autonomous reversible motion may be applicable to environmental patrol systems. Protein motor-based devices have limitations with regard to harsh environmental conditions and their lifetimes, but the archaeal exosome is stable even at 60−80 °C(20) and may even be used as a smart dust autonomous device in high temperature and harsh environments.
Finally, our study is the first example of single molecule assay that not only accurately measures the rates of ssRNA degradation and polymerization in real time but also demonstrates a reversible engine. The only example of controllable and reversible motor protein before our work was the DNA polymerase which could be switched to the exonuclease mode by increasing the tension on the DNA template.(30) Our method can be directly applied to studies of other exonucleases that digest ssRNA and ssDNA.
Acknowledgments
This work was funded by grants from NIH (GM065367) and NSF (0822613) to T.H., grants from the DFG (German Research Council) to K.-P.H. (SFB 646 and HO2489-3), and the Human Frontier Science Program to K.-P.H. and T.H. G.L. is a postdoctoral fellow supported by the Jane Coffin Childs Medical Institute. T.H. is an investigator with Howard Hughes Medical Institute. K.-P.H. is supported by the German Excellence Initiative (CIPSM excellence cluster).
Supporting Information Available
RNA sequence (used for single molecule FRET experiments), oligonucleotide sequences (used to make the Rrp41 mutant for the protein labeling), and supporing Figures (Figure S1−S7). This material is available free of charge via the Internet at http://pubs.acs.org.
Funding Statement
National Institutes of Health, United States
Supplementary Material
References
- Huxley A. F. Prog. Biophys. Mol. Biol. 1957, 7, 255. [PubMed] [Google Scholar]
- Rayment I.; Holden H. M.; Whittaker M.; Yohn C. B.; Lorenz M.; Holmes K. C.; Milligan R. A. Science 1993, 261 (5117), 58–65. [DOI] [PubMed] [Google Scholar]
- Vale R. D. Cell 2003, 112 (4), 467–480. [DOI] [PubMed] [Google Scholar]
- Vallee R. B.; Sheetz M. P. Science 1996, 271 (5255), 1539–1544. [DOI] [PubMed] [Google Scholar]
- Boyer P. D. Annu. Rev. Biochem. 1997, 66, 717–749. [DOI] [PubMed] [Google Scholar]
- Noji H.; Yasuda R.; Yoshida M.; Kinosita K. Nature 1997, 386 (6622), 299–302. [DOI] [PubMed] [Google Scholar]
- Erzberger J. P.; Berger J. M. Annu. Rev. Biophys. Biomol. Struct. 2006, 35, 93–114. [DOI] [PubMed] [Google Scholar]
- Pyle A. M. Annu. Rev. Biophys. 2008, 37, 317–336. [DOI] [PubMed] [Google Scholar]
- van den Heuvel M. G. L.; De Graaff M. P.; Dekker C. Science 2006, 312 (5775), 910–914. [DOI] [PubMed] [Google Scholar]
- Goel A.; Vogel V. Nat. Nanotechnol. 2008, 3 (8), 465–475. [DOI] [PubMed] [Google Scholar]
- Soong R. K.; Bachand G. D.; Neves H. P.; Olkhovets A. G.; Craighead H. G.; Montemagno C. D. Science 2000, 290 (5496), 1555–1558. [DOI] [PubMed] [Google Scholar]
- Zhang L.; Abbott J. J.; Dong L. X.; Peyer K. E.; Kratochvil B. E.; Zhang H. X.; Bergeles C.; Nelson B. J. Nano Lett. 2009, 9 (10), 3663–3667. [DOI] [PubMed] [Google Scholar]
- Tucker R.; Katira P.; Hess H. Nano Lett. 2008, 8 (1), 221–226. [DOI] [PubMed] [Google Scholar]
- Ionov L.; Stamm M.; Diez S. Nano Lett. 2006, 6 (9), 1982–1987. [DOI] [PubMed] [Google Scholar]
- Diez S.; Reuther C.; Dinu C.; Seidel R.; Mertig M.; Pompe W.; Howard J. Nano Lett. 2003, 3 (9), 1251–1254. [Google Scholar]
- Gu H.; Chao J.; Xiao S. J.; Seeman N. C. Nature 465 (7295), 202–5. [DOI] [PMC free article] [PubMed] [Google Scholar]
- Lund K.; Manzo A. J.; Dabby N.; Michelotti N.; Johnson-Buck A.; Nangreave J.; Taylor S.; Pei R.; Stojanovic M. N.; Walter N. G.; Winfree E.; Yan H. Nature 465 (7295), 206–10. [DOI] [PMC free article] [PubMed] [Google Scholar]
- Xi J. Z.; Schmidt J. J.; Montemagno C. D. Nat. Mater. 2005, 4 (2), 180–U67. [DOI] [PubMed] [Google Scholar]
- Houseley J.; LaCava J.; Tollervey D. Nat. Rev. Mol. Cell Biol. 2006, 7 (7), 529–539. [DOI] [PubMed] [Google Scholar]
- Buttner K.; Wenig K.; Hopfner K. P. Mol. Cell 2005, 20 (3), 461–471. [DOI] [PubMed] [Google Scholar]
- Stryer L.; Haugland R. P. Proc. Natl. Acad.Sci. U.S.A. 1967, 58 (2), 719. [DOI] [PMC free article] [PubMed] [Google Scholar]
- Ha T.; Enderle T.; Ogletree D. F.; Chemla D. S.; Selvin P. R.; Weiss S. Proc. Natl. Acad.Sci. U.S.A. 1996, 93 (13), 6264–6268. [DOI] [PMC free article] [PubMed] [Google Scholar]
- Abbondanzieri E. A.; Greenleaf W. J.; Shaevitz J. W.; Landick R.; Block S. M. Nature 2005, 438 (7067), 460–465. [DOI] [PMC free article] [PubMed] [Google Scholar]
- Galburt E. A.; Grill S. W.; Wiedmann A.; Lubkowska L.; Choy J.; Nogales E.; Kashlev M.; Bustamante C. Nature 2007, 446 (7137), 820–823. [DOI] [PubMed] [Google Scholar]
- Myong S.; Bruno M. M.; Pyle A. M.; Ha T. Science 2007, 317 (5837), 513–516. [DOI] [PMC free article] [PubMed] [Google Scholar]
- Ha T.; Rasnik I.; Cheng W.; Babcock H. P.; Gauss G. H.; Lohman T. M.; Chu S. Nature 2002, 419 (6907), 638–641. [DOI] [PubMed] [Google Scholar]
- English B. P.; Min W.; van Oijen A. M.; Lee K. T.; Luo G. B.; Sun H. Y.; Cherayil B. J.; Kou S. C.; Xie X. S. Nat. Chem. Biol. 2006, 2 (2), 87–94. [DOI] [PubMed] [Google Scholar]
- Lu H. P.; Xun L. Y.; Xie X. S. Science 1998, 282 (5395), 1877–1882. [DOI] [PubMed] [Google Scholar]
- van Oijen A. M.; Blainey P. C.; Crampton D. J.; Richardson C. C.; Ellenberger T.; Xie X. S. Science 2003, 301 (5637), 1235–1238. [DOI] [PubMed] [Google Scholar]
- Wuite G. J. L.; Smith S. B.; Young M.; Keller D.; Bustamante C. Nature 2000, 404 (6773), 103–106. [DOI] [PubMed] [Google Scholar]
- Rasnik I.; Myong S.; Cheng W.; Lohman T. M.; Ha T. J. Mol. Biol. 2004, 336 (2), 395–408. [DOI] [PubMed] [Google Scholar]
- Rasnik I.; McKinney S. A.; Ha T. Nat. Methods 2006, 3 (11), 891–893. [DOI] [PubMed] [Google Scholar]
- Roy R.; Hohng S.; Ha T. Nat. Methods 2008, 5 (6), 507–516. [DOI] [PMC free article] [PubMed] [Google Scholar]
Associated Data
This section collects any data citations, data availability statements, or supplementary materials included in this article.