Abstract
IGF-binding protein (IGFBP)-3 is a metabolic regulator that has been shown to inhibit insulin-stimulated glucose uptake in murine models. This finding contrasts with epidemiological evidence of decreased serum IGFBP-3 in patients with type 2 diabetes. The purpose of this study was to clarify the role of IGFBP-3 in metabolism. Four-week-old male IGFBP-3−/− and control mice were subjected to a high-fat diet (HFD) for 12 wk. IGFBP-3−/− mice were heavier before the initiation of HFD and at the end of the study period. Resting metabolic rate was significantly decreased in knockout mice; however, respiratory exchange ratio was not significantly different. Fasting blood glucose and insulin levels were significantly elevated in IGFBP-3−/− mice. However, IGFBP-3−/− mice had relatively normal glucose tolerance because the relative glucose excursion over time was not different between the groups. During hyperinsulinemic clamps, IGFBP-3−/− mice had increased basal hepatic glucose production, but after insulin stimulation, no differences in hepatic glucose production were observed. A second cohort of older IGFBP-3−/− mice on HFD displayed unexpected evidence of hepatic steatosis. In summary, glucose tolerance and clamp testing indicate that IGFBP-3−/− mice preserve insulin sensitivity despite evidence of increased basal glucose turnover and hepatic steatosis. We provide evidence that genetic deletion of IGFBP-3 modulates hepatic carbohydrate and lipid metabolism.
IGFBP-3-deficient mice fed a high fat diet preserve insulin sensitivity despite evidence of increased basal glucose turnover and hepatic steatosis.
As early as 1976, the IGF axis was recognized as an important regulator of whole-body metabolism because of its insulin-like activity (1). Today it is well known that IGF complexes with IGF-binding protein (IGFBP)-3, its primary binding protein and an acid-labile subunit (ALS) to amplify the half-life of IGF up to 12–15 h (2). IGFBP-3 binds to 70–90% of all circulating IGF and may potentiate (via half-life amplification) or attenuate its action through sequestration. Although IGFBP-3’s key role is to regulate IGF bioavailability, IGFBP-3 was used to inhibit insulin-stimulated glucose uptake in 3T3-L1 adipocytes independent of IGF-I and type 1 IGF receptor action in vitro, suggesting a portion of IGFBP-3’s metabolic role may be independent of IGF action (3). This independence is reminiscent of other IGF-independent cellular roles for IGFBP-3 (for review see Ref. 4).
Increased IGFBP-3 proteolysis has been implicated in patients with type 2 diabetes (5), and reduced IGF-I to IGFBP-3 ratio is associated with a 3-fold greater risk of metabolic syndrome (6), providing further evidence that IGFBP-3 may be a modulator in metabolic disease in vivo. Although initial reports suggested that IGFBP-3 overexpression in transgenic mice resulted in selective organomegaly and had little effect on metabolism (7,8), use of an alternate promoter to overexpress IGFBP-3 resulted in dramatic metabolic effects in mice (9): decreased peripheral glucose sensitivity, higher fasting glucose, and insulin levels, and heavier liver and epididymal fat masses compared with wild-type (WT) mice (10). Intracerebroventricular infusion of IGFBP-3 significantly blunted liver insulin action and attenuated peripheral glucose uptake during hyperinsulinemic clamp (11). Furthermore, chronic infusion of IGFBP-3 decreased peripheral glucose uptake compared with controls (12).
Although initial reports suggested that IGFBP-3−/− mice had no obvious phenotype at 6 wk of age (13), mice were fed normal chow and were nonstressed. A more recent study reported that IGFBP-3−/− mice fed standard mouse chow have a metabolic phenotype, exhibited by heavier body weights and longer body lengths (14). Clearly, IGFBP-3 has dramatic control over peripheral glucose sensitivity as demonstrated by three independent studies employing IGFBP-3 overexpression and infusion. Although data from these studies indicate that IGFBP-3 plays an important role in regulating insulin sensitivity and metabolism, the contribution of IGFBP-3 to glucose and lipid metabolism remains poorly understood.
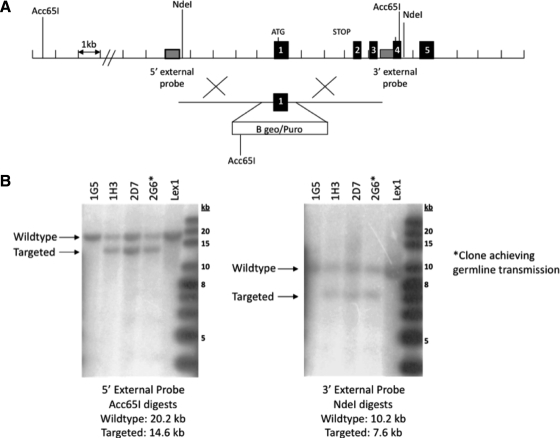
To clarify the role of IGFBP-3 in metabolism, we employed a murine model with total body genetic deletion of IGFBP-3 (see Fig. 1). Given that previous studies using genetic deletion of IGFBP-3 failed to show perturbations in peripheral glucose sensitivity, we fed our mice a high-fat diet (HFD) to accentuate metabolic differences between genotypes. Thus, the purpose of this study was to determine the effect of IGFBP-3 gene deletion and high-fat feeding on metabolism in IGFBP-3−/− and WT mice at different ages. Based upon previous research findings, we hypothesized that IGFBP-3−/− mice would have improved peripheral glucose control and enhanced hepatic insulin sensitivity compared with WT mice.
Figure 1.
Targeted disruption of the Igfbp3 gene locus. A, Targeting strategy used to disrupt the Igfbp3 locus. Homologous recombination (represented by ×) between the targeting vector and the Igfbp3 gene results in the replacement of the first coding exon with the selection cassette. The Acc65I and NdeI restriction enzyme cut sites used in the Southern blot analysis are indicated. B, Southern hybridization indicating proper gene targeting in the embryonic stem cell clones. Using a 5′ external probe on Acc65I-digested genomic DNA produces a 20.2-kb WT band and a 14.6-kb targeted band. Using a 3′ external probe on NdeI-digested genomic DNA produces a 10.2-kb WT band and a 7.6-kb targeted band. Clone 2G6 was selected for blastocyst injections. Lex1 represents untransfected embryonic stem cell DNA.
Materials and Methods
Generation of Igfbp3 knockout (KO) mice
The Igfbp3 targeting vector was derived using long-range PCR to generate the 5′ and 3′ arms of homology using 129/SvEvBrd ES cell (Lex-1) DNA as a template. The 3858-bp 5′ arm was generated using primers Ibp3-1 (5′-GGATCCTGCTCACCAGGCAACACGTATCTAAG-3′) and Ibp3-2 (5′-GGCCGCTATGGCCTATTAGGCATTTCCCAGCGAGAAC-3′) and cloned using the TOPO (Invitrogen, Carlsbad, CA) cloning kit. The 3792-bp 3′ arm was generated using primers Ipb3-5 (5′-GGCCAGCGAGGCCTAATTGGCAACGCAGGATTGTG-3′) and Igp3-6 (5′-CTCGAGCCTCGCACCCAACCTCGTCTGTAGTCTC-3′) and cloned. The 5′ arm was excised with BamHI/SfiI. The 3′ arm was exised with SfiI/XhoI. The arms were ligated to a SfiI-prepared selection cassette containing a β-galactosidase-neomycin fusion marker (B-Geo) along with a puromycin resistance marker and inserted into a BamHI/XhoI cut pKO Scrambler vector (Stratagene, La Jolla, CA) to complete the Igfbp3 targeting vector. The NotI linearized targeting vector was electroporated into 129/SvEvBrd (Lex-1) ES cells that were isolated and confirmed by Southern analysis using a 211-bp 5′ external probe (9/10), generated by PCR using primers Ibp3-9 (5′-GGTCAAAGACAAACCTGTTAAA-3′) and Ibp3-10 (5′-TGAGCAGGAAGTCAGAGC-3′) and a 201-bp 3′ external probe (11/12), amplified by PCR using primers Igp3-11 (5′-TTCTGCTGGTGTGTGGACAAGT-3′) and Igp3-12 (5′-TACCTGGCAGCCATAGTTG-3′). Southern analysis using probe 9/10 detected a 20.2-kb WT band and 14.6-kb mutant band in Acc65I-digested genomic DNA, whereas probe 11/12 detected a 10.2-kb WT band and 7.6-kb mutant band in NdeI-digested genomic DNA. Three clones were identified and microinjected into C57BL/6 blastocysts to generate chimeras that were bred to C57BL/6 females, and the resulting heterozygous offspring were interbred to produce homozygous Igfbp3-deficient mice. Genotyping was performed using quantitative PCR for the Neo cassette. This strategy enabled discrimination of zero, one, or two gene disruptions representing Igfbp3+/+, Igfbp3+/−, and Igfbp3−/− mice, respectively.
Animals
Animal experiments were approved by the Animal Research Committee of the University of California, Los Angeles. IGFBP-3−/− and WT mice were bred, and homozygous littermates were used in the study. Male and female pups were weaned, weighed, and genotyped at 3 wk of age and maintained on normal chow (4.5% fat, LabDiet 5001; Purina, St. Louis, MO) until placed into the study.
Data represent 4-wk-old, male IGFBP-3−/− and WT mice fed a HFD for 12 wk ad libitum (45% kcal from fat; TestDiet 58V8; Purina, Richmond, IN). To examine the effect of IGFBP-3 gene deletion at an older age, we also incorporated another cohort of mice, which were maintained on normal chow until 22 wk of age, and then mice were switched to a HFD for an additional 8 wk (see Fig. 7D). Additionally, IGF axis analytes were measured in this older cohort at the end of the HFD. All other experiments reflect the younger cohort and are as described in the figure legends. Mice were housed individually.
Figure 7.
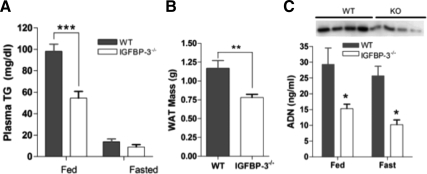
Adipose tissue, triglycerides, and adiponectin. A, In 16-wk-old IGFBP-3−/− male mice, plasma triglycerides (TG) were reduced in the fed state but not different in the fasted state (n = 5–7 per group); B, reduced WAT mass in the IGFBP-3−/− group in a fed state (n = 15–20 per group); C, IGFBP-3−/− mice have reduced adiponectin (ADN) levels as measured with ELISA in both fed and fasted states (n = 5 per group) and as measured with immunoblotting in fed plasma (inset). *, P < 0.05; **, P < 0.01; ***, P < 0.001. Means ± sem are presented.
Fasting (5 h) blood glucose was measured at 4 wk of age using a glucometer (FreeStyle, Abbott Park, IL). At the end of the HFD treatment, 16-wk-old mice were randomly assigned to undergo glucose tolerance testing (GTT), insulin tolerance testing (ITT), or euglycemic-hyperinsulinemic clamp after metabolic studies had been performed. Mice were euthanized in either a fed or fasted state, and plasma and tissues were collected. Epididymal fat pads [white adipose tissue (WAT)], liver, and skeletal muscle (quadriceps and tibialis anterior) were removed, weighed, and immediately frozen. To determine differences in liver mass from fed to fasted state, the mean liver mass of the fasted group within the same genotype was subtracted from each individual fed liver mass. An additional cohort was injected with 1 U Novolog/kg body weight, and livers and skeletal muscle were excised and frozen 30 min after injection.
Body composition
Body composition was performed in a rodent nuclear magnetic resonance scanner (Bruker Biospin, Billerica, MA) at the UCLA Mouse Metabolic Syndrome Phenotype Facility that was standardized to an internal control provided by the manufacturer. The mice were individually weighed on a scale and then placed in the scanner for measurement of body composition, analyzed as percent fat mass (also referred to as adiposity), percent muscle mass, and percent free fluid mass.
Metabolic assessment
To determine metabolic status of the mice, resting metabolic rate (RMR) and respiratory exchange ratio (RER) were obtained via indirect calorimetry. Mice were familiarized to a small Plexiglas flow chamber. Room air at 22 C was pulled through the chamber at a rate of 184 ml/min and the outflow O2 and CO2 concentrations sampled with precision gas analyzers (Vacumetrics, Oxnard, CA). When the mice were resting quietly (light cycle of the diurnal rhythm corresponding to the resting period when mouse metabolism is typically lowest), data were recorded for at least an hour and later analyzed with HEM version 4.0 software (Notocord Systems, Croissy sur Seine, France). The resting metabolic values were calculated from the change in gas concentrations compared with room air over time using previously established methods (15,16).
Hepatic oil red O staining
Livers of fasted 30-wk-old mice were excised, frozen, and cut (4 μm). Slides were fixed with O.C.T compound (Sakura Finetechnical, Tokyo, Japan) and stained with oil red O (n = 4 per genotype). Slides were visualized (×100), and pictures representing two mice per genotype are presented (Diagnostic Instruments, Sterling Heights, MI).
GTT and ITT
All tolerance tests were performed after a 5-h fast, and glucose/insulin was given as an ip injection. Blood glucose levels were measured in duplicate with a glucometer as described previously (17); means were used in the analyses.
For GTT, 16-wk-old mice were given 1.5 g d-glucose/kg body weight, and blood glucose levels were measured at 0, 15, 30, 60, 90, and 120 min after injection. At 0 and 30 min after glucose challenge, plasma insulin was measured (ALPCO Diagnostics, Salem, NH).
For ITT, mice were injected with 1 U insulin (Novolog; Novo Nordisk, Princeton, NJ)/kg of body weight. Blood glucose levels were measured at time 0 and at every 30-min interval after insulin injection, up to 4 h to match the length of Novolog action. Blood glucose levels are expressed relative to baseline by dividing levels after injection by baseline levels.
Euglycemic-hyperinsulinemic clamps
Mice were chronically cannulated in the jugular vein with a dual cannula under single-dose anesthesia (ketamine 80 mg/kg, xylazine 16 mg/kg, acepromazine 0.5 mg/kg). Cannulas were vessel secured at three sites and tunneled sc and exteriorized at the neck dorsum (18). Cannulas were flushed with heparinized saline, plugged, and encased in a sutured tube at the back of the neck. Each mouse was given saline sc to prevent dehydration and placed in an isothermic environment to maintain body temperature after the procedure. Mice were allowed to recover for 72 h. On the day of the clamp, mice were fasted for 6 h, and basal blood glucose was measured (HemoCue, Lake Forest, CA). To determine basal glucose turnover, 5 μCi/h of [3-3H]d-glucose (PerkinElmer, Waltham, MA) was infused at a constant rate into one of the jugular cannulas for 90 min. After tracer equilibration, a second basal blood sample was taken for the measurement of glucose concentration and tracer specific activity. The glucose turnover rate was measured by tracer dilution technique as previously described (19). Under basal conditions, endogenous glucose production is equivalent to glucose disposal given that no exogenous glucose is administered and circulating blood glucose levels are unchanged.
After determination of basal glucose turnover, regular human insulin (12 mU/kg · min, Novolin R; Novo Nordisk) in combination with [3-3H]d-glucose (5 μCi/h) was infused for 120 min. Simultaneously, the second cannula was connected to a syringe containing 50% dextrose solution (Abbott, Abbott Park, IL) infused at a variable rate to maintain the blood glucose concentration at euglycemia. Blood glucose was measured at 10-min intervals so as to maintain the integrity of the clamp, and steady state was achieved by 60 min after the initiation of the insulin infusion. Endogenous or HGP and rate of glucose disposal at steady state were calculated using Steele’s equation (19). Steady-state glucose kinetics were confirmed because no differences in specific activity were detected over the final 30 min of the clamp. In addition, steady-state blood glucose and human insulin levels between the genotypes during the clamp were statistically identical.
Biochemical analyses
Circulating IGFBP-3, IGF-I, and ALS were measured using an in-house-generated ELISA as previously described (20). IGFBP-1 and IGFBP-2 were measured by similar procedures using their respective specific antibodies. Antibodies and standards for IGFBP-1, -2, and -3, IGF-I, and ALS were obtained from R&D Systems (Minneapolis, MN). Murine serum GH and IGFBP-1 was measured in fasted mice (Linco, St. Charles, MO). Plasma samples were obtained from mice in the fed or fasted state, and triglyceride levels were measured according to the manufacturer’s instructions (Wako Diagnostics, Richmond, VA).
Western immunoblots
Insulin-stimulated tissue was homogenized in a lysis buffer [5 m NaCl, 1 m Tris-HCl (pH 7.5), 1 m MgCl2, 0.1 m EGTA, with protease/phosphatase inhibitors]. Total protein (75 μg) or 0.5 μl plasma was resolved on a 4–20% Tris-HCl gel (Bio-Rad, Hercules, CA). Proteins were transferred to polyvinyl difluoride membranes, blocked with I-block (SignaGen, Gaithersburg, MD), incubated with specific primary antibodies [IGFBP-3 (R&D Systems), adiponectin (Millipore, Billerica, MA), phosphoenolpyruvate carboxykinase (PEPCK) (Cayman, Ann Arbor, MI), fatty acid synthase (FAS) (Cell Signaling Technology, Danvers, MA), phospho-c-Jun N-terminal kinase (p-JNK) (Cell Signaling), and β-actin (Sigma Chemical Co., St. Louis, MO)] and washed three times with PBS with 0.5% Tween 20. Membranes were incubated with horseradish peroxidase-linked secondary antibodies and washed, and protein bands were visualized using enhanced chemiluminescence detection (Millipore).
Statistics
Independent t tests were used for analyses (Prism Graphpad, La Jolla, CA); statistical significance was set at an α-level of 0.05. The α-level was adjusted using Holm’s sequential Bonferroni adjustment in analyses involving more than two comparisons. Means ± sem are presented.
Results
Circulating IGF-related analytes
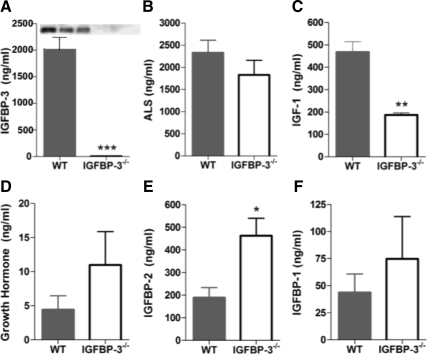
Igfbp3 gene targeting was achieved and transmission of the mutant allele was confirmed (Fig. 1, A and B). Circulating IGFBP-3 was not detected in IGFBP-3-null mice with immunoblotting or ELISA (Fig. 2A). ALS was not significantly different between groups. IGF-I was significantly reduced by about half in the IGFBP-3−/− mice, and although GH tended to be higher in the IGFBP-3−/− group, differences were not significant (Fig. 2, B–D). IGFBP-2 was significantly elevated in the IGFBP-3−/− mice with no detected differences in fasting IGFBP-1 (Fig. 2, E and F).
Figure 2.
Circulating IGFBP-3 and related analytes. The 30-wk-old male mice were analyzed after HFD. A, Serum IGFBP-3 was measured using an in-house ELISA and immunoblotting (inset); B, ALS was measured using ELISA; C, reduced IGF-I levels in IGFBP-3−/− mice was expected response because IGFBP-3 dramatically extends the half-life of IGF-I; D, GH levels are not different; E, IGFBP-2 is significantly elevated in IGFBP-3−/− mice; F, IGFBP-1 was measured after a 5-h fast. *, P < 0.05; **, P < 0.01. Means ± sem are presented; n = 5–7 per group.
IGFBP-3−/− mice are heavier but consume less food
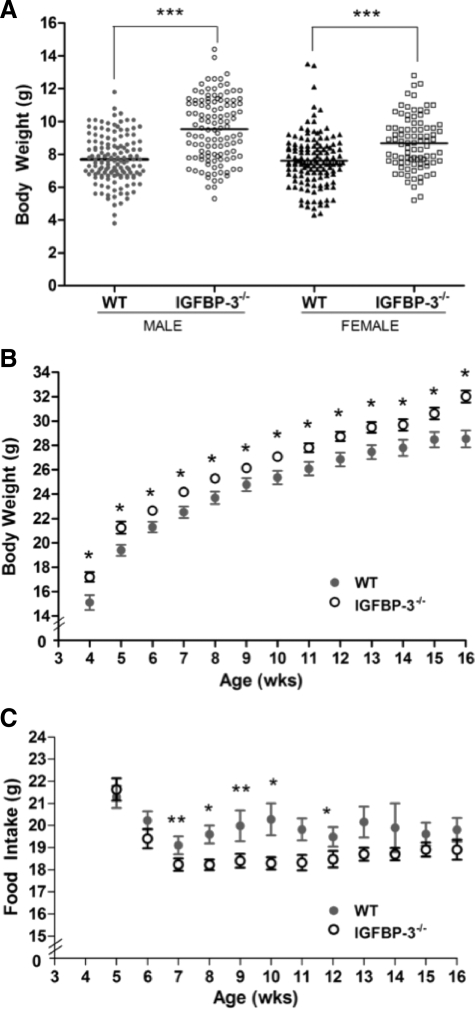
At weaning, male and female IGFBP-3−/− pups were significantly heavier than WT counterparts, indicating metabolic modulation occurs at a very young age under normal chow conditions before the initiation of high-fat feeding (Fig. 3A). Body weights continued to be elevated in male IGFBP-3−/− mice up to 16 wk old (Fig. 3B). No differences in body weight were detected from 22–30 wk of age, indicating convergence between 16 and 22 wk (data not shown). IGFBP-3−/− mice consumed significantly less food at 7–10 wk and at the 12th week of age but were still significantly heavier than WT mice during this time (Fig. 3C).
Figure 3.
Body weight and food intake. A, Male and female IGFBP-3−/− and WT mice were weighed at weaning (3 wk old) (n = 90–130 per group); B, male IGFBP-3−/− are heavier than male WT mice at all time points using Holm’s sequential Bonferroni adjustment (n = 30–40 per group; HFD was initiated at 4 wk of age); C, male IGFBP-3−/− mice consumed less food at wk 7 and 9 when the significance level was adjusted with Holm’s sequential Bonferroni method. Using unadjusted significance levels (P < 0.05), IGFBP-3−/− mice had significantly lower food consumption from wk 7–10 and wk 12; n = 30–40. *, P < 0.05; **, P < 0.01; ***, P < 0.001. Means ± sem are presented.
Young IGFBP-3−/− mice were heavier before the initiation of HFD (4 wk of age), during the study, and at the end of the study period (16 wk of age). We performed nuclear magnetic resonance analysis of the mice to assess body composition parameters at the end of the study (Table 1). There were no significant differences in total body fat, muscle, or free fluid expressed as a percentage of total body weight. Given clear differences demonstrated in WAT and muscle weight (see Figs. 5E and 7B), we hypothesize that differences may be depot specific and could contribute to the exhibited phenotype.
Table 1.
Body composition and indirect calorimetry
| Variable | WT (n = 6) | IGFBP-3 KO (n = 6) |
|---|---|---|
| Body weight (g) | 29.82 ± 1.99 | 30.52 ± 1.09 |
| % fat mass | 24 ± 2.79 | 23 ± 1.58 |
| % muscle mass | 72 ± 1.89 | 72 ± 0.85 |
| % free fluid | 1 ± 0.2 | 1 ± 0.16 |
| RMR (mg/kg · min) | 43.17 ± 0.51 | 30.02 ± 1.49a |
| RER | 0.72 ± 0.04 | 0.73 ± 0.03 |
The 16-wk-old male mice were analyzed after HFD. The RER was calculated as the ratio of carbon dioxide produced (VCO2) divided by oxygen consumed (VO2) and was not different between groups. RMR was significantly lower in KO mice at the end of HFD consistent with weight gain. Means ± sem are presented.
P < 0.00005.
Figure 5.
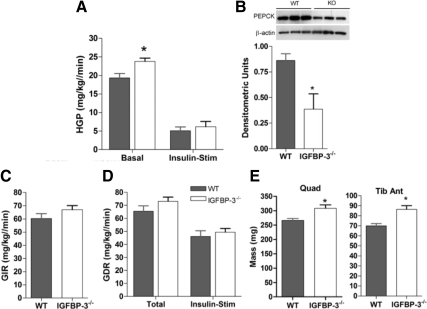
Hepatic insulin sensitivity. A, In 16-wk-old male mice after HFD, basal HGP is significantly elevated in IGFBP-3−/− mice, but no differences were observed during insulin stimulation (n = 7–8 per group); B, during insulin stimulation, PEPCK was suppressed in the KO compared with WT as detected with immunoblotting (inset) and densitometric analyses; C, glucose infusion rate was not significantly different (n = 7–8 per group); D, no differences in total and insulin-stimulated glucose disposal rate (n = 7–8 per group); E, 16-wk-old male IGFBP-3−/− mice have greater quadriceps (Quad) and tibialis anterior (Tib Ant) muscle mass in the fasted state (n = 8–11 per group). *, P < 0.05. Means ± sem are presented.
Metabolic alterations in IGFBP-3−/− mice
The observation that KO mice temporally decreased their food intake on the HFD but increased their body weight suggested that the metabolic rate of the KO mice was altered. To determine this, we assessed the metabolic rate of the mice upon conclusion of HFD at 16 wk of age using indirect calorimetry. We observed that although RER was not significantly different between the two genotypes, RMR was significantly decreased, consistent with the weight gain observed (Table 1).
IGFBP-3 gene deletion results in impaired fasting glucose homeostasis
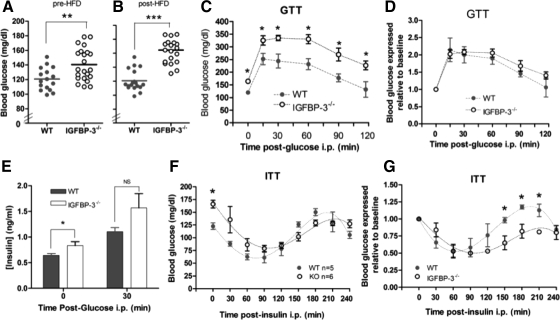
Before initiation of HFD at 4 wk of age, IGFBP-3−/− mice had 15% significantly higher blood glucose concentrations vs. WT mice (Fig. 4A), showing that IGFBP-3 gene deletion is an important regulator of glucose homeostasis at a young age even under normal chow-fed conditions. After 12 wk of a HFD, fasting blood glucose levels were further increased by 40% in IGFBP-3−/− mice, whereas blood glucose concentrations remained unchanged in WT mice (Fig. 4B).
Figure 4.
Basal glucose levels, GTT, and ITT. A, Fasting blood glucose was measured in male mice at 4 wk of age before HFD, after a 5-h fast; B, after 12 wk of HFD, fasting blood glucose levels doubled in IGFBP-3−/− mice; C, absolute blood glucose levels were significantly higher in IGFBP-3−/− mice; D, blood glucose was not different during the GTT when glucose levels were expressed relative to baseline levels (n = 10 per group); E, basal insulin concentrations were higher in IGFBP-3−/− mice, but no differences were observed 30 min after glucose injection (n = 10 per group); F, absolute blood glucose levels were not different during the ITT; G, blood glucose levels were reduced in IGFBP-3−/− mice at 150, 180, and 210 min after insulin injection when glucose levels were expressed relative to baseline during ITT, adjusted with Holm-Bonferroni adjustment (n = 5–6 per group). *, P < 0.05; **, P < 0.01; ***, P < 0.001. Means ± sem are presented.
During GTT, IGFBP-3−/− mice continued to have significantly higher blood glucose levels at every time point after challenge vs. controls, reflecting higher baseline glucose levels (Fig. 4C). When glucose levels were expressed relative to baseline levels, no significant differences were detected (Fig. 4D), suggesting IGFBP-3−/− mice had normal glucose disposal. Plasma insulin concentrations were significantly higher in IGFBP-3−/− mice at baseline, indicating that they required greater amounts of insulin to maintain normoglycemia at rest (Fig. 4E). At 30 min after glucose challenge, there were no differences in insulin concentrations when expressed as absolute values and relative to basal levels.
Similar to the GTT findings, IGFBP-3−/− mice had significantly higher blood glucose levels vs. WT mice before the ITT (Fig. 4F). After insulin challenge, there were no significant differences in absolute blood glucose concentrations between groups. Interestingly, when glucose levels were expressed relative to baseline levels, significant differences appeared at 150, 180, and 210 min after insulin challenge, with IGFBP-3−/− mice having an attenuated glucose recovery (counterregulatory recovery to normoglycemia) (Fig. 4G). Because mice were fasted 5 h before the ITT, glucose readings at the nadir of the ITT curve represent the effects of insulin stimulation in addition to 6.5 h of fasting. Thus, decreased HGP might be a plausible explanation for attenuated blood glucose levels in IGFBP-3−/− mice after insulin challenge. Alternatively, lower glucose concentrations could result from improved peripheral insulin sensitivity or blunted counterregulatory hormonal modulation.
IGFBP-3−/− mice maintain hepatic insulin sensitivity during hyperinsulinemic clamp
Basal HGP or basal glucose turnover rate was significantly elevated in IGFBP-3−/− mice (Fig. 5A). However, under high-dose insulin stimulation, HGP was reduced to the same extent as WT mice, suggesting normal hepatic insulin sensitivity in IGFBP-3−/− mice. The exact mechanism for this observation is not known. Remarkably, insulin-stimulated PEPCK was significantly down-regulated in IGFPB-3−/− mice compared with controls (Fig. 5B). This PEPCK down-regulation classically represents improved insulin sensitivity. Thus, IGFBP-3−/− mice have increased hepatic glucose turnover at rest, but sensitivity is preserved under hyperinsulinemic conditions.
Glucose infusion rate and glucose disposal rate of KO mice were not different from WT (Fig. 5, C and D). Quadriceps and tibialis anterior mass were also heavier in IGFBP-3-deficient mice under both fed and fasted states (Fig. 5, E and F), which may be a reflection of anabolic effects due to changes in peripheral insulin sensitivity or slightly elevated GH levels.
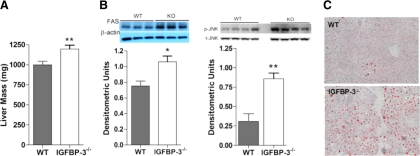
Liver mass of IGFBP-3−/− mice was approximately 20% larger vs. controls in the fasted state (Fig. 6A). In addition, insulin-stimulated FAS was approximately 30% higher in IGFPB-3-null mice (Fig. 6B). Furthermore, hepatic p-JNK was significantly higher in IGFBP-3−/− mice. JNK is integral in promoting steatosis (21). Indeed, visual examination revealed that IGFBP-3−/− mice had greater hepatic oil red O staining at 30 wk of age in a second older cohort, reflecting the possible histological progression of the earlier signaling abnormalities (Fig. 6C).
Figure 6.
Hepatic lipid metabolism. A, The 16-wk-old IGFBP-3−/− male mice have heavier liver mass in the fasted state (n = 15–20 per group); B, FAS was up-regulated in IGFBP-3−/− mice under insulin stimulation as shown with immunoblotting (inset) and densitometric analyses, and p-JNK was up-regulated in IGFBP-3−/− mice as shown with immunoblotting and densitometric analyses in the fed state; C, greater hepatic oil red O staining in 30-wk-old male IGFBP-3−/− mice after HFD. Magnification, ×100. *, P < 0.05; **, P < 0.01. Means ± sem are presented.
Decreased WAT mass, plasma triglycerides, and adiponectin in IGFBP-3−/− mice
Plasma triglyceride levels were reduced by 45% in HFD-fed IGFBP-3−/− mice compared with WT mice (Fig. 7A). In addition, IGFBP-3−/− mice had approximately 50% less WAT mass compared with WT mice (Fig. 7B). Plasma adiponectin, an insulin-sensitizing adipokine, was also reduced by 50% as measured with immunoblotting and ELISA (Fig. 7C), suggesting that the relative insulin sensitivity in IGFBP-3−/− mice is independent from adiponectin regulation. Additionally, hypoadiponectinemia is independently associated with nonalcoholic steatosis (22), alluding potential cross talk between liver and adipose tissue.
Discussion
Recent studies have demonstrated dramatic effects of IGFBPs as metabolic modulators in vivo. Mice with a genetic deletion of IGFBP-5 exhibit an increase in postnatal body weight and gained more weight on a HFD (23). However, these mice were noted to have increased adiposity, unlike what we observed for IGFBP-3. Additionally, IGFBP-2 was identified as a leptin-regulated gene, and adenoviral overexpression in mouse models of diabetes restored euglycemia (24). Indeed, our mice (consistent with previous reports) (14) demonstrated a significant increase in IGFBP-2, which may have contributed to relative insulin sensitivity despite hepatic steatosis. Although many previous studies have looked at the contribution of IGFBPs to cell growth and survival, taken together, these current studies have begun to define the specific role of IGFBPs in metabolism.
Epidemiological studies have identified IGFBP-3 as a modulator of metabolic disease in vivo, but its definitive role remains elusive. IGF-I is positively correlated with insulin sensitivity (25), and exogenous IGF-I also improves insulin sensitivity (26,27,28). Patients with an IGF-I to IGFBP-3 ratio in the lower quartile are two times more likely to be insulin resistant (6). Theoretically, a decline in IGF-I to IGFBP-3 ratio could be due to a decrease in IGF-I or an increase in IGFBP-3. Mechanistically, both explanations could be relevant because IGFBP-3 overabundance leads to insulin resistance (9,10,11,12). Initially, IGFBP-3 was used in combination therapy with IGF-I to amplify the half-life of IGF-I and maximize its hypoglycemic effects in treatment of insulin resistance in patients with type 2 diabetes (29). However, IGFBP-3 may have additional IGF-independent effects on metabolism because antibody blockade of the type 1 IGF receptor and use of IGFBP-3 mutants without IGF binding were still able to significantly inhibit insulin-stimulated glucose uptake in 3T3-L1 adipocytes (3).
The observed increased body weights in IGFBP-3-null mice fed HFD are consistent with previous data showing 8-wk-old IGFBP-3 transgenic mice were lighter than controls (10) and elevated weights in KO mice on normal chow from wk 6–8 (14). Our findings of increased muscle mass are in agreement with studies in IGFBP-3 KO mice derived in a different strain (14) as well as studies in human IGFBP-3-overexpressing transgenic mice in which muscle mass was diminished (10). Liver mass of IGFBP-3−/− mice was approximately 20% larger vs. controls in the fasted state (Fig. 6A). This is consistent with previous data that showed 30% larger liver mass in IGFBP-3−/− mice (14). In addition, IGFBP-3−/− mice had approximately 50% less WAT mass compared with WT mice (Fig. 7B), consistent with the finding of increased WAT in transgenic animals (10).
Dissociation between hepatic steatosis and insulin resistance has been demonstrated previously (18). Although hepatic steatosis is often found concomitant with obesity and insulin resistance, we find that the increased hepatic lipid deposits from IGFBP-3−/− mice are independent of these factors. IGFBP-3 levels are suppressed by 80% in liver-specific GH receptor KO (LGHRKO) mice that were reported to have hepatic steatosis (30), whereas steatosis was absent in liver-specific IGF-I KO mice with IGFBP-3 levels suppressed to 50% of normal. This raises the intriguing question of whether IGFBP-3 could be a potential regulator of hepatic steatosis by possibly mediating the antisteatosis action of GH in the liver.
A major finding of the present study is that IGFBP-3 gene deletion results in an adjustment in basal glucose homeostasis (due to elevated basal HGP, glucose, and insulin), but under insulin stimulation, IGFBP-3−/− mice retain normal hepatic insulin sensitivity (manifest by suppression of HGP). The disruption of basal glucose homeostasis associated with hepatic steatosis could be secondary to multiple tissue-specific effects of IGFBP-3. IGFBP-3 inhibits insulin action in vitro and in vivo (12) and inhibits insulin-stimulated glucose uptake in omental but not sc adipose tissue explants (3), and intracerebroventricular infusion of IGFBP-3 significantly impairs insulin action at the liver (11).
IGF-I binds weakly to isolated hepatocytes and intact liver, which may be in part due to the low level of hepatocyte IGF-I receptor expression (31,32). Confocal immunofluorescence microscopy shows surface association of IGFBP-3 on isolated primary hepatocytes (33). These observations also suggest that IGFBP-3’s modulation of hepatic metabolism may occur through IGF-independent mechanisms. A murine model with liver-specific IGF-I deficiency, with an additional reduction in circulating IGF-I, exhibited a doubling of epididymal fat mass (14,34) and plasma triglycerides (34,35) and was insulin resistant compared with WT, contrary to our observations in the IGFBP-3−/− mouse. Our global IGFBP-3 deletion model does not distinguish between effects of circulating IGFBP-3 and local IGFBP-3 on metabolism. These could be very different; i.e. circulating IGFBP-3 could regulate IGF bioavailability and local IGFBP-3 could have IGF-dependent and -independent effects. Clearly, tissue-specific KO models will be helpful to clarify systemic vs. local contributions of IGFBP-3 to metabolism.
Acknowledgments
IGFBP-3−/− mice were kindly provided by Drs. William Paradee, Kenneth Platt, and David Powell of Lexicon Pharmaceuticals, Inc. (The Woodlands, TX). We thank the Krogstad Lab for use of its microscope camera. Special thanks go to Maria C. Jordan for technical expertise in the metabolic studies. Additional thanks go to Pinchas Cohen for helpful discussion and insights.
Footnotes
Support for this project was received from the National Institutes of Health (DK73227 and 78760 to A.L.H. and 2P30DK063491 to D.H.). Additional support came from the Laubisch Endowment to K.P.R. P.M.Y. is a Gerald J. and Dorothy R. Friedman Foundation Fellowship recipient.
Disclosure Summary: The authors have nothing to disclose.
First Published Online October 6, 2010
Abbreviations: ALS, Acid-labile subunit; FAS, fatty acid synthase; GTT, glucose tolerance testing; HFD, high-fat diet; IGFBP, IGF-binding protein; ITT, insulin tolerance testing; KO, knockout; PEPCK, phosphoenolpyruvate carboxykinase; p-JNK, phospho-c-Jun N-terminal kinase; RER, respiratory exchange ratio; RMR, resting metabolic rate; WAT, white adipose tissue; WT, wild type.
References
- Froesch ER, Zapf J, Audhya TK, Ben-Porath E, Segen BJ, Gibson KD 1976 Nonsuppressible insulin-like activity and thyroid hormones: major pituitary-dependent sulfation factors for chick embryo cartilage. Proc Natl Acad Sci USA 73:2904–2908 [DOI] [PMC free article] [PubMed] [Google Scholar]
- Guler HP, Zapf J, Schmid C, Froesch ER 1989 Insulin-like growth factors I and II in healthy man. Estimations of half-lives and production rates. Acta Endocrinol (Copenh) 121:753–758 [DOI] [PubMed] [Google Scholar]
- Chan SS, Twigg SM, Firth SM, Baxter RC 2005 Insulin-like growth factor binding protein-3 leads to insulin resistance in adipocytes. J Clin Endocrinol Metab 90:6588–6595 [DOI] [PubMed] [Google Scholar]
- Yamada PM, Lee KW 2009 Perspectives in mammalian IGFBP-3 biology: local vs. systemic action. Am J Physiol Cell Physiol 296:C954–C976 [DOI] [PubMed] [Google Scholar]
- Bang P, Brismar K, Rosenfeld RG 1994 Increased proteolysis of insulin-like growth factor-binding protein-3 (IGFBP-3) in noninsulin-dependent diabetes mellitus serum, with elevation of a 29-kilodalton (kDa) glycosylated IGFBP-3 fragment contained in the approximately 130- to 150-kDa ternary complex. J Clin Endocrinol Metab 78:1119–1127 [DOI] [PubMed] [Google Scholar]
- Sierra-Johnson J, Romero-Corral A, Somers VK, Lopez-Jimenez F, Malarstig A, Brismar K, Hamsten A, Fisher RM, Hellenius ML 2009 IGF-I/IGFBP-3 ratio: a mechanistic insight into the metabolic syndrome. Clin Sci (Lond) 116:507–512 [DOI] [PubMed] [Google Scholar]
- Murphy LJ, Molnar P, Lu X, Huang H 1995 Expression of human insulin-like growth factor-binding protein-3 in transgenic mice. J Mol Endocrinol 15:293–303 [DOI] [PubMed] [Google Scholar]
- Murphy LJ, Rajkumar K, Molnar P 1995 Phenotypic manifestations of insulin-like growth factor binding protein-1 (IGFBP-1) and IGFBP-3 overexpression in transgenic mice. Prog Growth Factor Res 6:425–432 [DOI] [PubMed] [Google Scholar]
- Modric T, Silha JV, Shi Z, Gui Y, Suwanichkul A, Durham SK, Powell DR, Murphy LJ 2001 Phenotypic manifestations of insulin-like growth factor-binding protein-3 overexpression in transgenic mice. Endocrinology 142:1958–1967 [DOI] [PubMed] [Google Scholar]
- Silha JV, Gui Y, Murphy LJ 2002 Impaired glucose homeostasis in insulin-like growth factor-binding protein-3-transgenic mice. Am J Physiol Endocrinol Metab 283:E937–E945 [DOI] [PubMed] [Google Scholar]
- Muzumdar RH, Ma X, Fishman S, Yang X, Atzmon G, Vuguin P, Einstein FH, Hwang D, Cohen P, Barzilai N 2006 Central and opposing effects of IGF-I and IGF-binding protein-3 on systemic insulin action. Diabetes 55:2788–2796 [DOI] [PubMed] [Google Scholar]
- Kim HS, Ali O, Shim M, Lee KW, Vuguin P, Muzumdar R, Barzilai N, Cohen P 2007 Insulin-like growth factor binding protein-3 induces insulin resistance in adipocytes in vitro and in rats in vivo. Pediatr Res 61:159–164 [DOI] [PubMed] [Google Scholar]
- Ning Y, Schuller AG, Bradshaw S, Rotwein P, Ludwig T, Frystyk J, Pintar JE 2006 Diminished growth and enhanced glucose metabolism in triple knockout mice containing mutations of insulin-like growth factor binding protein-3, -4, and -5. Mol Endocrinol 20:2173–2186 [DOI] [PubMed] [Google Scholar]
- Yakar S, Rosen CJ, Bouxsein ML, Sun H, Mejia W, Kawashima Y, Wu Y, Emerton K, Williams V, Jepsen K, Schaffler MB, Majeska RJ, Gavrilova O, Gutierrez M, Hwang D, Pennisi P, Frystyk J, Boisclair Y, Pintar J, Jasper H, Domene H, Cohen P, Clemmons D, LeRoith D 2009 Serum complexes of insulin-like growth factor-1 modulate skeletal integrity and carbohydrate metabolism. FASEB J 23:709–719 [DOI] [PMC free article] [PubMed] [Google Scholar]
- Even PC, Mokhtarian A, Pele A 1994 Practical aspects of indirect calorimetry in laboratory animals. Neurosci Biobehav Rev 18:435–447 [DOI] [PubMed] [Google Scholar]
- Jensen DR, Gayles EC, Ammon S, Phillips R, Eckel RH 2001 A self-correcting indirect calorimeter system for the measurement of energy balance in small animals. J Appl Physiol 90:912–918 [DOI] [PubMed] [Google Scholar]
- Hoang PT, Park P, Cobb LJ, Paharkova-Vatchkova V, Hakimi M, Cohen P, Lee KW 2010 The neurosurvival factor Humanin inhibits beta-cell apoptosis via signal transducer and activator of transcription 3 activation and delays and ameliorates diabetes in nonobese diabetic mice. Metabolism 59:343–349 [DOI] [PMC free article] [PubMed] [Google Scholar]
- Monetti M, Levin MC, Watt MJ, Sajan MP, Marmor S, Hubbard BK, Stevens RD, Bain JR, Newgard CB, Farese Sr RV, Hevener AL, Farese Jr RV 2007 Dissociation of hepatic steatosis and insulin resistance in mice overexpressing DGAT in the liver. Cell Metab 6:69–78 [DOI] [PubMed] [Google Scholar]
- Steele R 1959 Influences of glucose loading and of injected insulin on hepatic glucose output. Ann NY Acad Sci 82:420–430 [DOI] [PubMed] [Google Scholar]
- Hwang DL, Lee PD, Cohen P 2008 Quantitative ontogeny of murine insulin-like growth factor (IGF)-I, IGF-binding protein-3 and the IGF-related acid-labile subunit. Growth Horm IGF Res 18:65–74 [DOI] [PMC free article] [PubMed] [Google Scholar]
- Singh R, Wang Y, Xiang Y, Tanaka KE, Gaarde WA, Czaja MJ 2009 Differential effects of JNK1 and JNK2 inhibition on murine steatohepatitis and insulin resistance. Hepatology 49:87–96 [DOI] [PMC free article] [PubMed] [Google Scholar]
- Hui JM, Hodge A, Farrell GC, Kench JG, Kriketos A, George J 2004 Beyond insulin resistance in NASH: TNF-α or adiponectin? Hepatology 40:46–54 [DOI] [PubMed] [Google Scholar]
- Gleason CE, Ning Y, Cominski TP, Gupta R, Kaestner KH, Pintar JE, Birnbaum MJ 2010 Role of insulin-like growth factor-binding protein 5 (IGFBP5) in organismal and pancreatic β-cell growth. Mol Endocrinol 24:178–192 [DOI] [PMC free article] [PubMed] [Google Scholar]
- Hedbacker K, Birsoy K, Wysocki RW, Asilmaz E, Ahima RS, Farooqi IS, Friedman JM 2010 Antidiabetic effects of IGFBP2, a leptin-regulated gene. Cell Metab 11:11–22 [DOI] [PubMed] [Google Scholar]
- Sesti G, Sciacqua A, Cardellini M, Marini MA, Maio R, Vatrano M, Succurro E, Lauro R, Federici M, Perticone F 2005 Plasma concentration of IGF-I is independently associated with insulin sensitivity in subjects with different degrees of glucose tolerance. Diabetes Care 28:120–125 [DOI] [PubMed] [Google Scholar]
- Pratipanawatr T, Pratipanawatr W, Rosen C, Berria R, Bajaj M, Cusi K, Mandarino L, Kashyap S, Belfort R, DeFronzo RA 2002 Effect of IGF-I on FFA and glucose metabolism in control and type 2 diabetic subjects. Am J Physiol Endocrinol Metab 282:E1360–E1368 [DOI] [PubMed] [Google Scholar]
- Schmid C, Bianda T, Zwimpfer C, Zapf J, Wiesli P 2005 Changes in insulin sensitivity induced by short-term growth hormone (GH) and insulin-like growth factor I (IGF-I) treatment in GH-deficient adults are not associated with changes in adiponectin levels. Growth Horm IGF Res 15:300–303 [DOI] [PubMed] [Google Scholar]
- Saukkonen T, Amin R, Williams RM, Fox C, Yuen KC, White MA, Umpleby AM, Acerini CL, Dunger DB 2004 Dose-dependent effects of recombinant human insulin-like growth factor (IGF)-I/IGF binding protein-3 complex on overnight growth hormone secretion and insulin sensitivity in type 1 diabetes. J Clin Endocrinol Metab 89:4634–4641 [DOI] [PubMed] [Google Scholar]
- Clemmons DR, Sleevi M, Allan G, Sommer A 2007 Effects of combined recombinant insulin-like growth factor (IGF)-I and IGF binding protein-3 in type 2 diabetic patients on glycemic control and distribution of IGF-I and IGF-II among serum binding protein complexes. J Clin Endocrinol Metab 92:2652–2658 [DOI] [PubMed] [Google Scholar]
- Fan Y, Menon RK, Cohen P, Hwang D, Clemens T, DiGirolamo DJ, Kopchick JJ, Le Roith D, Trucco M, Sperling MA 2009 Liver-specific deletion of the growth hormone receptor reveals essential role of growth hormone signaling in hepatic lipid metabolism. J Biol Chem 284:19937–19944 [DOI] [PMC free article] [PubMed] [Google Scholar]
- Caro JF, Poulos J, Ittoop O, Pories WJ, Flickinger EG, Sinha MK 1988 Insulin-like growth factor I binding in hepatocytes from human liver, human hepatoma, and normal, regenerating, and fetal rat liver. J Clin Invest 81:976–981 [DOI] [PMC free article] [PubMed] [Google Scholar]
- Santos A, Yusta B, Fernández-Moreno MD, Blázquez E 1994 Expression of insulin-like growth factor-I (IGF-I) receptor gene in rat brain and liver during development and in regenerating adult rat liver. Mol Cell Endocrinol 101:85–93 [DOI] [PubMed] [Google Scholar]
- Hallak H, Moehren G, Tang J, Kaou M, Addas M, Hoek JB, Rubin R 2002 Epidermal growth factor-induced activation of the insulin-like growth factor I receptor in rat hepatocytes. Hepatology 36:1509–1518 [DOI] [PubMed] [Google Scholar]
- Haluzik M, Yakar S, Gavrilova O, Setser J, Boisclair Y, LeRoith D 2003 Insulin resistance in the liver-specific IGF-1 gene-deleted mouse is abrogated by deletion of the acid-labile subunit of the IGF-binding protein-3 complex: relative roles of growth hormone and IGF-1 in insulin resistance. Diabetes 52:2483–2489 [DOI] [PubMed] [Google Scholar]
- Yakar S, Setser J, Zhao H, Stannard B, Haluzik M, Glatt V, Bouxsein ML, Kopchick JJ, LeRoith D 2004 Inhibition of growth hormone action improves insulin sensitivity in liver IGF-1-deficient mice. J Clin Invest 113:96–105 [DOI] [PMC free article] [PubMed] [Google Scholar]


