

Abstract
Rhodopsin is the light receptor that initiates phototransduction in rod photoreceptor cells. The structure and function of rhodopsin is tightly linked to molecular interactions that stabilize and determine the receptor's functional state. Single-molecule force spectroscopy (SMFS) was used to localize and quantify molecular interactions that structurally stabilize bovine and mouse rhodopsin from native disc membranes of rod photoreceptor cells. The mechanical unfolding of bovine and mouse rhodopsin revealed nine major unfolding intermediates, each intermediate defining a structurally stable segment in the receptor. These stable structural segments had similar localization and occurrence in both bovine and mouse samples. For each structural segment, parameters describing their unfolding energy barrier were determined by dynamic SMFS. No major differences were observed between bovine and mouse rhodopsin thereby implying that the structures of both rhodopsins are largely stabilized by similar molecular interactions.
Rhodopsin is a G protein-coupled receptor (GPCR)1 residing in rod outer segments (ROS) of photoreceptor cells, where it initiates phototransduction upon light-activation. Several crystal structures are now available for a handful of GPCRs (1-5). These structures highlight the conservation of the general architecture of GPCRs, which display seven transmembrane α-helices. Some of the mechanisms underlying receptor activation and function are likely conserved across members of this family of membrane proteins (4, 6, 7). Despite low amino acid sequence similarities, comparison of GPCR crystal structures reveals only relatively small deviations in the position of transmembrane α-helices (2, 5, 8). Yet those small differences are significant enough to facilitate the specific roles and functions of those receptors. The determinants and functional effects of these small differences must begin to be understood.
Inter- and intramolecular interactions contribute to the folding, structure and stability of proteins and they determine the protein's functional state. Single-molecule force spectroscopy (SMFS) is a unique tool that allows for the quantification and structural localization of molecular interactions established in membrane proteins (9, 10). Native structure-function relationships of membrane proteins can be determined by SMFS because membrane proteins are studied in their functionally relevant lipid bilayer at ambient temperatures in a buffer solution. SMFS has been applied to bovine rhodopsin to quantify the stabilization of the receptor by zinc (11) and to reveal a localized stabilization that affects transducin activation by naturally occurring palmitylation in the carboxyl terminal region of the receptor (12).
Single substitutions of amino acid residues have the potential to alter molecular interactions that lead to changes in the structure and function of GPCRs (13-18). This is especially true in rhodopsin where single amino acid residue differences can result in dramatic effects. A single amino acid residue change can cause destabilization, malfunction or misfolding of the receptor, which leads to dramatic physiological consequences. Over 100 different point mutations in rhodopsin can cause retinitis pigmentosa, a group of retinal degenerative diseases (18).
Receptor homologs provide a natural system to study amino acid residue substitutions. Rhodopsin from rod photoreceptor cells in bovine and mouse retina share 93% sequence similarity with 23 amino acid residue differences (Figures 2C and S1). Bovine rhodopsin has been extensively studied and there are numerous crystal structures available (19-32). The only other rhodopsin crystal structure solved is that of invertebrate squid rhodopsin (33, 34). Significant differences are observed between the structures of vertebrate bovine rhodopsin and invertebrate squid rhodopsin, including extended transmembrane helices 5 and 6 and an additional α-helix in the carboxyl terminal region. No crystal structure has been solved for mouse rhodopsin. Thus, it is unclear whether the differences in amino acid residues between bovine and mouse rhodopsin affect the structure, stability and function of the receptor. The purpose of this study was to determine whether the naturally occurring 23 amino acid residue differences in the sequences of bovine and mouse rhodopsin have a significant effect on the molecular interactions that stabilize each structure. SMFS was applied to quantify the molecular interactions of bovine and mouse rhodopsin embedded in native ROS disc membranes. Furthermore, insights about the kinetic stability and mechanical properties of rhodopsin structure were gained using dynamic SMFS (DFS).
Figure 2.
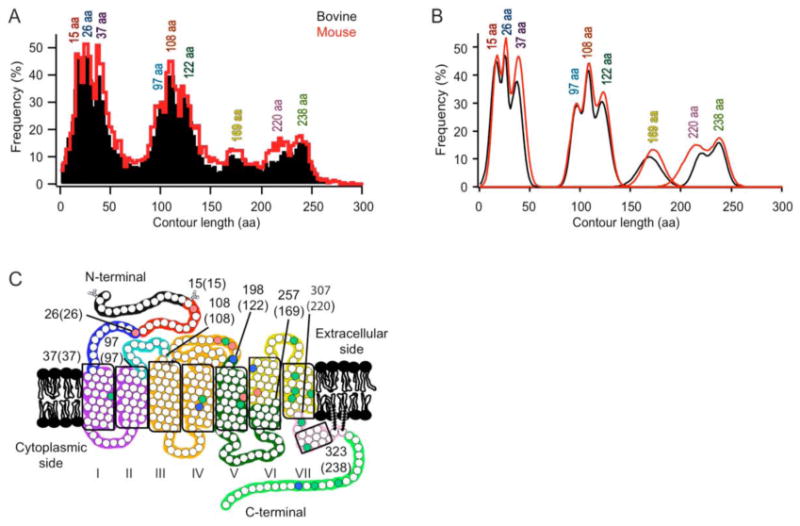
Classification of force peaks. (A) Frequency distribution of contour lengths determined from WLC model fitting of F-D curve peaks. The fitting of each peak of every F-D curve obtained at each speed is represented for bovine (black, n = 12,520) and mouse (red, n =9,830) rhodopsin. A bin size of 3 amino acid residues was used. (B) The histograms in (A) were analyzed by a Gaussian function to determine major peaks and their contour lengths. The most probable position and the standard deviation of each of the nine major peaks detected in the frequency distribution of contour lengths from either bovine (black) or mouse (red) data were estimated using a Gaussian function (Table S1). (C) The most probable contour lengths of each major peak were used to determine the corresponding structural segment in the receptor structure. Each structural segment is colored differently on the secondary structure of rhodopsin. The boundary amino acid residues for each segment are indicated with the corresponding contour length in brackets. The naming of each structural segment is given in Table 1. Conserved (green), semi-conserved (blue), and non-conserved (red) residues are indicated.
Materials and Methods
ROS disc membrane preparation
ROS were purified from either fresh bovine retina or from fresh mouse retina of C57BL/6 mice and disc membranes were prepared as described previously (12, 35). Fresh bovine eyes were obtained from a local slaughterhouse (Mahan Packing, Bristolville, OH) and mice were from Jackson Laboratories (Bar Harbor, ME). Mice were 3–4 weeks old and were dark-adapted overnight prior to being sacrificed. Disc membranes were either resuspended in buffer A (2 mM Tris-HCl, pH 7.4) for immediate use or were resuspended in buffer B (67 mM potassium phosphate, 1 mM magnesium acetate, 0.1 mM EDTA, 18% sucrose, pH 7.0) for storage at −80 °C. Membranes stored in buffer B at −80 °C were thawed and washed twice in buffer A prior to use. Unless otherwise stated, all disc preparation procedures were carried out under dim red light at 4 °C.
Purification of rhodopsin
Rhodopsin from dark-adapted mice was purified from whole eyes. Eyes from three mice were homogenized in 3 ml of buffer C (10 mM Bis-Tris propane, 150 mM NaCl, pH 7.5) using a hand-held homogenizer. The homogenate was centrifuged at 124,740 × g for 5 min. The pellet was resuspended in buffer D (10 mM Bis-Tris propane, 500 mM NaCl, 20 mM n-dodecyl-β-d-maltoside (Anatrace, Inc., Maumee, OH), pH 7.5) and shaken at room temperature for 15 min. The suspension was then centrifuged at 124,740 × g for 20 min. The supernatant was loaded on a 6 × 30 mm column packed with anti-1D4 antibody (36) coupled to CNBr-activated Sepharose 4B (Santa Cruz Biotechnology, Santa Cruz, CA) pre-equilibrated with buffer E (10 mM Bis-Tris propane, 500 mM NaCl, 2 mM n-dodecyl-β-d-maltoside, pH 7.5). The column was washed with 10 ml of buffer E. Purified rhodopsin was obtained by eluting the column with buffer E supplemented with 800 μM of 1D4 peptide (TETSQVAPA) synthesized by United Biochemical Research, Inc. (Seattle, WA).
Bovine rhodopsin was purified from frozen bovine retinas purchased from InVision BioResources (Seattle, WA). Tissue from approximately two retinas was used for purification. Bovine retinal tissue was homogenized in 3 ml of buffer C using a hand-held glass homogenizer and the subsequent steps of the purification procedure is identical to that carried out for the purification of mouse rhodopsin described above. The absorbance spectrum of purified rhodopsin was obtained using a Lambda 35 UV/Vis spectrophotometer (Perkin-Elmer, Waltham, MA). All purification steps were conducted under dim red light.
SMFS and DFS
SMFS and DFS were performed on disc membranes isolated from mouse and bovine samples essentially as described previously (12, 35, 37). Data were collected using two different atomic force microscopes (AFM): a Multimode AFM (Veeco Metrology, Santa Barbara, CA) and a NanoWizard Ultra AFM with an 850-nm laser detection system (JPK Instruments, Berlin, Germany). Disc membranes were adsorbed on freshly cleaved mica in buffer A. SMFS and DFS were conducted using NPS Si3N4 cantilevers (nominal spring constant 0.6-0.8 N/m, Veeco Metrology). Spring constants of cantilevers were determined in buffer solution using the thermal noise method (38, 39). DFS on bovine and mouse rhodopsin was performed at six different pulling velocities: 100, 300, 700, 1500, 3000, and 6000 nm/s. DFS at 1500, 3000, and 6000 nm/s was conducted only with the Nanowizard Ultra AFM, which was equipped with a 16-bit data acquisition card (NI PCI-6221, National Instruments, Munich, Germany) to allow higher sampling frequencies. SMFS and DFS experiments were performed in the dark under dim red light at room temperature (≈28°C) in SMFS assay buffer (150 mM KCl, 25 mM MgCl2, 20 mM Tris, pH 7.8).
Analysis of force-distance (F-D) curves
F-D curves were selected, aligned, analyzed and superimposed using Igor Pro 6 (WaveMetrics, Inc., Lake Oswego, OR) essentially as described previously (11, 35). F-D curves exhibiting a length corresponding to a fully stretched rhodopsin molecule with an intact Cys110-Cys187 disulfide bond (≈ 65 nm) were first selected (35). This selection criterion ensured that only F-D curves corresponding to rhodopsin unfolded from its amino-terminal region were analyzed. From this selection, F-D curves were aligned using their most dominant force peaks at 15, 26, 37, 97, 108, 122, 220 and 238 aa as reference. Every peak of a single F-D curve was fitted using the worm-like chain (WLC) model (40):
| (1) |
A persistence length, p, of 0.4 nm and a monomer length, x, of 0.36 nm was used (35, 37, 41). kB denotes the Boltzmann constant and T the temperature. The contour length, L, which gives the length of stretched polypeptide chain, was estimated from fitting Eq. 1 to each force peak of a F-D curve. From this contour length, the number of amino acid residues stretched was estimated approximating a length of 0.36 nm for each residue. Assignment of unfolding events to specific structural segments of rhodopsin was determined as described previously (35). All contour lengths revealed for either bovine or mouse rhodopsin were pooled and represented as a frequency distribution with a bin size of 3 amino acid residues.
DFS analysis
The most probable rupture force and the most probable loading rate at each pulling velocity was determined from the best fit of a single Gaussian function to the frequency distribution of either force or loading rate. Loading rates were calculated as the product of the pulling velocity and the slope of the F-D curve obtained from the best-fit of Eq. 1 to a given force peak (42). DFS data were fitted using the Bell-Evans model (43) as described previously (37). In this model, the most probable unfolding force, Fp, can be expressed as:
| (2) |
In this equation xu is the distance from the free-energy minimum to the transition-state barrier, ku the rate of unfolding in the absence of applied force, and rf the loading rate. Estimates for xu and ku were obtained from the fits of Eq. 2 to the DFS data. Estimation of the height of the transition state barrier, ΔGu‡, and rigidity, κ, for all unfolding barriers are calculated from xu and ku and the respective errors are propagated as described previously (37).
Extra sum of squares F-test
A Gaussian function was used to describe the histogram of contour lengths in Figure 2A and a function defined by Eq. 2 was used to describe the relationship between the most probable force and loading rate in the DFS plots of Figure 4. To test whether the fitted parameters of either function differed significantly between data from bovine and mouse samples, an extra sum of squares F-test was conducted using GraphPad Prism 5.0 (San Diego, CA) (44, 45); that is, the sum of squares obtained from the analysis where the parameters of either function were estimated separately from bovine and mouse data was compared to the sum of squares obtained from the analysis where both data sets shared single estimates of those parameters from either function. The level of significance was taken as P < 0.05. The parameters that were compared for the Gaussian function are the most probable contour length represented by the midpoint of the curve along the abscissa and that of the area under the curve. The parameters that were compared for the function defined by Eq. 2 are xu and ku.
Figure 4.

DFS plots for bovine and mouse rhodopsin. The most probable rupture force was plotted against the logarithm of the most probable loading rate for each of the structural segments in bovine (black) and mouse (red) rhodopsin. The lines represent individual fits of Eq. 2 to the data shown in each panel. The parametric values for xu and ku obtained from these fits are listed in Table 1. Error bars indicate the standard error of the most probable force and the most probable loading rate as determined by fitting to a single Gaussian distribution.
Results
Mechanical unfolding of bovine and mouse rhodopsin by SMFS
Native disc membranes from bovine and mouse ROS were isolated and adsorbed onto freshly cleaved atomically flat mica, which is largely chemically inert and hydrophilic (46). Previous studies have shown that the mica surface appears not to significantly influence the structure-function relationship of membrane proteins and outcome of SMFS results (47-50). Adsorbed disc membranes were located and imaged by atomic force microscopy (AFM). AFM of disc membranes predominantly displayed a raft-like organization of rhodopsin (e.g., (35, 51)), which is consistent with observations made by cryo-electron tomography of mouse ROS (52). Switching from AFM to SMFS mode, single rhodopsin molecules were mechanically unfolded from disc membranes to quantify the molecular interactions stabilizing their structural unfolding intermediates (Figure 1A).
Figure 1.
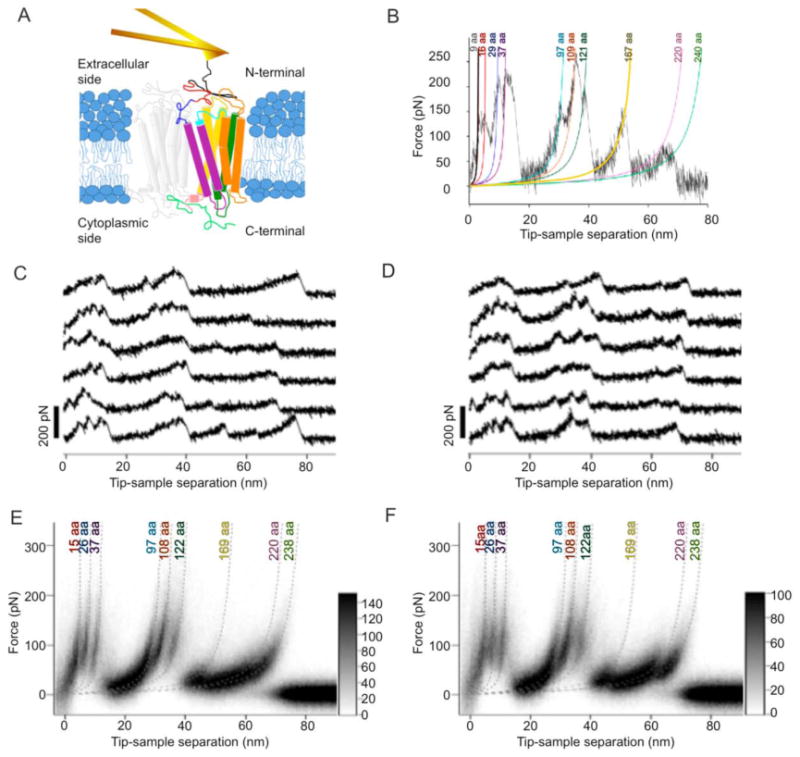
Mechanical unfolding of rhodopsin. (A) Schematic representation of the experimental setup that depicts the mechanical unfolding of rhodopsin from disc membranes of native ROS. The cantilever forms a bond at the amino terminal region of rhodopsin to mechanically unfold the receptor out of the membrane. (B) A single F-D curve with peaks fit by the WLC model. The WLC model fits are shown with the contour length indicated above each fit. (C, D) A selection of representative F-D curves from bovine (C) and mouse (D) samples are shown. (E, F) Superimpositions of all F-D curves collected at six pulling velocities are shown for bovine (E, n = 901) and mouse (F, n = 627) rhodopsin. The dotted lines represent WLC model fitted curves with contour lengths determined from Gaussian analysis of frequency histograms (Figure 2).
The preparation and adsorption of disc membranes onto mica resulted in membranes predominantly oriented with the amino-terminal region of rhodopsin exposed (35). The non-specific nature of attachment of the AFM stylus to rhodopsin can result in contact points anywhere along the polypeptide chain of the receptor that is exposed to the stylus. The selection criteria of F-D curves incorporated in the analysis procedures ensured that only those F-D curves reflecting attachment at the amino-terminal region of rhodopsin were analyzed (see Materials and Methods). The non-specific attachment of the AFM stylus at the amino terminal region of rhodopsin allowed the application of mechanical stress with force, thereby inducing the stepwise unfolding of rhodopsin.
F-D curves recorded while unfolding single rhodopsin molecules exhibited a detailed spectrum of force peaks (Figures 1B-1D). Each force peak represents the unfolding of a structural intermediate of the receptor and its magnitude reveals the amount of force required to overcome the molecular interactions stabilizing the unfolding intermediate. The appearance of a force peak appears to directly reflect molecular interactions that are intrinsic to membrane proteins (9). The magnitude of the force peaks reflect the interactions contributing to the stability of unfolding intermediates, which can have multiple origins including inter- and intramolecular interactions formed by individual rhodopsin molecules and those originating from external factors such as the lipid bilayer and components of the cytoplasm (9). External factors can also modify the intrinsic molecular interactions of membrane proteins, which manifest in F-D curves as the appearance of new force peaks or the disappearance of previously detected force peaks (e.g., (53)).
The rupture events that occurred during mechanical unfolding of bovine (Figures 1C) and mouse (Figures 1D) rhodopsin were recorded in many F-D curves. While F-D curves exhibited similarities with each other, individual F-D curves could show additional or missing unfolding events. Dissimilar sequences of force peaks observed in F-D curves represent unfolding events that shape unique unfolding pathways of a membrane protein (9, 41). Thus, SMFS allows for the detection of unique unfolding pathways by sampling the mechanical unfolding of single rhodopsins many times. Fitting each of the force peaks to the worm-like chain (WLC) model (see Materials and Methods) revealed the contour lengths of the unfolded and stretched polypeptide chains (Figure 1B).
DFS of bovine and mouse rhodopsin
The forces required to break molecular interactions in SMFS are dependent on the loading rate at which those interactions are probed (54). DFS was conducted to determine the extent to which the loading rates influence the force required to break molecular interactions established in bovine and mouse rhodopsin. In DFS, the strength of molecular interactions is probed at different loading rates by changing the pulling velocity. Both rhodopsins were mechanically unfolded at pulling velocities of 100, 300, 700, 1500, 3000, and 6000 nm/s. To enhance common features among F-D curves recorded at a given pulling velocity, F-D curves were superimposed to generate density maps (Figure S2). Although these superimpositions allow for a first approximation of common unfolding events, the low signal-to-noise ratio makes the assignment of some force peaks difficult. Nonetheless, at first inspection the force peak pattern of superimposed F-D curves appeared largely similar among the different pulling velocities while the magnitude of force peaks increased with faster pulling velocities.
Improvements in data analysis enhance detection of predominant unfolding events
Since the pulling velocity does not appear to alter the pattern of force peaks in F-D curves (Figure S2), all F-D curves collected from each pulling velocity were superimposed to improve the signal-to-noise ratio and increase the resolution of the data (Figures 1E (bovine, n = 901) and 1F (mouse, n = 627)). The signal-to-noise ratio of these global superimpositions was significantly improved over the superimpositions of F-D curves from individual pulling velocities. The global superimpositions highlighted nine prominent force peaks for both bovine and mouse rhodopsin. Similar force peaks can be observed in density maps of individual pulling velocities, albeit at lower resolution (Figure S2). Thus, the location of reproducibly occurring force peaks in F-D curves appears to be similar across all pulling velocities.
In previous analyses of F-D curves obtained from bovine rhodopsin (35), each force peak was fitted with the WLC model and manually classified according to its contour length. An improved analysis procedure for the classification of force peaks has recently been introduced to analyze SMFS data of other membrane proteins (55-59). Using this procedure, every force peak of a F-D curve was fitted using the WLC model to determine individual contour lengths. A histogram was then generated for contour lengths of every force peak in each F-D curve collected across all velocities for bovine and mouse rhodopsin (Figure 2A). A total of 12,520 and 9,830 contour lengths were identified from F-D curves obtained from bovine and mouse samples, respectively.
The global histograms of contour lengths revealed nine peaks for both bovine and mouse rhodopsin (Figure 2A). Similar patterns were observed in histograms obtained from the analysis of F-D curves recorded at individual pulling velocities, albeit with less resolution (Figure S3). Each defined peak in both global histograms was fitted with a Gaussian function to reveal its most probable contour length (Figure 2B), which is reported in Table S1. The small differences in the most probable contour lengths determined for each equivalent peak position of bovine and mouse data were not significant, as assessed by an extra sum of squares F-test (see Materials and Methods). The fitted values for the most probable contour length from bovine rhodopsin were used in subsequent procedures and discussion. In addition, no significant differences were present between bovine and mouse data in the area under each Gaussian curve, as assessed by an extra sum of squares F-test. Thus, neither the position nor the frequency of detection of force peaks appeared to be significantly different between bovine and mouse data.
WLC model curves simulated using the most probable contour lengths determined from the Gaussian analysis are drawn on the density maps for bovine and mouse rhodopsin (Figures 1E and 1F). The simulated WLC model curves correspond well to the nine prominent density regions in superimposed F-D curves. Thus, the nine peaks from the Gaussian fitting of histograms reflect the nine prominent force peaks in superimposed F-D curves. All nine of these force peaks correspond to major force peaks previously classified manually for bovine rhodopsin (35). In previous manual classifications, minor force peaks were also reported (35). Since these minor force peaks were not distinguishable both in the density maps and in the histogram analyses, they were not considered further. The larger number of F-D curves available in the current study significantly enhanced the signal-to-noise ratio in density maps and contour length histograms to reveal better defined details that are common in F-D curves. In addition, the improved analysis procedure circumvented the need for manual classification of every single force peak of each F-D curve.
Structural assignment of unfolding intermediates of rhodopsin
The nine distinct force peaks evident in superimposed F-D curves represent the predominant unfolding events in bovine and mouse rhodopsin (Figures 1E and 1F). The mechanical unfolding of membrane proteins is fundamentally different from that of soluble proteins and occurs in a sequential manner (9). The AFM stylus exerts a pulling force at one end of the polypeptide while the other end is held in place by a structural segment of rhodopsin with sufficient stability to establish an unfolding intermediate (Figure 1A). When the externally applied force overcomes the stability of the structural segment, it unfolds and the unfolded polypeptide is stretched until the forthcoming stable structural segment is encountered. As described previously (35), the contour lengths of the unfolded polypeptide were used to assign structural segments of rhodopsin that were sufficiently stable to establish unfolding intermediates. These stable structural segments were mapped onto the secondary structure of rhodopsin (Figure 2C). The naming of stable structural segments is found in Table 1.
Table 1.
Parameters describing the energy barrier (xu, ku, ΔGu‡) and the mechanical spring constant (κ) of stable structural segments of bovine and mouse rhodopsin. Parameters computed from DFS plots, as described in Materials and Methods, are shown with the standard error.
| Stable structural segments (peak position) |
xu (nm) ± SE | ku (s−1) ± SE | ΔGu‡ ± SE | κ (N/m) ± SE | ||||
|---|---|---|---|---|---|---|---|---|
| Bovine | Mouse | Bovine | Mouse | Bovine | Mouse | Bovine | Mouse | |
| N1 (15 aa) | 0.57 ± 0.15 | 0.36 ± 0.14 | 0.03 ± 0.10 | 0.37 ± 1.27 | 24.21 ± 3.17 | 21.73 ± 3.47 | 0.62 ± 0.25 | 1.39 ± 0.85 |
| N2 (26 aa) | 0.36 ± 0.05 | 0.34 ± 0.10 | 0.46 ± 0.59 | 0.36 ± 0.89 | 21.51 ± 1.29 | 21.74 ± 2.46 | 1.36 ± 0.33 | 1.55 ± 0.70 |
| H1-C1-H2 (37 aa) | 0.36 ± 0.05 | 0.30 ± 0.08 | 0.36 ± 0.40 | 0.89 ± 1.80 | 21.74 ± 1.10 | 20.84 ± 2.02 | 1.41 ± 0.29 | 1.98 ± 0.88 |
| E1 (97 aa) | 0.40 ± 0.04 | 0.45 ± 0.08 | 0.12 ± 0.12 | 0.06 ± 0.11 | 22.81 ± 0.96 | 23.46 ± 1.63 | 1.21 ± 0.22 | 0.96 ± 0.27 |
| H3-C2-H4-E2 (108 aa) | 0.28 ± 0.04 | 0.28 ± 0.05 | 0.33 ± 0.39 | 0.38 ± 0.45 | 21.84 ± 1.20 | 21.70 ± 1.18 | 2.36 ± 0.60 | 2.22 ± 0.58 |
| H5-C3-H6.1 (122 aa) | 0.27 ± 0.03 | 0.37 ± 0.02 | 0.32 ± 0.32 | 0.03 ± 0.01 | 21.87 ± 0.99 | 24.18 ± 0.47 | 2.54 ± 0.55 | 1.44 ± 0.11 |
| H6.2-E3-H7 (169 aa) | 1.22 ± 0.38 | 0.62 ± 0.21 | 0.00 ± 0.00 | 0.15 ± 0.38 | 28.04 ± 4.18 | 22.60 ± 2.50 | 0.16 ± 0.08 | 0.48 ± 0.27 |
| H8 (220 aa) | 0.67 ± 0.18 | 0.59 ± 0.23 | 0.01 ± 0.03 | 0.02 ± 0.07 | 25.39 ± 2.75 | 24.71 ± 3.82 | 0.47 ± 0.20 | 0.58 ± 0.37 |
| CT (238 aa) | 0.35 ± 0.06 | 0.41 ± 0.12 | 0.33 ± 0.38 | 0.19 ± 0.38 | 21.83 ± 1.14 | 22.41 ± 2.04 | 1.52 ± 0.45 | 1.09 ± 0.52 |
Probing the kinetic stability and mechanical properties of bovine and mouse rhodopsin
The force at which SMFS detects an unfolding event reflects the strength of interactions that stabilize the structural segment. This force, however, is dependent on the loading rate at which the interactions are probed (54). Thus, the unfolding force is only a relative measure of the strength of an interaction. An unfolding energy barrier describes the kinetic stability of a folded structure (Figure 3). To reveal insights into unfolding energy barriers, DFS probes the strength of interactions at different loading rates. The Bell-Evans model suggests that a linear relationship between the most probable rupture force and the logarithm of the mechanical loading rate is indicative of a single energy barrier separating the folded and unfolded state (60, 61). This relationship allows the quantification of properties of the energy barrier such as the distance of the free-energy minimum of the folded state to the transition-state, xu, the rate of unfolding in the absence of applied force, ku, and the height of the transition state barrier, ΔGu‡ (Figure 3).
Figure 3.
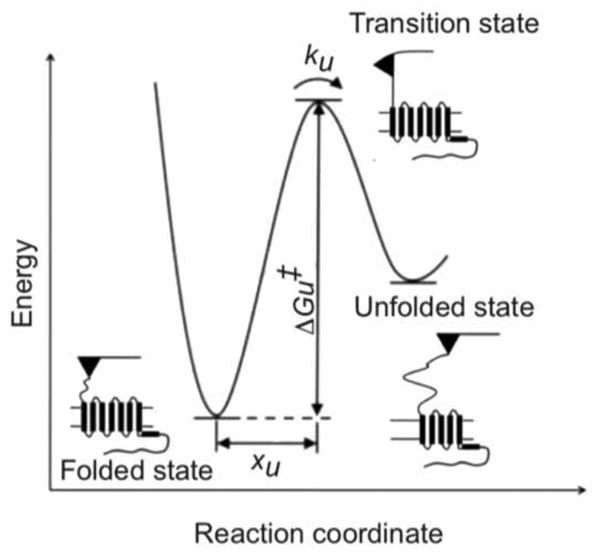
Unfolding energy barrier diagram. An idealized unfolding energy barrier profile for a stable structural segment within rhodopsin is shown. The parameter xu denotes the distance between the energy minimum of the folded state and the transition state. ku denotes the rate of unfolding of the folded segment in the absence of applied force. ΔGu‡ denotes the height of the transition-state barrier.
From DFS data (Figure S2), the most probable rupture forces and loading rates were determined. For each stable structural segment, the most probable rupture force was plotted against the logarithm of the most probable loading rate to reveal a linear relationship (Figure 4), which suggests that each stable structural segment in rhodopsin from both species can be described by a single unfolding energy barrier (60, 61). Estimates of xu and ku were obtained from the fits of Eq. 2 to the DFS data plotted in Figure 4 (Table 1). These fitted values were used to estimate ΔGu‡ and the mechanical rigidity, κ (Table 1). Taking these estimates at face value, the segment in bovine rhodopsin exhibiting the highest kinetic stability is H6.2-E3-H7 (peak at 169 aa) with a ku of < 0.00 s-1 and ΔGu‡ of 28 kBT. The segment in mouse rhodopsin with the highest kinetic stability is H8 (peak at 220 aa) with a ku of 0.02 s-1 and ΔGu‡ of 25 kBT. Segment N2 (peak at 26 aa) exhibited the least kinetic stability in bovine rhodopsin with a ku of 0.46 s-1 and ΔGu‡ of 22 kBT. Segment H1-C1-H2 (peak at 37 aa) exhibited the least kinetic stability in mouse rhodopsin with a ku of 0.89 s-1 and ΔGu‡ of 21 kBT.
The mechanical properties of the receptor can be inferred from DFS by approximating κ, a spring constant providing a measure of rigidity (37). The most rigid structural segments in bovine rhodopsin were H3-C2-H4-E2 (peak at 108 aa) and H5-C3-H6.1 (peak at 122 aa). The xu and κ for segment H3-C2-H4-E2 (peak at 108 aa) was 0.28 nm and 2.36 N/m, respectively. The xu and κ for segment H5-C3-H6.1 (peak at 122 aa) in bovine rhodopsin was 0.27 nm and 2.54 N/m, respectively. The most rigid structural segment in mouse rhodopsin was H3-C2-H4-E2 (peak at 108 aa), where xu and κ was 0.28 nm and 2.22 N/m, respectively. The least rigid structural segment in both bovine and mouse rhodopsin was H6.2-E3-H7 (peak at 169 aa), which exhibited an xu of 1.22 nm and κ of 0.16 N/m in bovine rhodopsin and an xu of 0.62 nm and κ of 0.48 N/m in mouse rhodopsin.
A visual inspection of the fitted lines in the DFS plots of Figure 4 fails to reveal large differences, thereby implying that despite differences observed in the fitted parameters reported in Table 1, the kinetic stability and mechanical nature of molecular interactions in both receptor structures may be largely similar. To test more explicitly whether the parameters xu and ku for each stable structural segment in bovine and mouse rhodopsin are the same or different, an extra sum of squares F-test was conducted (44, 45). DFS data from bovine and mouse were fitted simultaneously so that each shared a common estimate for xu and ku. The sum of squares of the separate and simultaneous fits was then assessed by an F-statistic to determine statistical significance (44, 45) (Table S2). Segment H5-C3-H6.1 (peak at 122 aa) exhibited a P-value of 0.049, which is marginally significant at the P < 0.05 level. Segment N1 (peak at 15 aa) exhibited a P-value of 0.063, which is marginally higher than the P < 0.05 significance level. None of the other segments showed statistical significance. This statistical analysis reveals that despite differences observed in estimated parameters derived from separate fits (Table 1), further testing is required to assess whether a true difference occurs. This requirement is pertinent especially in cases where the fitted parameter is associated with large errors, which is the case with estimates of ku in many DFS studies of both soluble and membrane proteins (e.g., (57, 62)). Thus, extra care must be taken when interpreting the significance of fitted parameters associated with large errors.
Discussion
Rhodopsin from rod photoreceptor cells of bovine and mouse retina has provided a native system to investigate the effects of amino acid residue substitutions. There are 23 amino acid residues that differ in rhodopsin from the two species (Figures 2C and S1). Interestingly, all of these residues in the crystal structure of bovine rhodopsin are surface exposed except for an alanine at position 299 (Figures S1B and S1C), which indicates that no significant differences in structure or stability are to be expected between the two rhodopsins (63). Bovine and mouse rhodopsin exhibited identical UV/Vis absorbance spectra (Figure S4), which is consistent with this expectation of minimal structural differences between the two receptors. Since the spectral properties of 11-cis retinal are exquisitely sensitive to the protein environment and the chromophore-binding pocket consists of residues from several transmembrane α-helices and extracellular loop 2 (64), significant structural perturbations would likely impact the binding pocket environment and alter the spectral properties of the chromophore.
Detailed examination of the effect of natural differences in amino acid sequence of bovine and mouse rhodopsin on the molecular interactions stabilizing receptor structure was investigated by SMFS and DFS. Improved analysis procedures allowed a more clear resolution of common details among SMFS spectra. Superimposition of all F-D curves recorded at each pulling velocity increased the signal-to-noise ratio thereby clearly resolving nine predominant unfolding events (Figures 1 and 2). Both the positions and frequencies of detection of the nine force peaks that characterize these unfolding events were similar for bovine and mouse rhodopsin. This similarity suggests that both rhodopsins form similar molecular interactions and that the thermodynamics of those interactions are largely the same.
DFS plots for bovine and mouse rhodopsin were also similar (Figure 4). Thus, the kinetic stability and mechanical properties appear to be largely the same for each stable structural segment in bovine and mouse rhodopsin, as revealed by the extra sum of squares F-test. A possible difference in these properties may exist for segment H5-C3-H6.1, however, the significance was only marginal in our statistical test. Overall, the amino acid residues that differ naturally between bovine and mouse rhodopsin appear to have minimal bearing on the molecular interactions stabilizing structural segments and unfolding intermediates. Thus, the network of molecular interactions establishing the structural integrity and the functional state of the receptor homologs are largely conserved. Subtle differences in molecular interactions cannot be ruled out, however, and further advancements in the SMFS technology and analysis algorithms may provide additional insights.
The conservation of stabilizing molecular interactions formed in bovine and mouse rhodopsin is consistent with the observation that disease-causing mutations in rhodopsin do not tend to occur at residues that differ between vertebrates (65), thereby suggesting that the majority of interspecies variations minimally perturb receptor structure and function. If subtle differences do exist, they likely have little overall impact on cellular function since the single-photon response is similar in the two species (66-70). The sensitive methods employed here provide a baseline for future studies on rhodopsin. In contrast to the largely similar properties observed here for the two receptor homologs, circumstances causing larger molecular perturbations, such as disease-causing mutations, are likely to illuminate a wealth of insight into the structure and function of the light receptor.
Supplementary Material
Footnotes
This work was supported in part by U.S. Public Health Service grants R00EY018085 and P30EY11373 from the National Institutes of Health, Bethesda, MD. This work was also supported by grants from the Deutsche Forschungsgemeinschaft (DFG), the European Union (FP-7), Research to Prevent Blindness, and the Ohio Lions Eye Research Foundation.
Abbreviations: aa, amino acid residues; AFM, atomic force microscopy/microscope; DFS, dynamic SMFS; F-D, force-distance; GPCR, G protein-coupled receptor; ROS, rod outer segment; SMFS, single-molecule force spectroscopy; WLC, worm-like chain
SUPPORTING INFORMATION AVAILABLE
Supplemental tables and figures are available. Table S1: Average contour lengths of force peaks in F-D curves; Table S2: Extra sum of squares F-test for DFS data; Figure S1: Protein sequence alignment of bovine and mouse rhodopsin; Figure S2: Density maps of superimposed F-D curves recorded at individual pulling velocities; Figure S3: Histograms of contour lengths at individual pulling velocities; Figure S4: UV/Vis absorbance spectra of purified bovine and mouse rhodopsin. This material is available free of charge via the Internet at http://pubs.acs.org.
References
- 1.Kobilka B, Schertler GF. New G-protein-coupled receptor crystal structures: insights and limitations. Trends Pharmacol Sci. 2008;29:79–83. doi: 10.1016/j.tips.2007.11.009. [DOI] [PubMed] [Google Scholar]
- 2.Rosenbaum DM, Rasmussen SG, Kobilka BK. The structure and function of G-protein-coupled receptors. Nature. 2009;459:356–363. doi: 10.1038/nature08144. [DOI] [PMC free article] [PubMed] [Google Scholar]
- 3.Hanson MA, Stevens RC. Discovery of new GPCR biology: one receptor structure at a time. Structure. 2009;17:8–14. doi: 10.1016/j.str.2008.12.003. [DOI] [PMC free article] [PubMed] [Google Scholar]
- 4.Hofmann KP, Scheerer P, Hildebrand PW, Choe HW, Park JH, Heck M, Ernst OP. A G protein-coupled receptor at work: the rhodopsin model. Trends Biochem Sci. 2009;34:540–552. doi: 10.1016/j.tibs.2009.07.005. [DOI] [PubMed] [Google Scholar]
- 5.Mustafi D, Palczewski K. Topology of class A G protein-coupled receptors: insights gained from crystal structures of rhodopsins, adrenergic and adenosine receptors. Mol Pharmacol. 2009;75:1–12. doi: 10.1124/mol.108.051938. [DOI] [PMC free article] [PubMed] [Google Scholar]
- 6.Park PS, Lodowski DT, Palczewski K. Activation of G protein-coupled receptors: beyond two-state models and tertiary conformational changes. Annu Rev Pharmacol Toxicol. 2008;48:107–141. doi: 10.1146/annurev.pharmtox.48.113006.094630. [DOI] [PMC free article] [PubMed] [Google Scholar]
- 7.Ahuja S, Smith SO. Multiple switches in G protein-coupled receptor activation. Trends Pharmacol Sci. 2009;30:494–502. doi: 10.1016/j.tips.2009.06.003. [DOI] [PubMed] [Google Scholar]
- 8.Worth CL, Kleinau G, Krause G. Comparative sequence and structural analyses of G-protein-coupled receptor crystal structures and implications for molecular models. PLoS One. 2009;4:e7011. doi: 10.1371/journal.pone.0007011. [DOI] [PMC free article] [PubMed] [Google Scholar]
- 9.Kedrov A, Janovjak H, Sapra KT, Muller DJ. Deciphering molecular interactions of native membrane proteins by single-molecule force spectroscopy. Annu Rev Biophys Biomol Struct. 2007;36:233–260. doi: 10.1146/annurev.biophys.36.040306.132640. [DOI] [PubMed] [Google Scholar]
- 10.Muller DJ. AFM: a nanotool in membrane biology. Biochemistry. 2008;47:7986–7998. doi: 10.1021/bi800753x. [DOI] [PubMed] [Google Scholar]
- 11.Park PS, Sapra KT, Kolinski M, Filipek S, Palczewski K, Muller DJ. Stabilizing effect of Zn2+ in native bovine rhodopsin. J Biol Chem. 2007;282:11377–11385. doi: 10.1074/jbc.M610341200. [DOI] [PMC free article] [PubMed] [Google Scholar]
- 12.Park PS, Sapra KT, Jastrzebska B, Maeda T, Maeda A, Pulawski W, Kono M, Lem J, Crouch RK, Filipek S, Muller DJ, Palczewski K. Modulation of molecular interactions and function by rhodopsin palmitylation. Biochemistry. 2009;48:4294–4304. doi: 10.1021/bi900417b. [DOI] [PMC free article] [PubMed] [Google Scholar]
- 13.Seifert R, Wenzel-Seifert K. Constitutive activity of G-protein-coupled receptors: cause of disease and common property of wild-type receptors. Naunyn Schmiedebergs Arch Pharmacol. 2002;366:381–416. doi: 10.1007/s00210-002-0588-0. [DOI] [PubMed] [Google Scholar]
- 14.Birnbaumer M. Mutations and diseases of G protein coupled receptors. J Recept Signal Transduct Res. 1995;15:131–160. doi: 10.3109/10799899509045213. [DOI] [PubMed] [Google Scholar]
- 15.Garriga P, Manyosa J. The eye photoreceptor protein rhodopsin. Structural implications for retinal disease. FEBS Lett. 2002;528:17–22. doi: 10.1016/s0014-5793(02)03241-6. [DOI] [PubMed] [Google Scholar]
- 16.Nathans J, Merbs SL, Sung CH, Weitz CJ, Wang Y. Molecular genetics of human visual pigments. Annu Rev Genet. 1992;26:403–424. doi: 10.1146/annurev.ge.26.120192.002155. [DOI] [PubMed] [Google Scholar]
- 17.Stojanovic A, Hwa J. Rhodopsin and retinitis pigmentosa: shedding light on structure and function. Receptors Channels. 2002;8:33–50. [PubMed] [Google Scholar]
- 18.Mendes HF, van der Spuy J, Chapple JP, Cheetham ME. Mechanisms of cell death in rhodopsin retinitis pigmentosa: implications for therapy. Trends Mol Med. 2005;11:177–185. doi: 10.1016/j.molmed.2005.02.007. [DOI] [PubMed] [Google Scholar]
- 19.Li J, Edwards PC, Burghammer M, Villa C, Schertler GF. Structure of bovine rhodopsin in a trigonal crystal form. J Mol Biol. 2004;343:1409–1438. doi: 10.1016/j.jmb.2004.08.090. [DOI] [PubMed] [Google Scholar]
- 20.Teller DC, Okada T, Behnke CA, Palczewski K, Stenkamp RE. Advances in determination of a high-resolution three-dimensional structure of rhodopsin, a model of G-protein-coupled receptors (GPCRs) Biochemistry. 2001;40:7761–7772. doi: 10.1021/bi0155091. [DOI] [PMC free article] [PubMed] [Google Scholar]
- 21.Okada T, Fujiyoshi Y, Silow M, Navarro J, Landau EM, Shichida Y. Functional role of internal water molecules in rhodopsin revealed by X-ray crystallography. Proc Natl Acad Sci U S A. 2002;99:5982–5987. doi: 10.1073/pnas.082666399. [DOI] [PMC free article] [PubMed] [Google Scholar]
- 22.Okada T, Sugihara M, Bondar AN, Elstner M, Entel P, Buss V. The retinal conformation and its environment in rhodopsin in light of a new 2.2 A crystal structure. J Mol Biol. 2004;342:571–583. doi: 10.1016/j.jmb.2004.07.044. [DOI] [PubMed] [Google Scholar]
- 23.Palczewski K, Kumasaka T, Hori T, Behnke CA, Motoshima H, Fox BA, Le TI, Teller DC, Okada T, Stenkamp RE, Yamamoto M, Miyano M. Crystal structure of rhodopsin: A G protein-coupled receptor. Science. 2000;289:739–745. doi: 10.1126/science.289.5480.739. [DOI] [PubMed] [Google Scholar]
- 24.Salom D, Lodowski DT, Stenkamp RE, Le Trong I, Golczak M, Jastrzebska B, Harris T, Ballesteros JA, Palczewski K. Crystal structure of a photoactivated deprotonated intermediate of rhodopsin. Proc Natl Acad Sci U S A. 2006;103:16123–16128. doi: 10.1073/pnas.0608022103. [DOI] [PMC free article] [PubMed] [Google Scholar]
- 25.Nakamichi H, Okada T. Local peptide movement in the photoreaction intermediate of rhodopsin. Proc Natl Acad Sci U S A. 2006;103:12729–12734. doi: 10.1073/pnas.0601765103. [DOI] [PMC free article] [PubMed] [Google Scholar]
- 26.Nakamichi H, Okada T. Crystallographic analysis of primary visual photochemistry. Angew Chem Int Ed Engl. 2006;45:4270–4273. doi: 10.1002/anie.200600595. [DOI] [PubMed] [Google Scholar]
- 27.Ruprecht JJ, Mielke T, Vogel R, Villa C, Schertler GF. Electron crystallography reveals the structure of metarhodopsin I. EMBO J. 2004;23:3609–3620. doi: 10.1038/sj.emboj.7600374. [DOI] [PMC free article] [PubMed] [Google Scholar]
- 28.Park JH, Scheerer P, Hofmann KP, Choe HW, Ernst OP. Crystal structure of the ligand-free G-protein-coupled receptor opsin. Nature. 2008;454:183–187. doi: 10.1038/nature07063. [DOI] [PubMed] [Google Scholar]
- 29.Scheerer P, Park JH, Hildebrand PW, Kim YJ, Krauss N, Choe HW, Hofmann KP, Ernst OP. Crystal structure of opsin in its G-protein-interacting conformation. Nature. 2008;455:497–502. doi: 10.1038/nature07330. [DOI] [PubMed] [Google Scholar]
- 30.Standfuss J, Xie G, Edwards PC, Burghammer M, Oprian DD, Schertler GF. Crystal structure of a thermally stable rhodopsin mutant. J Mol Biol. 2007;372:1179–1188. doi: 10.1016/j.jmb.2007.03.007. [DOI] [PMC free article] [PubMed] [Google Scholar]
- 31.Nakamichi H, Buss V, Okada T. Photoisomerization mechanism of rhodopsin and 9-cis-rhodopsin revealed by x-ray crystallography. Biophys J. 2007;92:L106–108. doi: 10.1529/biophysj.107.108225. [DOI] [PMC free article] [PubMed] [Google Scholar]
- 32.Stenkamp RE. Alternative models for two crystal structures of bovine rhodopsin. Acta Crystallogr D Biol Crystallogr. 2008;D64:902–904. doi: 10.1107/S0907444908017162. [DOI] [PMC free article] [PubMed] [Google Scholar]
- 33.Shimamura T, Hiraki K, Takahashi N, Hori T, Ago H, Masuda K, Takio K, Ishiguro M, Miyano M. Crystal structure of squid rhodopsin with intracellularly extended cytoplasmic region. J Biol Chem. 2008;283:17753–17756. doi: 10.1074/jbc.C800040200. [DOI] [PMC free article] [PubMed] [Google Scholar]
- 34.Murakami M, Kouyama T. Crystal structure of squid rhodopsin. Nature. 2008;453:363–367. doi: 10.1038/nature06925. [DOI] [PubMed] [Google Scholar]
- 35.Sapra KT, Park PS, Filipek S, Engel A, Muller DJ, Palczewski K. Detecting molecular interactions that stabilize native bovine rhodopsin. J Mol Biol. 2006;358:255–269. doi: 10.1016/j.jmb.2006.02.008. [DOI] [PubMed] [Google Scholar]
- 36.Molday RS, MacKenzie D. Monoclonal antibodies to rhodopsin: characterization, cross-reactivity, and application as structural probes. Biochemistry. 1983;22:653–660. doi: 10.1021/bi00272a020. [DOI] [PubMed] [Google Scholar]
- 37.Sapra KT, Park PS, Palczewski K, Muller DJ. Mechanical properties of bovine rhodopsin and bacteriorhodopsin: possible roles in folding and function. Langmuir. 2008;24:1330–1337. doi: 10.1021/la702299z. [DOI] [PMC free article] [PubMed] [Google Scholar]
- 38.Butt HJ, Jaschke M. Calculation of thermal noise in atomic force microscopy. Nanotechnology. 1995;6:1–7. [Google Scholar]
- 39.Florin EL, Rief M, Lehmann H, Ludwig M, Dornmair C, Moy VT, Gaub HE. Sensing specific molecular interactions with the atomic force microscope. Biosens Bioelectron. 1995;10:895–901. [Google Scholar]
- 40.Bustamante C, Marko JF, Siggia ED, Smith S. Entropic elasticity of lambda-phage DNA. Science. 1994;265:1599–1600. doi: 10.1126/science.8079175. [DOI] [PubMed] [Google Scholar]
- 41.Sapra KT, Balasubramanian GP, Labudde D, Bowie JU, Muller DJ. Point mutations in membrane proteins reshape energy landscape and populate different unfolding pathways. J Mol Biol. 2008;376:1076–1090. doi: 10.1016/j.jmb.2007.12.027. [DOI] [PMC free article] [PubMed] [Google Scholar]
- 42.Struckmeier J, Wahl R, Leuschner M, Nunes J, Janovjak H, Geisler U, Hofmann G, Jahnke T, Muller DJ. Fully automated single-molecule force spectroscopy for screening applications. Nanotechnology. 2008;19:1–10. doi: 10.1088/0957-4484/19/38/384020. [DOI] [PubMed] [Google Scholar]
- 43.Evans E. Looking inside molecular bonds at biological interfaces with dynamic force spectroscopy. Biophys Chem. 1999;82:83–97. doi: 10.1016/s0301-4622(99)00108-8. [DOI] [PubMed] [Google Scholar]
- 44.Wells JW. Analysis and interpretation of binding at equilibrium. In: Hulme EC, editor. Receptor-Ligand Interactions: A Practical Approach. 1992. Oxford University Press; Oxford; 1992. pp. 289–395. [Google Scholar]
- 45.Motulsky H, Christopoulos A. Fitting models to biological data using linear and nonlinear regression: a practical guide to curve fitting. Oxford University Press; New Yor: 2004. [Google Scholar]
- 46.Muller DJ, Amrein M, Engel A. Adsorption of biological molecules to a solid support for scanning probe microscopy. J Struct Biol. 1997;119:172–188. doi: 10.1006/jsbi.1997.3875. [DOI] [PubMed] [Google Scholar]
- 47.Oesterhelt F, Oesterhelt D, Pfeiffer M, Engel A, Gaub HE, Müller DJ. Unfolding pathways of individual bacteriorhodopsins. Science. 2000;288:143–146. doi: 10.1126/science.288.5463.143. [DOI] [PubMed] [Google Scholar]
- 48.Kedrov A, Ziegler C, Janovjak H, Kuhlbrandt W, Müller DJ. Controlled unfolding and refolding of a single sodium-proton antiporter using atomic force microscopy. J Mol Biol. 2004;340:1143–1152. doi: 10.1016/j.jmb.2004.05.026. [DOI] [PubMed] [Google Scholar]
- 49.Muller DJ, Schoenenberger CA, Schabert F, Engel A. Structural changes in native membrane proteins monitored at subnanometer resolution with the atomic force microscope: a review. J Struct Biol. 1997;119:149–157. doi: 10.1006/jsbi.1997.3878. [DOI] [PubMed] [Google Scholar]
- 50.Muller DJ, Engel A, Matthey U, Meier T, Dimroth P, Suda K. Observing membrane protein diffusion at subnanometer resolution. J Mol Biol. 2003;327:925–930. doi: 10.1016/s0022-2836(03)00206-7. [DOI] [PubMed] [Google Scholar]
- 51.Liang Y, Fotiadis D, Filipek S, Saperstein DA, Palczewski K, Engel A. Organization of the G protein-coupled receptors rhodopsin and opsin in native membranes. J Biol Chem. 2003;278:21655–21662. doi: 10.1074/jbc.M302536200. [DOI] [PMC free article] [PubMed] [Google Scholar]
- 52.Nickell S, Park PS, Baumeister W, Palczewski K. Three-dimensional architecture of murine rod outer segments determined by cryoelectron tomography. J Cell Biol. 2007;177:917–925. doi: 10.1083/jcb.200612010. [DOI] [PMC free article] [PubMed] [Google Scholar]
- 53.Kedrov A, Krieg M, Ziegler C, Kuhlbrandt W, Müller DJ. Locating ligand binding and activation of a single antiporter. EMBO Rep. 2005;6:668–674. doi: 10.1038/sj.embor.7400455. [DOI] [PMC free article] [PubMed] [Google Scholar]
- 54.Evans E. Probing the relation between force--lifetime--and chemistry in single molecular bonds. Annu Rev Biophys Biomol Struct. 2001;30:105–128. doi: 10.1146/annurev.biophys.30.1.105. [DOI] [PubMed] [Google Scholar]
- 55.Cisneros DA, Oberbarnscheidt L, Pannier A, Klare JP, Helenius J, Engelhard M, Oesterhelt F, Muller DJ. Transducer binding establishes localized interactions to tune sensory rhodopsin II. Structure. 2008;16:1206–1213. doi: 10.1016/j.str.2008.04.014. [DOI] [PubMed] [Google Scholar]
- 56.Sapra KT, Damaghi M, Koster S, Yildiz O, Kuhlbrandt W, Muller DJ. One beta hairpin after the other: exploring mechanical unfolding pathways of the transmembrane beta-barrel protein OmpG. Angew Chem Int Ed Engl. 2009;48:8306–8308. doi: 10.1002/anie.200904361. [DOI] [PubMed] [Google Scholar]
- 57.Bippes CA, Zeltina A, Casagrande F, Ratera M, Palacin M, Muller DJ, Fotiadis D. Substrate binding tunes conformational flexibility and kinetic stability of an amino acid antiporter. J Biol Chem. 2009;284:18651–18663. doi: 10.1074/jbc.M109.004267. [DOI] [PMC free article] [PubMed] [Google Scholar]
- 58.Damaghi M, Bippes C, Koster S, Yildiz O, Mari SA, Kuhlbrandt W, Muller DJ. pH-dependent interactions guide the folding and gate the transmembrane pore of the beta-barrel membrane protein OmpG. J Mol Biol. 2010;397:878–882. doi: 10.1016/j.jmb.2010.02.023. [DOI] [PubMed] [Google Scholar]
- 59.Kedrov A, Hellawell AM, Klosin A, Broadhurst RB, Kunji ER, Muller DJ. Probing the interactions of carboxy-atractyloside and atractyloside with the yeast mitochondrial ADP/ATP carrier. Structure. 2010;18:39–46. doi: 10.1016/j.str.2009.11.009. [DOI] [PubMed] [Google Scholar]
- 60.Evans E, Ritchie K. Dynamic strength of molecular adhesion bonds. Biophys J. 1997;72:1541–1555. doi: 10.1016/S0006-3495(97)78802-7. [DOI] [PMC free article] [PubMed] [Google Scholar]
- 61.Bell GI. Models for the specific adhesion of cells to cells. Science. 1978;200:618–627. doi: 10.1126/science.347575. [DOI] [PubMed] [Google Scholar]
- 62.Dietz H, Berkemeier F, Bertz M, Rief M. Anisotropic deformation response of single protein molecules. Proc Natl Acad Sci U S A. 2006;103:12724–12728. doi: 10.1073/pnas.0602995103. [DOI] [PMC free article] [PubMed] [Google Scholar]
- 63.Pakula AA, Sauer RT. Genetic analysis of protein stability and function. Annu Rev Genet. 1989;23:289–310. doi: 10.1146/annurev.ge.23.120189.001445. [DOI] [PubMed] [Google Scholar]
- 64.Filipek S, Stenkamp RE, Teller DC, Palczewski K. G protein-coupled receptor rhodopsin: a prospectus. Annu Rev Physiol. 2003;65:851–879. doi: 10.1146/annurev.physiol.65.092101.142611. [DOI] [PMC free article] [PubMed] [Google Scholar]
- 65.Briscoe AD, Gaur C, Kumar S. The spectrum of human rhodopsin disease mutations through the lens of interspecific variation. Gene. 2004;332:107–118. doi: 10.1016/j.gene.2004.02.037. [DOI] [PubMed] [Google Scholar]
- 66.Calvert PD, Govardovskii VI, Krasnoperova N, Anderson RE, Lem J, Makino CL. Membrane protein diffusion sets the speed of rod phototransduction. Nature. 2001;411:90–94. doi: 10.1038/35075083. [DOI] [PubMed] [Google Scholar]
- 67.Nakatani K, Tamura T, Yau KW. Light adaptation in retinal rods of the rabbit and two other nonprimate mammals. J Gen Physiol. 1991;97:413–435. doi: 10.1085/jgp.97.3.413. [DOI] [PMC free article] [PubMed] [Google Scholar]
- 68.Wang Z, Wen XH, Ablonczy Z, Crouch RK, Makino CL, Lem J. Enhanced shutoff of phototransduction in transgenic mice expressing palmitoylation-deficient rhodopsin. J Biol Chem. 2005;280:24293–24300. doi: 10.1074/jbc.M502588200. [DOI] [PMC free article] [PubMed] [Google Scholar]
- 69.Krispel CM, Chen D, Melling N, Chen YJ, Martemyanov KA, Quillinan N, Arshavsky VY, Wensel TG, Chen CK, Burns ME. RGS expression rate-limits recovery of rod photoresponses. Neuron. 2006;51:409–416. doi: 10.1016/j.neuron.2006.07.010. [DOI] [PubMed] [Google Scholar]
- 70.Xu J, Dodd RL, Makino CL, Simon MI, Baylor DA, Chen J. Prolonged photoresponses in transgenic mouse rods lacking arrestin. Nature. 1997;389:505–509. doi: 10.1038/39068. [DOI] [PubMed] [Google Scholar]
Associated Data
This section collects any data citations, data availability statements, or supplementary materials included in this article.