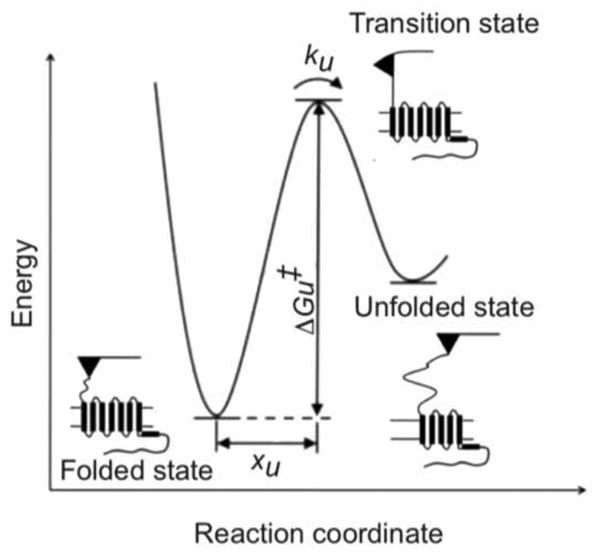
Figure 3.

Unfolding energy barrier diagram. An idealized unfolding energy barrier profile for a stable structural segment within rhodopsin is shown. The parameter xu denotes the distance between the energy minimum of the folded state and the transition state. ku denotes the rate of unfolding of the folded segment in the absence of applied force. ΔGu‡ denotes the height of the transition-state barrier.
