Abstract
Context: Anaplastic thyroid carcinoma (ATC) is a highly aggressive carcinoma in need of therapeutic options. One critical component of drug discovery is the availability of well-characterized cell lines for identification of molecular mechanisms related to tumor biology and drug responsiveness. Up to 42% of human thyroid cancer cell lines are redundant or not of correct tissue origin, and a comprehensive analysis is currently nonexistent. Mechanistically, RhoB has been identified as a novel molecular target for ATC therapy.
Objective: The aim was to develop four ATC cell lines detailing genetic, molecular, and phenotypic characteristics and to test five classes of drugs on the cell lines to determine whether they inhibited cell proliferation in a RhoB-dependent fashion.
Design: Four cell lines were derived from ATC tumors. Short tandem DNA repeat and mutational status of the originating tumors and cell lines were performed along with molecular and phenotypic characterizations. Compounds were tested for growth inhibition and ability to up-regulate RhoB.
Results: Cell line authenticity was confirmed by DNA short tandem repeat analysis. Each proved unique regarding expression of thyroid markers, oncogene status, amplified and deleted genes, and proliferative growth rates. FTI-277, GGTI-286, lovastatin, romidepsin, and UCN-01 up-regulated RhoB and inhibited cell proliferation in a dose-responsive fashion with only romidepsin and FTI-277 being RhoB dependent.
Conclusions: Molecular descriptions of thyroid lines were matched to the originating tumors, setting a new standard for cell line characterization. Furthermore, suppressed RhoB is implicated as a molecular target for therapy against ATC because five classes of drugs up-regulate RhoB and inhibit growth dose-responsively.
Suppressed RhoB is a molecular therapeutic target against anaplastic thyroid carcinoma (ATC) identifying five drug classes that upregulate RhoB and inhibit growth in four new ATC cell lines.
Anaplastic thyroid cancer (ATC) has no effective treatment and carries a dismal prognosis (1). We have previously shown that up-regulation of suppressed RhoB represents a novel therapeutic intervention (2). RhoB is a member of the Ras superfamily of isoprenylated small GTPases with known antitumor activity (3).
Cell lines are used extensively in research and drug development as cancer models. However, a substantial proportion of cell lines become mislabeled or cross-contaminated by cells derived from a different tissue or species (4). This is especially true for thyroid cancer cell lines, as evidenced by a recent report in which 17 of 40 commonly used cell lines lacked a unique genetic signature, as determined by short tandem repeat (STR) and single nucleotide polymorphism analysis (5). The cell line DRO90-1 appeared identical to the melanoma-derived A375 cell line, whereas another supposed ATC line, ARO81-1, matched the HT-29 colon cancer cell line. Both the melanoma and colon cell lines had been created over 10 yr before DRO and ARO, suggesting that they originated by laboratory cross-contamination, yet the DRO and ARO cells have been used in over 200 publications. The conclusions of many of these studies are therefore suspect in regard to the ATC signaling pathways and effective drug therapies they suggest. Many key experiments might have to be repeated with better characterized ATC cell lines (1). These problems are compounded by the discovery that several other ATC cell lines are not unique, but represent derivatives of each other.
In this paper, we propose new standards for characterization and apply these to the development of four new ATC cell lines. We then use these lines to explore further the role of RhoB as a molecular target in ATC, and we test the growth inhibitory effects of five classes of RhoB-inducing drugs.
Materials and Methods
Reagents
Romidepsin was a gift from Gloucester Pharmaceuticals, Inc. (Cambridge, MA) and the Division of Cancer Treatment and Diagnosis, National Cancer Institute (Bethesda, MD). FTI-277, GGTI-286, lovastatin, and UCN-01 were purchased from Sigma Aldrich (St. Louis, MO).
Plasmids
The RhoB constitutively active construct (pcDNA3/caRhoB) was a gift from Dr. Harry Mellor (University of Bristol, United Kingdom). The Q63L mutation in the insert was confirmed by DNA sequencing. The construct insert was then cloned into pcDNA4/TO/myc-His A (Invitrogen, Carlsbad, CA), and inserts were sequence-verified. KTC3 cells were transfected with pcDNA6/TR (Invitrogen) and placed under blasticidin (Thermo Fisher Scientific, Houston, TX) selection. KTC3 pcDNA6/TR clones were selected for low basal expression and high inducible expression of the Tet repressor as identified by β-galactosidase activity (Invitrogen). Stable transfection of KTC3 pcDNA6/TR cells with pcDNA4/TO/myc-His/caRhoB was selected using blasticidin and zeocin (Invitrogen).
Tissues and their cell lines
This study was approved by the Mayo Institutional Review Board Committee. The KTC3 ATC cell line was a gift from Dr. Junichi Kurebayashi (Kawasaki Medical School, Kurashiki, Japan) (6). All THJ cell lines were established in the Copland laboratory from human tissues. Tissue for THJ-11T was received from Dr. Clive Grant (Mayo Clinic), and THJ-21T was from Dr. Orlo Clark (University of California San Francisco). Tissues for THJ-16T and THJ-29T were received from Dr. Trad Wadsworth (East Virginia Medical School). A portion of each tissue was processed for pathology review. The rest was minced, washed in PBS (Cellgro, Herndon, VA), and initially cultured in RPMI 1640 medium (Cellgro) supplemented with 10% fetal bovine serum (Hyclone, Logan, UT), nonessential amino acids (Cellgro), sodium pyruvate (Cellgro), 1 nm T3 (Sigma Aldrich), 0.5 μg/ml hydrocortisone (Sigma Aldrich), 8 ng/ml epidermal growth factor (Invitrogen), HEPES (Cellgro), and penicillin-streptomycin-amphotericin B (Cellgro) at 37 C in a humidified atmosphere with 5% CO2. After 1 wk in culture, tissues were digested in 0.25% trypsin (Cellgro) for 10 min at 37 C, followed by a PBS wash. Cells were cultured for 6 to 12 months and were designated stable cell lines once they reached passage 20 or when homogeneous. Once established, media formulation was adjusted to exclude T3, hydrocortisone, and epidermal growth factor and was then changed to 10% charcoal-stripped fetal bovine serum (Hyclone). For morphology studies, cells were plated in 100-mm plates and grown to approximately 90% confluence. Phase images were obtained on an inverted Olympus microscope (C Squared Corporation, Pittsburgh, PA). For xenograft studies, suspensions of 5 × 10⁶ cells/0.1 ml 50% matrigel (BD Bioscience, San Jose, CA) in RPMI medium were injected sc in one flank of 3- to 4-wk-old athymic female nude mice (Harlan, Tampa, FL). Establishment of tumors was observed for 4 to 8 wk.
DNA isolation and STR analysis
Genomic DNA from primary tissues and matching cell lines was isolated using the AquaPure Genomic DNA Isolation kit (Bio-Rad, Hercules, CA). Twelve STR markers were amplified in six duplex PCRs using fluorescently labeled primers from ABI (Applied Biosystems, Foster City, CA). After thermal cycling, the contents were pooled into two 6-plexs and analyzed on an ABI 3130 (Applied Biosystems). Pool one contained the following markers: D7S484, D13S158, D10S197, D14S70, mycl, and D21S1252. Pool two contained D8S262, D17S250, D15S1002, D16S520, D2S2368, and D6S441. Peak sizes were calculated vs. a coinjected size standard using Gene Marker (Soft Genetics, State College, PA).
RNA isolation and RT-PCR
Total mRNA was isolated from cells using RNAqueous (Ambion, Austin, TX), followed by ethanol precipitation. Then 3 μg RNA in the High Capacity Reverse Transcription kit (Applied Biosystems) was used to generate cDNA, approximately 200 ng of which was then amplified using the ThermalAce DNA polymerase kit (Invitrogen). The primers used to amplify thyroglobulin (TG), TSH receptor (TSHR), sodium iodide symporter (NIS), thyroid transcription factor 1 (TTF1), thyroid peroxidase (TPO), pendrin (PDS), paired box 8 (PAX8) and glyceraldehyde-3-phosphate-dehydrogenase (GAPDH) as an internal control are listed in Supplemental Table 1, published on The Endocrine Society’s Journals Online web site at http://jcem.endojournals.org. PCR products were electrophoresed in 2% agarose gels, stained with ethidium bromide (Invitrogen), and checked for the expected lengths. Two-step quantitative reverse transcriptase-mediated real-time PCR was used to measure changes in RhoB mRNA levels in ATC. Applied Biosystems’ assays-on-demand assay mix of primers and TaqMan MGB probes (FAM dye-labeled) for RhoB (Hs00269660_s1) and GAPDH (Hs99999905_m1) were used for quantitative reverse transcriptase-mediated real-time measurements. Data were normalized to GAPDH for each sample. Fold-change values between treated and control samples were calculated using the ΔΔCt method (7).
DNA mutational analysis
All samples were examined for the following known thyroid tumorigenic changes: 1) presence of the BRAFT1799A mutation; 2) presence of mutations in codons 12, 13, or 61 in KRAS, NRAS, and HRAS; 3) presence of RET/PTC1, RET/PTC2, and/or RET/PTC3 fusion-oncogenes; and 4) presence of any of the four known variants of the PAX8/PPARγ fusion-oncogene. Phosphatidylinositol 3-kinase (PI3KCA) was examined for genomic mutations in two regions of the regulatory domain that account for approximately 80% of known PI3KCA mutation. The analysis was performed as described by Garcia-Rostan et al. (8). For BRAFT1799A detection, a previously developed real-time PCR assay based on allele-specific amplification was used (9). The assay has a detection sensitivity of less than 1 BRAFT1799A copy in a background of 100,000 wild-type copies. For detection of RAS mutations, wild-type-matched melting probes were designed for codons 12, 13, and 61 of KRAS, NRAS, and HRAS. Samples that showed deviation from the wild-type melting profile, broadening or splitting of the peak, or shift in melting temperature were DNA-sequenced to determine which mutation was present. The sensitivity for mutation detection by melting curve analysis was no greater than one mutant per 20 wild-type copies. DNA sequencing was found to have a detection sensitivity of approximately 1:10 mutant to wild-type copies. RET/PTC1, RET/PTC2, RET/PTC3, and PAX8/PPARγ (four known variants) were detected by RT-PCR using fluorophore-labeled, intron-spanning primer combination sites in the exons located 5-prime and 3-prime, respectively, of the fusion sites. All runs included a no reverse transcription control and control reactions using intron-spanning primers for transcripts of a house keeping gene, PGK (two different amplicons: 138 and 222 bp), and of the thyroid-specific expressed PAX8 gene (125 bp). The RT-PCR products were size-separated on an ABI3130 genetic analyzer (Applied Biosystems). The presence of a given specific fusion transcript is determined based on the fragment size and fluorophore color. Any peak with a fluorescence intensity of 500 or higher (arbitrary scale) is considered positive. The limit of the detection was determined to be between 1:100 and 1:10,000.
Array-based comparative genomic hybridization (CGH)
DNA from each new cell line was extracted using QIAGEN QIAamp DNA Micro Kits (QIAGEN, Valencia, CA). Cell line DNA and commercial female reference DNA (Promega, Madison, WI) were partially deoxyribonuclease I digested and labeled with Cy-5 deoxyuridine 5-triphosphate (dUTP) and Cy-3 dUTP, respectively (BioPrime labeling kit; Invitrogen). The minimal accepted labeling efficiency was 25 pmol incorporated dye/μg of DNA. Reference samples were pooled and depooled to eliminate variation, then combined with their respective experimental cell line samples. The hybridization mixtures were denatured at 95 C (3 min) and incubated at 37 C (30 min). Each mixture was centrifuged at 14,000 × g (2 min) or greater to remove precipitates, applied to 244K CGH Microarrays (Agilent Technologies, Santa Clara, CA), and placed in an Agilent microarray hybridization chamber for 40 h at 65 C. The arrays were then washed for 5 min at room temperature in 0.5× SSPE/0.005% N-lauryl sarcosine, followed by 3 min at 37 C in 0.1× SSPE/0.005% N-lauryl sarcosine. Slides were dried and scanned using an Agilent 2565C DNA microarray scanner, and images were analyzed using the Agilent Feature Extraction software version 10.1 (Agilent Technologies). Default settings for CGH arrays were used according to the supplier’s recommendations. Log2 ratios of fluorescence signals and corresponding log2 ratio errors calculated from the log10 output of Feature Extraction Software for each of the hybridizations were analyzed using DNA Analytics 4.0 (Agilent Technologies). Aberrant regions were determined with the Aberration Detection Module 2 (Agilent Technologies).
Proliferation assays
For growth analysis, cells were plated in 12-well plates (Midwest Scientific, St. Louis, MO) in triplicate at a concentration of 2 × 10⁴ cells/well. After 1, 3, 5, and 7 d, cells were collected and counted on a Coulter Particle Counter (Beckman, Brea, CA), and doubling time was calculated using www.doubling-time.com/compute.php. For drug responses, cells were plated in 24-well plates (Midwest Scientific) in triplicate at a concentration of 1 × 10⁴ cells/well and treated with FTI-277, GGTI-286, lovastatin, romidepsin, or UCN-01 for 72 h. Cells were counted, followed by determination of IC50 via extrapolation of 50% growth on a log scale to determine corresponding drug concentration. For RhoB small interfering RNA (siRNA) assays, cells were plated in triplicate at either 4.0 × 10⁴ cells/ml in six-well plates (Midwest Scientific) or 2 × 10⁴ cells/well in 12-well plates (Midwest Scientific), allowed to adhere overnight, and then transfected for 24 h with 2 to 5 μg of either scrambled (no. 1027310, target is AATTCTCCGAACGTGTCACGT) or RhoB (no. SI00058933, target is CCTGCTGATCGTGTTCAGTAA) specific siRNA duplexes (QIAGEN) using RNAiFect reagent (QIAGEN). After transfection, cells in the six-well plates were treated with either dimethyl sulfoxide 1:1,000 or indicated drug for 24 h and then analyzed by immunoblotting. Cells in the 12-well plates were exposed for 6 d with medium, and drug was changed every 48 h. After 6 d, cells were washed with PBS (Cellgro), trypsinized, and counted by Coulter Particle Counter (Beckman).
Flow cytometry
For cell death analysis, cells were plated in 6-cm plates (Midwest Scientific) and grown to approximately 50% confluence before treatment for 72 h. Media was collected for floating cells, and adhered cells were collected using 0.05% trypsin (Cellgro). Both floating and adhered cells were washed with cold PBS and resuspended in cold binding buffer (BD PharMingen, San Jose, CA) at 1 × 10⁶/ml, followed by staining with propidium iodide (BD PharMingen) for 10 min. Fluorescence activated cell sorting analysis was performed on Accuri C6 flow cytometer (Accuri, Ann Arbor, MI). Unstained cells were used as controls for setting the cell population parameters.
Western blot analysis
Cells were plated in 10-cm plates and grown to approximately 50% confluence before treatment for 24 h. Cell lysis was done in RIPA buffer containing 50 mm Tris, 5 mm EDTA, 150 mm NaCl, 0.1% sodium dodecyl sulfate, 0.5% deoxycholate, 1% Nonidet P-40, protease inhibitor cocktail (Roche, Mannheim, Germany), and phosphatase inhibitor (Pierce, Rockford, IL) followed by centrifugation. Supernatant protein concentrations were measured by bicinchoninic acid protein assay (Pierce). Twenty-five micrograms of protein were loaded on SDS-PAGE gels (Invitrogen) and then transferred to Immobilon-P membranes. The membranes were hybridized with antibodies (Santa Cruz Biotechnology, Santa Cruz, CA; Cell Signaling Technology, Danvers, MA; BD Transduction Laboratories, Lexington, KY; and R&D Biosystems, Minneapolis, MN) to the various proteins overnight at 4 C. Secondary species-specific horseradish peroxidase-labeled antibodies (Jackson Immunoresearch, West Grove, PA) were applied (45 min at room temperature). Detection was performed using Supersignal chemiluminescence kit (Pierce).
Results
Cell-line characterization
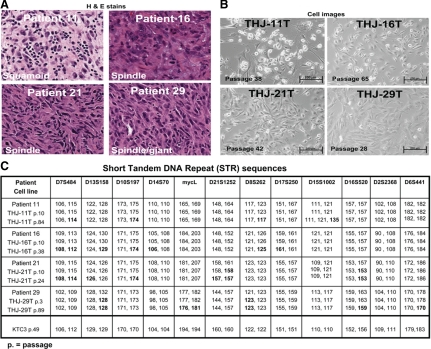
The originating ATC tumor histology, showing cell morphologies of squamoid, spindle, giant, or a combination, are depicted in Fig. 1A, along with the matching images of the derived cell lines (Fig. 1B). No papillary or follicular features were noted. STR analysis validated that each derivative line matched its originating tumor tissue (Fig. 1C). STR analysis on later passaged cells (Fig. 1C) showed stable allele sizes for the majority of markers within the 0- to 3-bp accuracy of the well-calibrated ABI sequencer. However, some genetic drift (Fig. 1C, bold data) was observed, mostly loss of heterozygosity: THJ-11T, p84: D8S262; THJ-21T, p24: D13S158 and (p10 and p24) D21S1252 and D16S520; THJ-29T, p3 and p89: D13S158 and D8S262; and, p89: D16S520 and D6S441. A change from heterozygosity to homo(hemi)zygosity is unlikely to represent an analytical error (i.e. THJ-29T D6S441 and p3 = 170, 178 to p89 = 170, 170). There is one example of a cell line acquiring a third allele, likely by chromosome duplication or microsatellite instability—TJH-11T, p84: D15S1002. Despite these minor variations in allele calls and loss of heterozygosity with increasing passage, we interpret these data to indicate that the final cell lines represent the tumors of origin, without any significant contamination or overgrowth.
Figure 1.
The parent ATC tumor tissue matches its corresponding derivative cell line. A, Hematoxylin & eosin (H&E) staining of patient anaplastic thyroid tissues labeled with predominant subtype. B, Phase contrast images of live human anaplastic thyroid carcinoma cell lines derived from patient tissues. Passage numbers are as indicated. C, STR DNA sequences of both patient tumors and cell lines confirm identities of derived cultures. The original tumor tissue for KTC3 was not available because the cell line was not established in our laboratory. Passage numbers are as indicated. Genetic drift data are in bold.
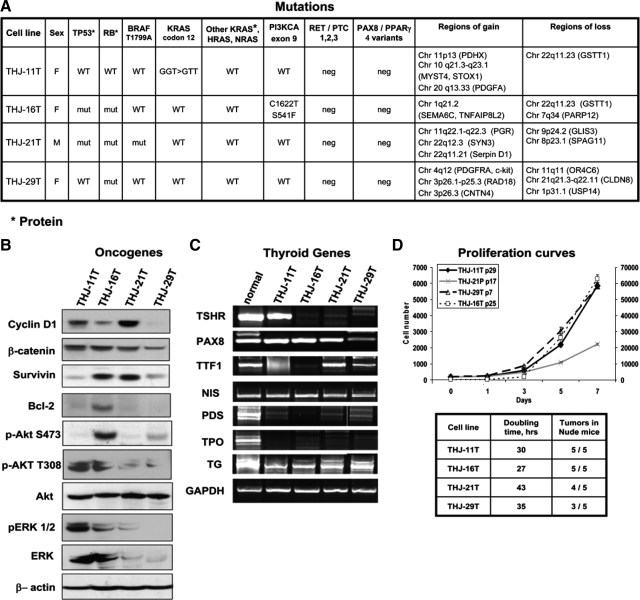
We included STR analysis on KTC3 cells because this has not been previously reported (Fig. 1C). The original tumor tissue for KTC3 was not available because the cell line was not established in our laboratory. The ATC cell lines were further characterized for mutations, rearrangements, and genetic gains and losses (Fig. 2A). Each cell line demonstrated unique patterns of genetic changes that include alterations in BRAF, TP53, RB, RAS, and PI3KCA (Fig. 2A). Unique expression patterns of oncogenes and thyroid-specific genes were also noted (Fig. 2, B and C, and Supplemental Figs. 1 and 2). Cell proliferation and doubling times demonstrated that THJ-16T showed the most aggressive growth (Fig. 2D). All four cell lines grew in athymic nude mice (Fig. 2D). The length of time for tumors to reach 50–100 mm3 is as follows: THJ-11T was 3 wk, THJ-16T was 5 wk, THJ-21T was 12 wk, and THJ-29T was 14 wk. Interestingly, THJ-11T, which has high p-ERK1/2, p-AKT T308, and a KRAS mutation, grew the best in vivo.
Figure 2.
Unique mutations are identified for each new ATC cell line. A, Summary of mutations, translocations, and unique regions of gains and losses are shown for each new ATC cell line. WT, Wild-type; neg, negative; mut, mutation. B, Western analysis of frequently overexpressed oncogenic proteins in ATC are shown for each cell line. C, RT-PCR analysis confirms dedifferentiation in ATC cell lines with loss of mRNA expression for some thyroid-specifying genes. The number of cycles used for each gene is indicated in Supplemental Table 1. D, Cellular proliferation curve over 7 d demonstrates proliferative potential of the cell lines. Passage numbers are as indicated (p). Note that y-axis/cell number for THJ-16T cells is on the right side of the graph. For each cell line, the doubling times and ectopically implanted tumor growth in athymic nude mice are shown in the table. Cells were implanted ectopically as described in Materials and Methods.
RhoB as a target for ATC therapy
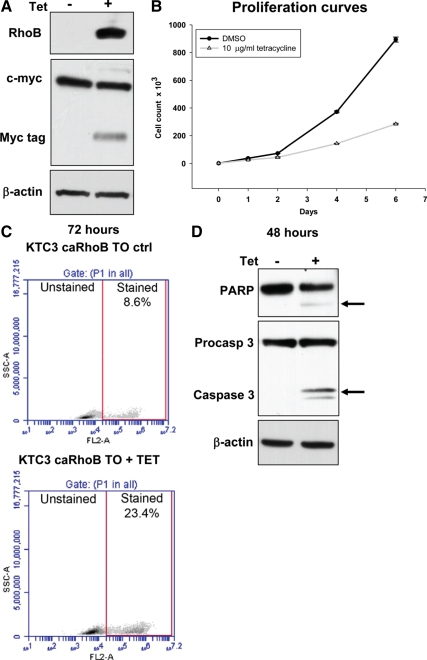
We previously demonstrated that RhoB is a molecular target for therapy in established ATC cell lines (2) and replicated these results in the newly established ATC cell lines. Induction of RhoB alone is growth inhibitory in tetracycline-treated KTC3 cells engineered to induce RhoB (Fig. 3, A and B). Apoptosis is induced in 23.4% of the cells examined 48 to 72 h after tetracycline treatment (Fig. 3, C and D). Thus, we established that RhoB alone is sufficient to inhibit growth and induce apoptosis in at least a portion of the cells.
Figure 3.
RhoB induction in ATC cells leads to growth arrest and apoptosis. A, Constitutively active RhoB (caRhoB) is expressed in a c-myc/his tagged tetracycline-inducible vector in KTC3 cells (KTC3 caRhoB TO). In response to 24 h of 10 μg/ml tetracycline, myc-tagged RhoB expression is induced. B, A proliferation assay over 6 d confirms that a single treatment of 10 μg/ml tetracycline blocks growth via RhoB induction. DMSO, Dimethyl sulfoxide. C, KTC3 caRhoB TO tetracycline-treated cells were stained with propidium iodide 72 h after induction and examined for cell death via flow cytometry. As indicated in the lower panel, 23.4% of the cells stained positive for cell death when plotting SSC-A (side scatter for cell density) vs. FL2-A (propidium iodide fluorescence). D, Western analysis of molecular markers for apoptosis included PARP and activated caspase 3, which are induced in tetracycline-treated KTC3 caRhoB TO cells as indicated by the arrows.
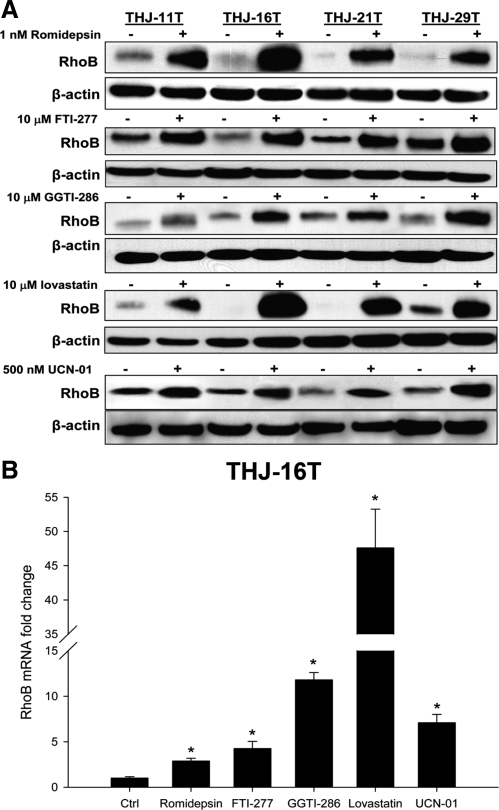
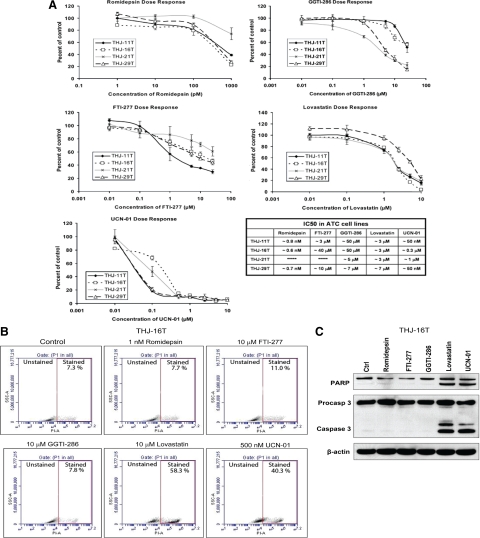
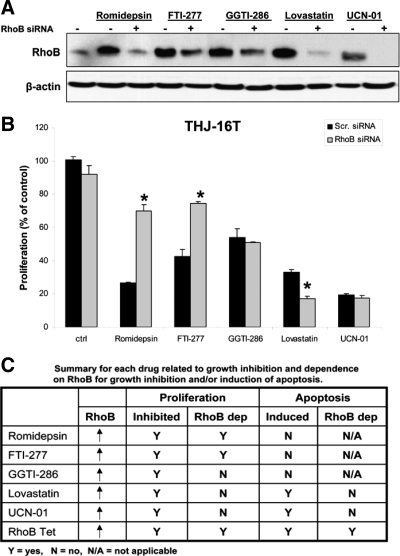
We next examined the ability of five classes of drugs to induce RhoB. Romidepsin [3-hydroxy-3-methyl-glutaryl-CoA (HMG CoA) reductase inhibitor], FTI-277 (farnesyl transferase inhibitor), GGTI-286 (geranylgeranyl transferase inhibitor), lovastatin (histone deacetylase inhibitor), and UCN-01 (CHK1 inhibitor) up-regulated RhoB in all four ATC cell lines (Fig. 4A). This appears to be a transcriptional event because all drugs up-regulated RhoB mRNA levels in THJ-16T cells (Fig. 4B). We next demonstrated a dose-responsive inhibition of growth and established an IC50 for each drug and cell line (Fig. 5A). Because THJ-16T cells were the most aggressive cell line (Fig. 2), they were used to examine apoptosis and RhoB dependence. Only lovastatin and UCN-01 treatment resulted in significant induction of apoptosis compared with control vehicle-treated THJ-16T cells (Fig. 5B). This was confirmed by Western analysis of poly ADP ribose polymerase (PARP) and caspase cleavage in THJ-16T cells treated with either lovastatin or UCN-01 (Fig. 5C). Using siRNA against RhoB to block protein expression after drug treatment resulted in silencing of RhoB protein (Fig. 6A). Performing proliferation assays in THJ-16T cells using similar conditions for silencing RhoB demonstrated that only romidepsin and FTI-277 are dependent upon up-regulated RhoB for growth inhibition (Fig. 6B). Figure 6C summarizes the dependencies between the various drugs and RhoB.
Figure 4.
Five drug classes up-regulate RhoB in ATC cell lines. A, Cells were treated with indicated drug concentration for 24 h and protein lysates prepared for Western analysis of RhoB. Western analysis of ATC cells verified that RhoB expression was up-regulated in all treated cells. B, A representative graph using THJ-16T for real time PCR shows RhoB is regulated transcriptionally after 24 h of treatment. Real-time PCR was performed as described in Materials and Methods.
Figure 5.
Five drug classes dose-responsively inhibit cell proliferation in ATC cell lines, but only two induce apoptosis in THJ-16T ATC cell line. A, Cells were treated with the indicated dose of drug and cell number counted 4 d after treatment. Five different classes of drugs demonstrated dose-dependent inhibition of growth in all ATC cell lines. IC50 values are as shown for each drug. B, THJ-16T cells were treated with the indicated dose of drug for 48 h, followed by propidium iodide (PI) staining and flow cytometry analysis. Lovastatin and UCN-01 demonstrated significant induction of cell death (stained), whereas other treatments were similar to controls. Data are plotted as SSC-A (side scatter for cell density) vs. FL2-A (PI fluorescence). C, Western analysis of cleaved PARP and cleaved caspase 3 demonstrated that lovastatin and UCN-01 induce apoptosis in THJ-16T cells treated for 48 h whereas romidepsin, FTI-277, and GGTI-268 do not induce apoptosis. β-Actin is used as a loading control. All experiments were performed in triplicate.
Figure 6.
Romidepsin and FTI-277 mediate RhoB-dependent growth inhibition, but GGTI-286, lovastatin, and UCN-01 do not. A, Western analysis of THJ-16T cells verified that RhoB expression was silenced in the presence of RhoB siRNA and drug treatment. Cells were transiently transfected as previously described and then treated with 1 nm romidepsin, 10 μm FTI-277, 10 μm GGTI-286, 10 μm lovastatin, or 500 nm UCN-01 for 24 h. B, Silencing RhoB (siRNA) blocked romidepsin, and FTI-277 mediated inhibition of cell proliferation in THJ-16T cells. This was not true for GGTI-286, lovastatin, or UCN-01. Assay was carried out for 4 d and plotted as percentage of control + sd. *, P < 0.05 when compared with RhoB siRNA control or to scrambled siRNA with romidepsin or FTI-277. C, A summary is presented for each drug for growth inhibition, apoptosis, and RhoB dependence.
Discussion
The recent recognition of misidentified thyroid cancer cell lines (5) highlights the importance of tracing cell line origin to the originating tumor tissue so that cell line fidelity is comparable to the characteristics of the originating tumor. We have developed and performed comprehensive genomic, molecular, and phenotypic characterization in each of the histological subtypes of ATC. This is the first set of thyroid cancer cell lines that can be traced to the tissue of origin and that contains the gamut of known ATC mutations. It is important to track genotypic/molecular changes that occur in the cell line over time with passage of cells because multiple versions (altered genotype/phenotype) of the same cell line grown in the same or different laboratories evolve as a result of an unstable genome and clonal selection due to different passage pressures (e.g. cell density, media conditions). An example of this is estrogen receptor-positive and estrogen growth-stimulated MCF-7 cells where cell lines exist that are nonresponsive or partially responsive to estrogen (10). Comprehensive genetic analysis allows both for unique identification of a tumor cell line and for monitoring genetic drift over time, thus permitting researchers to focus upon individualized approaches to examine key players in malignant progression. It also allows improved comparability among different studies. For the first time, it may allow standardization of experiments between laboratories, or if different culture conditions are used, it should be possible to estimate how much of the variance between experiments might be attributable to experimental set-up.
Thus, it appears appropriate to suggest a new standard to ensure proper identity of a cell line used in published articles. We propose that at a minimum a cell line’s origin should be validated by comparative STR analysis of originating tissue and cell line. Next, morphotype-associated mutations should be characterized. In the case of ATC cell lines, BRAF, TP53, RB, RAS, RET/PTCx, PI3KCA, and PAX8/PPARγ are appropriate targets. Because ATC is an undifferentiated tumor and because the loss of expression of thyroid-specific genes might modulate response to treatments from radioiodide to chemotherapy, the expression levels of the transcriptional factors, Pax8 and TTF1, should be determined because they regulate TSHR, NIS, PDS, TPO and TG. Our new THJ-11T cell line expresses TSHR mRNA (Fig. 2C), but the protein is not correctly targeted to the cell membrane as seen by immunocytochemistry (Supplemental Fig. 2). Oncogenic proteins such as β-catenin, cyclin D1, survivin, and Bcl2 are expressed at different levels in each cell line, again another useful characterization for scientists interested in comparing and contrasting these signaling pathways. We have also performed array CGH analysis on the original tumor tissue and cell lines, which shows similar patterns of gains and losses. We have listed some of the amplifications and deletions unique to each cell line when compared between these four ATCs. Interestingly, genes within regions of gain of several cell lines include the growth factor gene, PDGFA (THJ-11T), the growth factor receptor PDGFRA (THJ-29T), and the oncogene KIT (THJ-29T).
Following up on our previous identification of RhoB as a therapeutic target (2), we used our four new ATC cell lines to validate that the histone deacetylase inhibitor, romidepsin, inhibited cell proliferation in a dose-dependent manner and up-regulated RhoB regardless of mutational status (Figs. 4 and 5). These findings were extended to four other classes of drugs that include FTI-277 (farnesyl transferase inhibitor), GGTI-286 (geranylgeranyl transferase inhibitor), lovastatin (HMG CoA reductase inhibitor), and UCN-01 (CHK1 inhibitor). Response to romidepsin was relatively the same for all cell lines except for cells with a BRAF mutation (THJ-21T). Cells that were both p53 and Rb mutant (THJ-16T and THJ-21T) were less responsive to FTI-277 treatments. As expected, cells that were p53 wild-type (THJ-11T, THJ-29T) were more sensitive to UCN-01 treatments.
Moreover, silencing RhoB leads to loss of growth inhibitory activity by romidepsin and FTI-277 in THJ-16T cells. The growth inhibitory activities of GGTI, lovastatin, and UCN-01 were not dependent upon RhoB up-regulation, indicating that other mechanisms are involved in growth inhibitory or apoptotic activity of lovastatin and UCN-01. These two compounds induced apoptosis similar to that of the cells engineered to up-regulate RhoB when treated with tetracycline. Lovastatin, an HMG CoA reductase inhibitor, has been previously shown to promote apoptosis and differentiation (11,12) and invasion (13) in ARO cells, which are now of questionable cellular origin (5). The mechanism was thought to be via inhibition of RhoA geranylgeranylation, which in turn suppressed Rho/ROCK and FAK/paxillin signaling (13). UCN-01 (7-hydroxystaurosporine) is a protein kinase C as well as a CHK1 inhibitor and is being developed as a novel anticancer agent (14,15,16). It has been shown to induce varying degrees of apoptosis, which is inversely proportional to Bcl-2 expression in four thyroid cancer cell lines—FRO, KAT5, NPA, and WRO (17). Identity issues with NPA87 and KAT5 cell lines used in that study were noted by Schweppe et al. (5).
In conclusion, we have developed four new comprehensively molecularly characterized and tissue of origin-matched ATC cell lines, and we propose a minimum standard for cell line identity, based on STR analysis and oncogene mutational status. In such well-characterized ATC cell lines, we were able to show with confidence that tetracycline-inducible RhoB leads to induction of apoptosis-mediated cell death. We further identify five classes of drugs that up-regulate RhoB protein and inhibit cell proliferation in all four cell lines in a dose-responsive fashion, but which are not all entirely dependent on RhoB for their tumoricidal effects, suggesting that combining RhoB-targeted drugs with other drugs may lead to antitumor synergy (2).
Supplementary Material
Acknowledgments
We thank Brandy Edenfield for embedding the ATC tissues and staining them for H&E.
Footnotes
This work was funded in part from National Institutes of Health (NIH) Grant P30CA15083 (Cancer Center Support Grant, to R.C.S.), the Mayo Clinic Research Committee (to R.C.S.), Bankhead-Coley Cancer Research Program, Florida Department of Health (to J.A.C. and R.C.S.), NIH Grant R01CA136665 (to J.A.C. and R.C.S.), and a grant for rare cancers from Dr. Ellis and Dona Brunton (to J.A.C.).
Current address for J.T.W.: Department of Otolaryngology–Head and Neck Surgery, Emory University, 1365a Clifton Road NE, Atlanta, Georgia 30322.
Disclosure Summary: R.C.S. (Principal Investigator) received grant support for a clinical trial with Daiichi Sankyo Inc. (1/11/2008—12/31/2009). J.A.C. (Principal Investigator) received grant support from Daiichi Sankyo Inc. (6/1/2009—5/31/2010). The remaining authors have nothing to disclose.
First Published Online September 1, 2010
Abbreviations: ATC, Anaplastic thyroid carcinoma; CGH, comparative genomic hybridization; GAPDH, glyceraldehyde-3-phosphate-dehydrogenase; HMG CoA reductase, 3-hydroxy-3-methyl-glutaryl-CoA reductase; PARP, poly ADP ribose polymerase; PI3KCA, phosphatidylinositol 3-kinase; siRNA, small interfering RNA; STR, short tandem repeat.
References
- Smallridge RC, Marlow LA, Copland JA 2009 Anaplastic thyroid cancer: molecular pathogenesis and emerging therapies. Endocr Relat Cancer 16:17–44 [DOI] [PMC free article] [PubMed] [Google Scholar]
- Marlow LA, Reynolds LA, Cleland AS, Cooper SJ, Gumz ML, Kurakata S, Fujiwara K, Zhang Y, Sebo T, Grant C, McIver B, Wadsworth JT, Radisky DC, Smallridge RC, Copland JA 2009 Reactivation of suppressed RhoB is a critical step for the inhibition of anaplastic thyroid cancer growth. Cancer Res 69:1536–1544 [DOI] [PMC free article] [PubMed] [Google Scholar]
- Prendergast GC 2001 Actin’ up: RhoB in cancer and apoptosis. Nat Rev Cancer 1:162–168 [DOI] [PubMed] [Google Scholar]
- Alston-Roberts C, Barallon R, Bauer S, Butler J, Capes-Davis A, Dirks W, Elmore E; American Type Culture Collection Standards Development Organization Workgroup ASN-0002 2010 Cell line misidentification: the beginning of the end. Nat Rev Cancer 10:441–448 [DOI] [PubMed] [Google Scholar]
- Schweppe RE, Klopper JP, Korch C, Pugazhenthi U, Benezra M, Knauf JA, Fagin JA, Marlow LA, Copland JA, Smallridge RC, Haugen BR 2008 Deoxyribonucleic acid profiling analysis of 40 human thyroid cancer cell lines reveals cross-contamination resulting in cell line redundancy and misidentification. J Clin Endocrinol Metab 93:4331–4341 [DOI] [PMC free article] [PubMed] [Google Scholar]
- Kurebayashi J, Okubo S, Yamamoto Y, Ikeda M, Tanaka K, Otsuki T, Sonoo H 2006 Additive antitumor effects of gefitinib and imatinib on anaplastic thyroid cancer cells. Cancer Chemother Pharmacol 58:460–470 [DOI] [PubMed] [Google Scholar]
- Livak KJ, Schmittgen TD 2001 Analysis of relative gene expression data using real-time quantitative PCR and the 2-[Δ][Δ]CT method. Methods 25:402–408 [DOI] [PubMed] [Google Scholar]
- García-Rostán G, Costa AM, Pereira-Castro I, Salvatore G, Hernandez R, Hermsem MJ, Herrero A, Fusco A, Cameselle-Teijeiro J, Santoro M 2005 Mutation of the PIK3CA gene in anaplastic thyroid cancer. Cancer Res 65:10199–10207 [DOI] [PubMed] [Google Scholar]
- Cradic KW, Milosevic D, Rosenberg AM, Erickson LA, McIver B, Grebe SK 2009 Mutant BRAFT1799A can be detected in the blood of papillary thyroid carcinoma patients and correlates with disease status. J Clin Endocrinol Metab 94:5001–5009 [DOI] [PubMed] [Google Scholar]
- Hamelers IH, Van Schaik RF, Sussenbach JS, Steenbergh PH 2003 17β-Estradiol responsiveness of MCF-7 laboratory strains is dependent on an autocrine signal activating the IGF type I receptor. Cancer Cell Int 3:10 [DOI] [PMC free article] [PubMed] [Google Scholar]
- Wang CY, Zhong WB, Chang TC, Lai SM, Tsai YF 2003 Lovastatin, a 3-hydroxy-3-methylglutaryl coenzyme A reductase inhibitor, induces apoptosis and differentiation in human anaplastic thyroid carcinoma cells. J Clin Endocrinol Metab 88:3021–3026 [DOI] [PubMed] [Google Scholar]
- Zhong WB, Wang CY, Chang TC, Lee WS 2003 Lovastatin induces apoptosis of anaplastic thyroid cancer cells via inhibition of protein geranylgeranylation and de novo protein synthesis. Endocrinology 144:3852–3859 [DOI] [PubMed] [Google Scholar]
- Zhong WB, Liang YC, Wang CY, Chang TC, Lee WS 2005 Lovastatin suppresses invasiveness of anaplastic thyroid cancer cells by inhibiting Rho geranylgeranylation and RhoA/ROCK signaling. Endocr Relat Cancer 12:615–629 [DOI] [PubMed] [Google Scholar]
- Reinhardt HC, Aslanian AS, Lees JA, Yaffe MB 2007 p53-Deficient cells rely on ATM- and ATR-mediated checkpoint signaling through the p38MAPK/MK2 pathway for survival after DNA damage. Cancer Cell 11:175–189 [DOI] [PMC free article] [PubMed] [Google Scholar]
- Facchinetti MM, De Siervi A, Toskos D, Senderowicz AM 2004 UCN-01-induced cell cycle arrest requires the transcriptional induction of p21waf1/cip1 by activation of mitogen-activated protein/extracellular signal-regulated kinase kinase/extracellular signal- regulated kinase pathway. Cancer Res 64:3629–3637 [DOI] [PubMed] [Google Scholar]
- Lapenna S, Giordano A 2009 Cell cycle kinases as therapeutic targets for cancer. Nat Rev Drug Discov 8:547–566 [DOI] [PubMed] [Google Scholar]
- Wang SH, Phelps E, Utsugi S, Baker Jr JR 2001 Susceptibility of thyroid cancer cells to 7-hydroxystaurosporine-induced apoptosis correlates with Bcl-2 protein level. Thyroid 11:725–731 [DOI] [PubMed] [Google Scholar]
Associated Data
This section collects any data citations, data availability statements, or supplementary materials included in this article.


