

Abstract
The positioning of DNA on nucleosomes is critical to both the organization and expression of the genetic message. Here we focus on DNA conformational signals found in the growing library of known high-resolution core-particle structures and the ways in which these features may contribute to the positioning of nucleosomes on specific DNA sequences. We survey the chemical composition of the protein-DNA assemblies and extract features along the DNA superhelical pathway — the minor-groove width and the deformations of successive base pairs — determined with reasonable accuracy in the structures. We also examine the extent to which the various nucleosome core-particle structures accommodate the observed settings of the crystallized sequences and the known positioning of the high-affinity synthetic ‘601’ sequence on DNA. We ‘thread’ these sequences on the different structural templates and estimate the cost of each setting with knowledge-based potentials that reflects the conformational properties of the DNA base-pair steps in other high-resolution protein-bound complexes.
Keywords: DNA deformation, minor-groove width, nucleosome positioning, sequence threading
Introduction
The positioning of DNA on nucleosomes — roughly 150 base pairs tightly wrapped in a superhelical pathway around a core of eight histone proteins— contributes to both the global organization and biological processing of the long, threadlike molecule. The precise sites of nucleosome binding not only determine the overall compaction of DNA but also govern the access of proteins and other species in the immediate chemical environment to the encoded genetic information. The latter molecules can take advantage of the ready accessibility of exposed nucleotides on the outer surface of the nucleosome or, alternatively, compete with the histones for access to the nucleotides at the DNA-protein interface. Thus, nucleosomes may function as general activators and repressors of genetic expression (1). Unraveling the principles and factors that determine where and how nucleosomes are positioned on DNA is accordingly one of the most important areas of current biology.
The preferential binding of nucleosomes to specific DNA ‘positioning’ sequences hints of the role of individual nucleotides in the binding process. Because the close contacts between the histones and DNA in known high-resolution structures (2-21) are almost exclusively nonspecific, involving the cationic amino-acid side-groups of protein and the negatively charged sugar-phosphate backbone on DNA, enhanced binding of the histone assembly to specific sequences points to an indirect response in DNA related to the intrinsic structure and/or deformability of the constituent nucleotides.
The tight superhelical fold of DNA found in the best-resolved nucleosome core-particle structures reflects both sharp periodic bending and concomitant lateral shearing of individual dinucleotide steps. Specifically, the local kinks, effected primarily by the so-called roll angle (22) about the long axes of successive base pairs, dictate the curvature, and the shearing, typically accomplished via the slide displacement (22) along the same local axes, control the DNA superhelical pitch (23). The cost of deforming a given nucleotide sequence into such an arrangement presumably contributes to the ease of binding the histone octamer.
The sites and modes of nucleosomal DNA deformation depend upon a number of factors, including not only the nucleotide sequence but also the histone composition and the presence of competing ligands. For example, the energetically costly DNA ‘kink-and-slide’ steps found in two of the best-resolved nucleosome core-particle structures occur at different sites that seemingly accommodate the shuffling of the easily deformed nucleotide steps in the different bound sequences (24). On the other hand, some of the extreme kink-and-slide steps found in the native nucleosomal structure disappear in complexes assembled from the same DNA and histones with site-specific modifications (25).
Here, as a next step toward understanding the physical basis of nucleosome positioning on DNA, we survey the settings and deformations of the double-helical molecule in the currently known high-resolution nucleosome core-particle structures. We first review the chemical make-up and structural uncertainties of these complexes. We next extract the rotational settings of the DNA on the different histone cores from the variation in the double-helical groove widths. We then compare the deformations of DNA in the various structures, ‘threading’ a common generic sequence on the different structural templates and estimating the energy with a knowledge-based elastic function that reflects the conformational properties of the DNA base-pair steps in other high-resolution protein-bound structures. We also catalog the sites of extreme kink-and-slide distortions and the various pathways taken to generate the overall superhelical fold of nucleosomal DNA. Finally, we use sequence-dependent elastic functions (24,26) to examine the extent to which the various nucleosome core-particle structures account for the observed settings of the crystallized sequences and the known positioning of the high-affinity synthetic ‘601’ sequence (27) on DNA. We conclude with a discussion of the effects of nucleotide sequence on the folding of nucleosomal DNA and the ways in which these subtle differences in structure may contribute to known biochemical properties of nucleosome-bound DNA.
Methods
Data collection
The coordinates of nucleosome core-particle structures were extracted from the Nucleic Acid Database (28), and the local conformational parameters of DNA determined with the 3DNA suite of programs (29,30). The automated base-pairing assignments, made with the latter software, were compared against the expected identities of complementary residues and apparent errors in the positions of individual atoms were corrected. For example, the respective interchange of cytosine C2 and N3 with C6 and C5 and concomitant repositioning of O2 converts the noncanonical C·G pairs found in a few structures (files labeled 1s32, 1zla, and 2nqz in Table 1— where cytosine 3 adopts the conformationally unlikely syn glycosyl form) to the desired Watson-Crick arrangements. Correct base pairing is needed to obtain reliable values of the six rigid-body parameters — the three angular variables (Tilt, Roll, Twist) and the three variables (Shift, Slide, Rise) with dimensions of distance (22) — that characterize the spatial arrangements of successive base pairs. The groove widths are based on the refined formulation of El Hassan and Calladine (31), incorporated in the 3DNA software, which determines the identities of and distances between the phosphorus atoms in closest cross-strand contact. Step parameters and groove widths provide the most reliable measures of the deformation of DNA in the various molecular assemblies, given that the positions of the phosphorus atoms and the electron densities of the bases are clear in even the most poorly resolved nucleosome structures.
Table 1. Nucleosome core-particle structures.
| NDB_ID† | PDB_ID† | Histone content | DNA (bp) |
Ligands | Res. (Å) |
Ref. |
|---|---|---|---|---|---|---|
| PD0209 | 1id3 | Saccharomyces cerevisiae | 146 | 3.1 | (6) | |
| PD0914 | 2nqb | Drosophilia melanogaster | 146 | 2.3 | (20) | |
| PD1003 | 2pyo | Drosophilia melanogaster | 147 | 2.45 | (16) | |
| PD0913 | 2nzd | Xenopus laevis | 145 | 2.65 | (17) | |
| PD0001 | 1aoi | Xenopus laevis | 146 | 2.8 | (2) | |
| PD0285 | 1kx3 | Xenopus laevis | 146 | 2.0 | (7) | |
| PD0286 | 1kx4 | Xenopus laevis | 146 | 2.6 | (7) | |
| PD0287 | 1kx5 | Xenopus laevis | 147 | 1.94 | (7) | |
| PD0755 | 2fj7 | Xenopus laevis | 147 | 3.0 | (13) | |
| PD0137 | 1eqz | Gallus gallus | 146 | 2.5 | (4) | |
| PD0676 | 2cv5 | Homo sapiens | 146 | 2.5 | (12) | |
| PD0171 | 1f66 | Homo sapiens (H2AZ); Xenopus laevis (H2B, H3); Mus musculus (H4) | 146 | 2.6 | (5) | |
| PD0413 | 1p34 | Xenopus laevis (H3 R116A) SIN mutant | 146 | 2.7 | (10) | |
| PD0414 | 1p3a | Xenopus laevis (H3 R116H) SIN mutant | 146 | 3.0 | (10) | |
| PD0419 | 1p3k | Xenopus laevis (H3 T118A) SIN mutant | 146 | 2.9 | (10) | |
| PD0420 | 1p3l | Xenopus laevis (H3 T118H) SIN mutant | 146 | 2.4 | (10) | |
| PD0421 | 1p3m | Xenopus laevis (H3 T118I) SIN mutant | 146 | 2.9 | (10) | |
| PD0415 | 1p3b | Xenopus laevis (H4 R45A) SIN mutant | 146 | 3.0 | (10) | |
| PD0416 | 1p3f | Xenopus laevis (H4 R45C) SIN mutant | 146 | 2.9 | (10) | |
| PD0417 | 1p3g | Xenopus laevis (H4 R45E) SIN mutant | 146 | 2.7 | (10) | |
| PD0418 | 1p3i | Xenopus laevis (H4 R45H) SIN mutant | 146 | 2.3 | (10) | |
| PD0422 | 1p3o | Xenopus laevis (H4 V43A) SIN mutant | 146 | 2.75 | (10) | |
| PD0423 | 1p3p | Xenopus laevis (H4 V43I) SIN mutant | 146 | 2.7 | (10) | |
| PD0566 | 1u35 |
Homo sapiens (macroH2A-HD) Mus musculus (H2B, H3, H4) |
146 | 3.0 | (11) | |
| PD0764 | 2f8n |
Mus musculus (H2A, H2ba) Homo sapiens (macroH2A) Xenopus laevis (H2B.1, H3, H4) |
146 | 2.9 | (15) | |
| PD1077 | 3c1b |
Xenopus laevis (H2A, H3, H4 Me3-K20) Xenopus (silurana) tropicalis (H2B) |
146 | 2.2 | (18) | |
| PD1078 | 3c1c |
Xenopus laevis (H2A, H3 Me2-K79, H4) Xenopus (silurana) tropicalis (H2B) |
146 | 3.15 | (18) | |
| PD0328 | 1m18 | Xenopus laevis | 146 | ImPyImPy-γ-PyPyPyPy-β-Dp | 2.45 | (8) |
| PD0329 | 1m19 | Xenopus laevis | 146 | ImPyPyPy-γ-PyPyPyPy-β-Dp | 2.3 | (8) |
| PD0330 | 1m1a | Xenopus laevis | 146 | ImImPyPy-γ-PyPyPyPy-β-Dp | 2.65 | (8) |
| PD0514 | 1s32 | Xenopus laevis | 146 | PyIm hairpin polyamide | 2.05 | (9) |
| PD0668 | 1zla |
Xenopus-like vector (H2A) Xenopus laevis (H2B, H3, H4) |
146 | KSHV latency-associated nuclear antigen 23-aa peptide fragment | 2.9 | (14) |
| PD1046 | 3b6f | Xenopus laevis | 147 | cisplatin | 3.45 | (19) |
| PD1047 | 3b6g | Xenopus laevis | 147 | oxaliplatin | 3.45 | (19) |
| NA0384 | 3kuy | Xenopus laevis | 145 | N-(2,3-epoxypropyl)-1,8-naphthalimide | 2.9 | (21) |
DNA deformations
The deformation of DNA on a given nucleosome is measured by threading a sequence of base pairs on the three-dimensional pathway found in the core-particle structure and calculating a deformation score in terms of the deviations of the base-pair step parameters that make up the structure from their preferred equilibrium values.
The score E determined at the dimeric level is series of elastic terms involving all pairwise combinations of step parameters,
| [1] |
Here is the deviation imposed by the nucleosomal template on one of the six step parameter θi (i = 1-6) from the equilibrium rest state characteristic of the MN dimer, and the fij (MN) are stiffness constants associated with that dimer (26). The values of are the average values of the base-pair-step parameters in a large data set of protein-bound DNA molecules (other than nucleosomes) (24,26), and the fij (MN) are extracted from the pairwise covariance of these data. The step parameter identities i = 1, 6 correspond respectively to Shift, Slide, Rise, Tilt, Roll, Twist. The elastic parameters for a generic homopolymeric step are based on equal weighting of the force constants and rest states of the 16 common dimers. Simulations of polymers based on these mean parameters account approximately for the persistence length of mixed-sequence DNA (32).
The total deformation score U of a given sequence threaded on a chosen nucleosome template is taken as the sum of the E values associated with the constituent base-pair steps. The number of such steps depends upon the choice of template, e.g., 146 steps on a nucleosome like the currently best-resolved core-particle structure (1kx5), which bind 147 base pairs.
Data representation
Color-coded images of the conformational and energetic parameters that characterize the set of nucleosome structures are generated with an original program that converts a given range of numerical values into various shades of blue, white, and red based upon the magnitude of the parameter at a given site on DNA or for a specific template setting. Values that lie outside the specified range are assigned the colors at the edges of the assigned ranges. Color-coding of nucleotides in DNA sequences conforms to the Nucleic Acid Database standard (28): adenine (red); thymine (blue); guanine (green); cytosine (yellow). Data are positioned to maximize the alignment of base sequence or patterns in numerical data. Missing bases and shifted data points are denoted by black squares. The composite images highlight general conformational trends across different nucleosome structures and at specific sites along the histone-bound DNA while concomitantly providing a detailed picture of a given quantity at individual steps within a given structure.
Results
Chemical composition
The 35 currently solved nucleosome core-particle structures fall into three categories (Table 1). The first group includes 11 complexes of 145-147-bp DNA wrapped around the major histone-core proteins from five widely ranging organisms: Saccharomyces cerevisiae, Drosophilia melanogaster, Xenopus laevis, Gallus gallus, and Homo sapiens. The differences among these structures stem primarily from the variation in histone amino-acid sequence (33), given that all but two of the structures share essentially the same A+T-rich human α-satellite DNA sequence (Figure 1). One of the latter core particles binds an α-satellite sequence of similar base-pair content but with different bases at roughly half of the nucleotide positions (1kx4) and the other contains a 16-bp poly(dA·dT) element (2fj7). The DNA in four of the nucleosome structures (1eqz, 1id3, 2nqb) contains “symmetric” T→G and A→C point mutations at positions −4 and +3 relative to the structural dyad found on base pair 0. The missing base pairs in the complexes binding a 145-bp duplex (2nzd) lie one step closer to the structural dyad, i.e., at what would be base pairs −3 and +2 in the related 147-bp fragments. The missing nucleotide in the structures binding 146-bp duplexes lies at position −4 or −3 with respect to the central base pair of the related 147-mers. Three of the structures in this category (1kx5, 1nzd, 2pyo) include an interchange of the A and T at positions ±53.
Figure 1.

Color-coded representation of the DNA sequences crystallized in known nucleosome core-particle structures (2-20). The Protein Data Bank identifiers (PDB_IDs) of individual structures are noted on the left in the same order as in Table 1, with the entry for the currently best-resolved structure (1kx5) highlighted by triangles. Nucleotide positions are reported with respect to the central base pairs of the crystallized 147-bp sequences at position 0. The small numerals above the mosaic denote the base-pair position, and the large numerals above the canonical B-DNA structure show the superhelical position, i.e., the approximate number of helical turns of a given base pair from the dyad (2). The double-helical image shows the relative orientation of the base pairs and the directions of the major/minor grooves at each sequential position — e.g., the long axis of the base-pair points toward the viewer, the major groove faces downward, and the minor groove faces upward at the dyad and all other integral superhelical positions. Nucleotide content in individual structures is depicted on the right with the same color-coding as that along individual sequences. The ‘missing’ bases in nucleosomes that bind 145- and 146-bp DNA fragments are represented in black and positioned to maximize the alignment of the sequences with the bases in the 147-bp chains. Overrepresented dinucleotide steps include AA·TT, AT·AT, and CA·TG. Underrepresented dimers include CG·CG, AC·GT, TA·TA, and GG·CC. Image does not include the bases in the most recently solved core-particle structure (21), with DNA identical in sequence to that in the one other nucleosome binding a 145-bp piece of DNA (17). See Table 1 for details of nucleosome composition and resolution.
The second group of 16 nucleosome structures incorporates a number of biologically relevant histone modifications, including (i) the natural H2AZ variant (1f66) associated with actively transcribed chromatin (34), (ii) nucleosomes (1u35, 2f8n) with one or two copies of the macroH2A variant implicated in the formation of transcriptionally silent heterochromatin (35,36), (iii) a series of so-called SIN point mutations of histones H3 and H4 (1p3a, 1p3f, 1p3i, 1p3k, 1p3p) that relieve the requirement of the SWI/SNF nucleosome remodeling complex in yeast-screening experiments (37), and (iv) examples of H3- and H4-methylated species (3c1c, 3c1b) found respectively at active promoters (38) and in repressive chromatin (39). Many of these mutations occur in the context of an octameric core assembled from histones of different species. The SIN-mutant nucleosomes, with a histone core made up exclusively of Xenopus proteins, include six structural controls (1p34, 1p3b, 1p3g, 1p3i, 1p3k, 1p3o), i.e., alanine, glutamic acid, and histidine point mutations of H3 or H4, without biochemical characterization. Except for the macroH2A structures, which have a missing thymine (with no assigned coordinates) adjacent to the structural dyad, all of the mutated protein cores bind the same DNA.
The eight nucleosomes in the final group of structures bind additional molecules, including a series of synthetic polyamines (1m18, 1m19, 1m1a, 1s32), three anticancer drugs —cisplatin (3b6f), oxaliplatin (3b6g), and N-(2,3-epoxypropyl)-1,8-naphthalimide (ENA) (3kuy), and a 22-amino-acid N-terminal peptide fragment from the Kaposi sarcoma-associated herpes virus (KSHV) latency-associated nuclear antigen (1zla). Whereas the latter molecule associates with histones H2A and H2B on the DNA-free ends of the nucleosome, the remaining ligands bind in the grooves or intercalate between the bases of DNA. Other than the 1-2-bp differences in chain length and point-mutations noted above, the DNA is identical in all ligand-bound structures, and other than the sequence of the peptide-bound H2A, the histones are identical.
The quality of the available core-particle structures naturally varies with their resolution (1.94-3.45 Å). The poorer resolution of some complexes precludes assignment of many of the amino-acid atoms and, as noted above, a few of the base pairs. Only the best-resolved complex with a 147-bp DNA fragment bound to a core of Xenopus histones (1kx5), contains the complete structures of the histone proteins, including the ‘randomly coiled’ tails that extend outward from the complex. As expected from the limited number of bound DNA sequences, the nucleotide content of the available structures is biased. Of the 4933 identified base pairs, 2908 are A·T and 2024 G·C, i.e., a 59:41 ratio of A+T vs. G+C bases. As a result, many base-pair steps are over- or underrepresented in the structural dataset (see legend to Figure 1).
Groove widths
The widths of the DNA grooves distinguish the inner from the outer surface of the nucleosome-bound duplex and provide an approximate measure of the rotational setting of the DNA on the protein core. That is, the grooves narrow when the inner surface of the DNA faces the histone core and widen when the DNA surface lies on the exterior of the complex. The sinusoidal variation of the minor-groove width with nucleotide position (Figure 2a) hints of the periodic deformation of DNA as it wraps around the histone assembly. A regular pattern of interstrand separation, with 14 local minima and 13 local maxima along the bound DNA, persists in almost all of the complexes (Figure 2b). The maximum in groove width around the dyad, however, disappears in the nucleosomes that bind platinum-containing anticancer drugs (3b6f, 3b6g) and two additional maxima appear in the nucleosome with the alternate α-satellite DNA sequence (1kx4).
Figure 2.
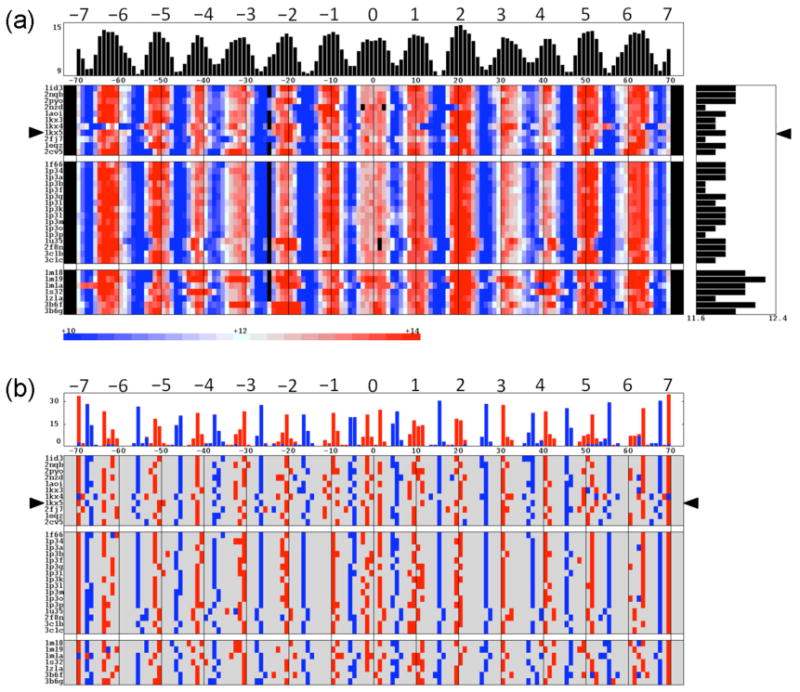
Sequential variation of (a) the DNA minor-groove width and (b) the sites of local maxima and minima in these values, i.e., points that distinguish the inner vs. outer surface of the bound DNA, in high-resolution nucleosome core-particle structures. The color-coded range in (a) corresponds to values within two standard deviation of the average minor-groove width, 12±2 Å, over all structures. Data are plotted with respect to base-pair position, with the conformational parameters of the dimer steps that incorporate a given base pair depicted by color-coded blocks on either side of the designated point. ‘Phantom’ dinucleotide steps are inserted in the 145- and 146-bp histone-bound DNAs to maximize the alignment of groove dimensions. The same alignment is used but not depicted in (b). Mean values and the number of (blue) maxima or (red) minima in groove width at particular locations along the dyad are respectively reported in the histograms at the top of the images. Mean values of minor-groove width in individual structures are plotted to the right in (a). Data are presented in the same order and with the same notation as in Figure 1 and Table 1.
The variation in minor-groove width is particularly sensitive to DNA chain length, nucleotide sequence, and ligand binding. For example, the deletions of the G·C base pairs that convert the 147-bp duplex bound to Xenopus histones to a 145-bp chain (1kx5 vs. 2nzd) drastically alters the groove structure, with large changes in the interstrand spacing and local rotational setting at DNA sites distant the positions of the omitted bases at ±3, e.g., more than a 3-Å widening of the minor groove and a 3-bp shift in the local rotation setting occur over a helical turn away from the deletion sites. Similarly, the asymmetry of nucleosomes that bind 146-bp DNA fragments changes the pattern of minor-groove widths compared to that found for related histone-bound 147-mers. Notably, the minor groove of the 146-bp duplexes realign in the vicinity of superhelical position −2.5, i.e., 2.5 helical turns preceding the dyad (2), a point roughly two helical turns away from the missing nucleotide in the base sequence. The introduction of a phantom base insert at the aforementioned site (blackened squares in Figure 2a) realigns the backbones of the 146-bp nucleosomal DNA against those of the 147-bp chains.
The insertion of an A-tract in the 147-mer also introduces long-range changes in the minor-groove width, including widening of the minor-groove at sites more than four helical turns away from the center of the repeating nucleotide stretch (1kx5 vs. 2fj7). The changes in groove width and shifts in rotational positioning are even more widespread in the nucleosomes binding different 146-bp α-satellite sequences (1kx3 vs. 1kx4). Moreover, the shifts in groove width alter the rotational setting and apparent helical repeat, with as much as a 3-bp different in the spacing between nucleotides on the inner surface of DNA (e.g., a 9- vs. 12-bp separation between the minima most distant from the structural dyad). Similar changes in apparent helical twist occur in the DNA wrapped on the surface of the human histone assembly (2cv5) and in nucleosomes containing the macroH2A variant (1u35, 2f8n). Point mutations of individual histones have no such effects on the nucleosomal DNA.
Although DNA-binding ligands substantially widen the minor groove, the presence of the KSHV peptide fragment to H2A·H2B does not (1zla). The increases in groove width induced by polyamides (1m18, 1m19, 1m1a, 1s32) and the anticancer drugs cisplatin and oxaliplatin (3b6f, 3b6g) occur on the outer surface of the DNA, enhancing the local maxima in minor-groove width by as much as 3 Å and perturbing the local rotational setting up to 3 bp. The ENA ligand seemingly takes advantage of the locally widened minor groove of the ligand-free 145-bp duplex (21), binding to the same site in the drug-nucleosome complex (2nzd vs. 3kuy).
The widths of the DNA grooves are long-range quantities determined by the precise spatial disposition of the intervening nucleotides (40). The 4728 values of minor-groove width collected here are strongly coupled to two of the rigid-body parameters associated with the same base-pair steps, namely Roll and Twist, with respective linear correlation coefficients of 0.60 and −0.43. Such values are statistically significant in samples of this size (41). The Roll and Twist at adjacent steps and the values of other step parameters, such as Slide and Rise, are also coupled, albeit less strongly, to the minor-groove width. Not surprisingly, the DNA can follow a number of very different conformational routes to attain the same overall structure (see below).
DNA deformations
The variability of DNA conformation in the known core-particle structures reveals itself in the deformation scores of generic mixed-sequence dimers constrained to adopt the folding patterns, i.e., rigid-body base-pair parameters, found in the different crystal structures (Figure 3a). These sequence-independent values pinpoint the sites of greatest DNA distortion as well as the relative cost of wrapping DNA around the different histone cores. The computed scores are roughly tied to crystallographic resolution, with the more poorly resolved structures generally scoring higher and the best-resolved structure having the lowest score. The most costly structural distortions occur in the DNA wrapped on the assembly of yeast histones (1id3). The deformation scores are also high, but less pronounced, in the nucleosomal DNA deformed by the presence of A-tracts (2fj7), cisplatin (3b6f), or oxaliplatin (3b6g) and in the complexes crystallized with macroH2A (1u35, 2f8n) or the H3 (Me)2K79 point mutation (3c1c).
Figure 3.
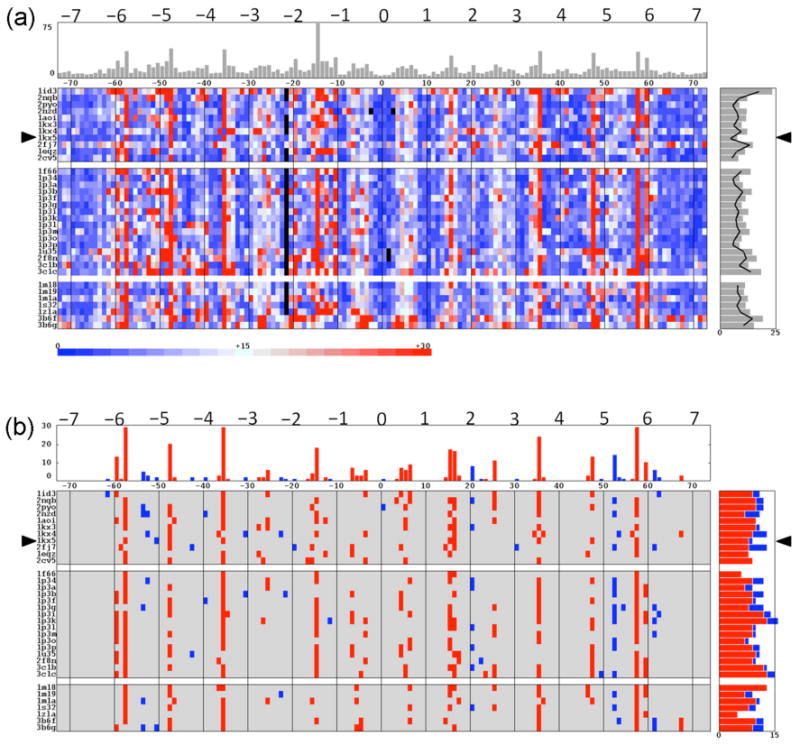
Deformation scores of (a) the base-pair steps of a generic mixed-sequence DNA threaded on the molecular pathways adopted in known nucleosome structures and (b) the sites of high-scoring kink-and-slide deformations (23) found therein. The color-coded range in (a) corresponds to energy values within one standard deviation of the average deformation score, 15±15, over all structures. Kink-and-slide states are grouped into two categories, A-like in blue and C-like in red, based upon the directions and magnitudes of local bending and shearing. Data are plotted, as in Figure 2, with respect to the structural dyad and with ‘phantom’ base-pair steps introduced to maximize the alignment of high and low scoring regions across all structures. The same alignment is used but not depicted in (b). Mean scores and number of kink-and-slide states at specific base-pair steps are respectively noted at the top of the images. Corresponding values in individual structures are plotted to the right of each image. The mean sequence-dependent deformation scores of the base-pair steps that make up each nucleosome are represented in (a) by the points on the right connected by a solid line. See text and legend to Figure 2 for numerical criteria and other details.
The asymmetry of DNA deformation stands out in the nucleosomes that bind 146-bp DNA fragments. The deformation score is especially costly in the vicinity of superhelical position −1.5, a point roughly midway between the ‘missing’ base pair in the 146-mer sequences and the site of double-helical structural realignment (see below). The differences in DNA conformation between this part of the core particle and its ‘symmetric’ counterpart on the opposite side of the structural dyad are well known (8), e.g., the root-mean-square deviations of corresponding atoms are higher at these sites than in any other parts of the 146-bp DNA (2).
The DNA deformation scores are more uniform in the two equal halves of the 147-bp structures, save for the nucleosomal sequence with the asymmetrically inserted A-tract (2fj7). Interestingly, the deformation score is higher in the half of the DNA without the A-tract. The most costly steps in the 147-bp structures occur at the same base-pair steps as those in the shorter (72-bp) first half of the 146-bp structures, but are one base pair out of phase from those in the longer (73-bp) second half of the 146-mers. The point of structural realignment lies slightly closer to the dyad, near superhelical position −2.2, than the alignment site associated with the minor-groove widths. The difference presumably reflects the local vs. long-range nature of the deformation score vs. the minor-groove width, i.e., the closest residues across the minor groove typically lie three base pairs away from the dimer step with which they are associated (31). Compared to the histone-bound 147-mer, there are two very costly kinks in the 145-bp DNA sequence crystallized with Xenopus proteins — one located near superhelical position −1.2, the other in the vicinity of position +1.6, and both accompanied by large increases in base-pair separation (Rise ≈ 5.2 Å) (2nzd vs. 1kx5). The binding of the ENA ligand (3kuy) moves one of these opened sites 5-bp closer to the structural dyad, allowing intercalation via the DNA major groove (21). Like the distortions in the 146-bp nucleosomal DNA, the distortions in the 145-bp structure lie quite far from the ‘missing’ base pairs.
Incorporation of sequence in the analysis of DNA deformations lowers the total scores by 25-40% (Figure 3a, points connected by black lines in side histogram). The deformation scores of a generic dimer are strongly coupled to and generally higher than the sequence-dependent scores of the base-pair steps (the linear correlation coefficient between the two scores for all 4932 nucleosomal steps is 0.98, with the generic score higher in 3802 cases). Both scores are closely coupled to the net dimeric shearing and bending, i.e., and , with respective correlation coefficients of 0.67 and 0.73 for the bending and 0.53 and 0.32 for the shearing.
Some of the most costly deformations of nucleosomal DNA combine sharp kinking and dislocation of the double-helical axis. These so-called ‘kink-and-slide’ steps (23), which contribute to the tight wrapping of DNA around the histone core, coincide roughly with the extremes in minor-groove width (compare Figures 2b and 3b). The deformations fall into two categories: the A-like steps that widen the minor-groove edges of the base-pair steps and the C-like steps that narrow these edges. If repeated at every step along the DNA, the A-like dimers would transform the canonical B-DNA helix toward the A helical form and similarly repeated C-like dimers would produce a C-like duplex (42). Here we take the A-type kink-and-slide steps as those with (Roll > +7°, Slide < −1 Å) and the C-like steps as those with (Roll < −7°, Slide > 1.5 Å). The C-type arrangements, which dominate the folding of nucleosomal DNA, lie in the vicinity of key arginine side groups on the surface of the histone assembly. The A-type states, which constitute ∼15% of the kink-and-slide steps in the nucleosomal structures, accumulate at intermediate sites on the DNA. Interestingly, the rotational positioning of the C-like steps differs in the middle vs. ends of the duplex, i.e., whereas the deformations associated with arginines from H2A-H2B are offset from the minima in average minor-groove width, the deformations linked to arginines on H3-H4 lie closer to the minima and this in a different rotational setting on the DNA.
The number of kink-and-slide steps depends upon nucleosome content. Only a few structures — including the H3 T118A mutant nucleosome (1p3k), the assembly containing the H3 (Me)2K79 point mutation (3c1c), and the complex with the ImPyImPy-γ-PyPyPyPy-β-Dp polyamide ligand (1m18) — have the full complement of C-like kink-and-slide steps and one structure, the nucleosomal assembly with A-tract DNA (1fj7), has five A-like kink-and-slide steps. The peptide-binding nucleosome (1s32) is seemingly the most smoothly deformed of the known core-particle structures with only five kink-and-slide steps. The deformation score of the latter structure, nevertheless, remains high. The latter structure contains many costly highly bent base-pair steps. The shearing of bases, however, is not as pronounced as that associated with the cutoff values chosen here.
DNA threading
The DNA deformation scores of all nucleosomes show the same sensitivity to sequence setting found previously for the best-resolved core-particle structure (1kx5) (23). That is, there is a noticeable minimum in the total deformation score when shortened fragments of the crystallized DNA sequence are threaded on the structural template. This minimum, which varies in magnitude among the different nucleosome structures, occurs in all cases when the DNA is in register with the natural (observed) setting of the sequence in each structure (Figure 4). The scores at the optimized positions follow directly from the average sequence-dependent deformation scores reported above.
Figure 4.
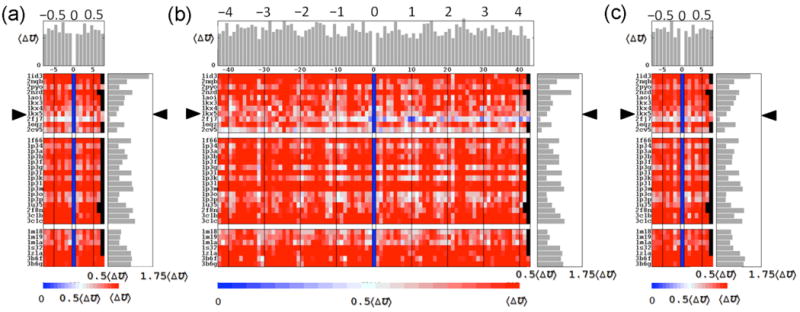
Cost of threading crystallized DNA sequences on the spatial pathway adopted in known nucleosome structures. The structural template in (a,c) is shortened to 130 base-pair steps by removing straight, 8-bp pieces from either end of the superhelical pathway. This allows for 15-17 different settings of the sequence fragment on the 145-147-bp structural templates. The template in (b) is reduced to the central 60-bp steps in contact with the (H3·H4)2 tetramer, with the number of characterized settings thereby increased to 85-87. The shift of one setting relative to the natural setting 0 is reported along the abscissa, and the identities of the structures are noted along the ordinate. The threading scores along the DNA pathway in the best-resolved nucleosome structure (1kx5) are highlighted by triangles. The total deformation scores of chain fragments are scaled with respect to the average deviation 〈ΔU〉 from the score of the minimum-energy setting in each structure. Mean scores of individual settings are reported in the histograms at the top of the images. Corresponding averages over all settings of a given template are plotted to the right of each image. Omitted settings are denoted in black. The ‘energies’ in (a,b) are based on elastic potentials recently derived from the rigid-body parameters relating successive base pairs in a non-redundant set of high-resolution protein-DNA crystal structures (24) and those in (c) with an earlier set of parameters extracted of necessity from a fewer crystal complexes without considerations of structural resolution or redundancy (26). See legend to Figure 2.
Here we report the deviations ΔU in the deformation scores for 130-bp fragments of each crystallized sequence with respect to the observed minima, e.g., the scores of the 17 possible settings of each 147-bp DNA on the central 130 base pairs of the crystallized template. The scores of the out-of-phase settings vary widely among the different structures (Figure 4a). For example, the DNA bound to the yeast histone core (1id3) stands out from other nucleosomal DNAs in having much higher scores for the out-of-phase settings compared to the optimized setting on that template. By contrast, the energy difference between the alternate and best settings of the nucleosomal DNA bearing an A-tract (2fj7) is much lower than that of all other nucleosomal DNAs. Indeed, some of the out-of-phase settings of the A-tract sequence become comparable in energy to that of the natural setting when the DNA is threaded on a shorter 60-bp scaffold involving the base-pair steps in direct contact with the (H3·H4)2 tetramer and thought to be critical to nucleosome positioning (43,44) (Figure 4b). The apparent enhancement of nucleosomal repositioning on the shortened template stems from the omission of many of the costly kink-and-slide steps at the ends of the full crystallographic structure. On the other hand, DNA constrained to the pathway adopted by the central 60 bp around the yeast histone assembly (1id3) retains a strong energetic preference for the observed crystallographic setting. DNA placed on the latter scaffold is much more strongly distorted in the vicinity of superhelical position −1.5, i.e., base-pair steps −15 to −16, than that constrained on other templates (Figure 3). The natural setting takes up the extreme deformation score more easily than any other placement of the sequence.
Importantly, the trends in relative deformation scores persist with other knowledge-based potentials, including that employed in previous work (23,26). The relative deformation scores of corresponding DNA fragments are virtually superimposable if scaled with respect to a common variable, such as the average relative deformation score 〈ΔU〉 over all nucleosomes (Figures 4a,c).
Prediction vs. observation
The 147-bp synthetic 601 construct (27), widely used to ‘set’ the positions of nucleosomes in experimental studies of chromatin properties and structure, provides a critical test of the predicted placement of nucleosomes on DNA. The observed, single-nucleotide resolution mapping of the sequence reflects the patterns of hydroxyl-radical footprinting on complementary strands (45), i.e., the identities of the nucleotides that are accessible to or protected from chemical attack. As noted previously (23), the predicted position is offset by 3-bp from the observed setting of a nucleosome on a 232-bp DNA containing the 601 sequence if the DNA is threaded on the 147-bp scaffold of the best-resolved core-particle structure (7). One of the secondary minima found when the same sequence is constrained to a smoothed conformational pathway reportedly coincides with the observed setting (45). The relative cost associated with DNA deformation on the primary minimum, which lies ∼50 bp closer to the 5′-end of the chain, is substantially lower than that on the secondary minimum noted in the work.
Here we report the sites of lowest energy found when the 232-bp test sequence is threaded on the DNA pathways in the different core-particle structures (Figure 5). The locations of the (red) energy minimum along each sequence are distinguished from those of the (blue) competing secondary minima, with relative DNA deformation scores less than a quarter of that of the mean value over all nucleosomes, i.e., ΔU < 0.25〈ΔU〉. Many of the crystalline pathways favor the positioning of the 601 fragment within 2-bp of the observed setting, located on base pair 134 of the test sequence, and a few have low energy minima that coincide with the experimental setting. The number of successfully predicted settings depends upon the choice of elastic parameters, with more positions matching the observed setting if the force field extracted over a decade ago from a smaller less carefully curated set of structures (26) is used (Figure 5b). The general trends in the prediction of likely nucleosome positions, however, are independent of the choice of elastic constants. For example, both force fields used here predict competing sites of nucleosome positioning centered as base pairs 109-110 and 140.
Figure 5.
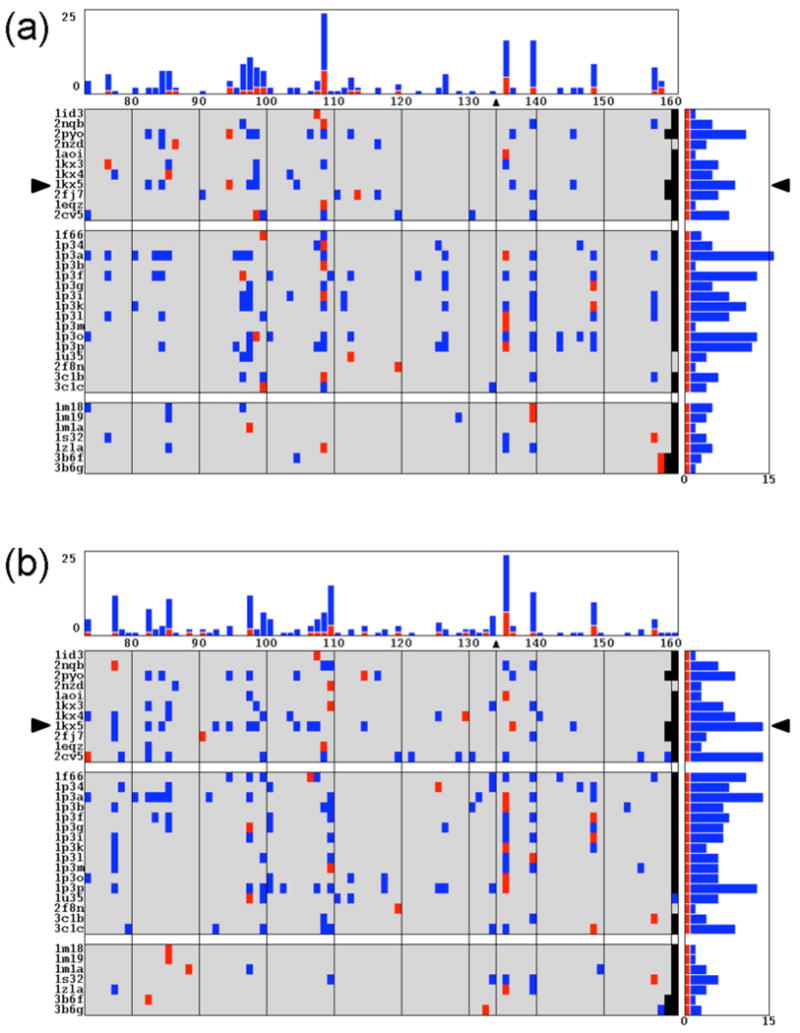
Profiles of the low-energy settings of a synthetic 232-bp fragment bearing the high-affinity 601 nucleosome-positioning sequence. Total deformation scores, obtained by threading the sequence on structural templates made up of the 145-147 bp of DNA in known crystal structures, are compared against the observed setting mapped with single-nucleotide resolution at base pair 134 (45). The 88-86 settings of the sequence are described along the abscissa by the identity of the base pair on the structural dyad, and the structural templates are listed along the ordinate. The experimentally observed setting is highlighted by a triangle at the top of the rectangular grid and enclosed by parallel lines. Color-coded entries distinguish the minimum-energy settings (red) and the settings of competing secondary minima (blue) found for each template. The number of low-energy states associated with each setting is reported in the histogram at the top of image, and the corresponding number found for a given structural template in the histogram on the right. The secondary minima are selected on the basis of the relative deformation score, with values less than 0.25〈ΔU〉. The ‘energies’ in (a) are computed with a recently reported set of elastic potentials (24) and those in (c) with an older set (26). See Figure 4 and the text for the definition of 〈ΔU〉 and other details.
The number of likely nucleosome positions depends upon the structural template. Interestingly, large numbers of predicted positions are found for the DNA pathways of four of the five biologically active SIN-mutant nucleosomes — H3 R116H, H4 V43I, H4 R45H, and H4 R45C (1p3a, 1p3p, 1p3i, 1p3f, respectively). The three-dimensional arrangements of successive base pairs preserve the overall folding of the histone-bound duplex while seemingly destabilizing any one nucleosome-binding position. Some of the structural controls used in the crystallographic analysis of the SIN-mutant nucleosomes also show this behavior (1p3k, 1p3o).
Discussion
Each newly reported high-resolution nucleosome crystal structure has reinforced the idea that DNA follows much the same superhelical pathway around the core of histone proteins in most biochemical settings. Now with 35 structures in the public domain (Table 1) and the capability to examine these structures collectively and in greater detail, one can begin to extract some of the subtle differences in DNA folding associated with the variation of histone composition, the presence of bound ligands, and the change of nucleotide sequence on the nucleosome.
Although the makeup of the DNA in the known structures is limited (Figure 1), the available data show that changes in base sequence can have dramatic effects on the rotational setting and degree of duplex deformation (Figures 2-3). Moreover, the effects of sequence on structure can be quite pronounced and far ranging, with costly deformations of structure occurring at sites on DNA a helical turn or more away from the sites of chemical modification. The rotational setting, as measured by the variation in the minor-groove width, can vary as much as three base pairs, thereby shifting the DNA residues in contact with protein in one structure by over 100° in another. The deformation scores of DNA threaded at corresponding base-pair steps on the different superhelical pathways can differ by 1-2 orders of magnitude.
Nucleosomal DNA can also take slightly different conformational routes in the course of its packaging. The sharp bending and concomitant shearing of successive base pairs found in all structures may occur at different sites, to a different degrees, and in different combinations. Thus the DNA in each crystal structure settles in a relatively favorable spatial arrangement (Figure 4). The stability of the observed fold compared to other settings of the sequence on the same template and the total cost of DNA deformation, however, can vary from one structure to the next. Thus, the different nucleosomal pathways accommodate the deformations of a common sequence, such as the 601-positioning sequence, in different ways (Figure 5). The DNA is folded in few structures such that one of the energetically favored forms lies within two base pairs of the experimentally observed position. A nucleosome that binds the 601 sequence may thus share some of the conformational features of these known structures.
The conformational features of DNA that stand out in individual nucleosome structures point to ways in which the nucleosomal scaffold might contribute to known biochemical behavior. For example, the very high cost of deforming DNA on the yeast histone assembly (1id3 in Figures 4-5) may contribute to the known instability of the yeast core particle. Similarly, the distortions of DNA that seemingly favor no one setting of the 601 positioning sequence over another on a SIN-mutant nucleosome scaffold (1p3a, 1p3f, 1p3i, 1p3p) suggest ways in which these histone point mutations might contribute to the rearrangement of nucleosomes in the absence of the yeast SWI/SNF remodeling complex. Thus, a protein-induced deformation that is costly to all dimer steps, such as bending via Tilt, might enhance nucleosomal translocation. Furthermore, given the relative deformation scores of DNA on the yeast vs. Xenopus nucleosomes (e.g., 1id3 vs. 1kx3) and the fact that the solved SIN-mutant nucleosome structures are constructs of Xenopus rather than yeast histones, the contributions of histone point mutations to DNA mobility in yeast may be even greater than that inferred here.
Clearly there are many gaps in our knowledge of nucleosomal structure and the relationship of the observed DNA superhelical folds to nucleotide sequence, histone composition, and nucleosome positioning. The solution of new high-resolution structures with a greater variety of bound DNA sequences is sorely needed for better understanding of the physical basis of nucleosome positioning
Acknowledgments
The authors would like to thank Dr. Jonathan Widom for sharing sequence information and the U.S. Public Health Service for generous support of the research under grants GM20861 and GM34809.
This research was reported in part by the authors at Albany 2009, The 16th Conversation (46).
Footnotes
This work was taken in part from the dissertation of Fei Xu written in partial fulfillment of the requirements for the degree of Doctor of Philosophy, Rutgers University, 2007.
References
- 1.Kornberg RD, Lorch Y. Cell. 1999;98:285–294. doi: 10.1016/s0092-8674(00)81958-3. [DOI] [PubMed] [Google Scholar]
- 2.Luger K, Mäder AW, Richmond RK, Sargent DF, Richmond TJ. Nature. 1997;389:251–260. doi: 10.1038/38444. [DOI] [PubMed] [Google Scholar]
- 3.Berman HM, Westbrook J, Feng Z, Gilliland G, B TN, Weissig H, Shindyalov IN, Bourne PE. Nucleic Acids Res. 2000;28:235–242. doi: 10.1093/nar/28.1.235. [DOI] [PMC free article] [PubMed] [Google Scholar]
- 4.Harp JM, Hanson BL, Timm DE, Bunick GJ. Acta Crystallographica Section D - Biological Crystallography. 2000;56:1513–1534. doi: 10.1107/s0907444900011847. [DOI] [PubMed] [Google Scholar]
- 5.Suto RK, Clarkson MJ, Tremethick DJ, Luger K. Nature Structural Biology. 2000;7:1121–1124. doi: 10.1038/81971. [DOI] [PubMed] [Google Scholar]
- 6.White CL, Suto RK, Luger K. EMBO J. 2001;20:5207–5218. doi: 10.1093/emboj/20.18.5207. [DOI] [PMC free article] [PubMed] [Google Scholar]
- 7.Davey CA, Sargent DF, Luger K, Mäder AW, Richmond TJ. J Mol Biol. 2002;319:1097–1113. doi: 10.1016/S0022-2836(02)00386-8. [DOI] [PubMed] [Google Scholar]
- 8.Suto RK, Edayathumangalam RS, White CL, Melander C, Gottesfeld JM, Dervan PB, Luger K. J Mol Biol. 2003;326:371–380. doi: 10.1016/s0022-2836(02)01407-9. [DOI] [PubMed] [Google Scholar]
- 9.Edayathumangalam RS, Weyermann P, Gottesfeld JM, Dervan PB, Luger K. Proc Natl Acad Sci, USA. 2004;101:6864–6869. doi: 10.1073/pnas.0401743101. [DOI] [PMC free article] [PubMed] [Google Scholar]
- 10.Muthurajan UM, Bao Y, Forsberg LJ, Edayathumangalam RS, Dyer PN, White CL, Luger K. EMBO J. 2004;23:260–271. doi: 10.1038/sj.emboj.7600046. [DOI] [PMC free article] [PubMed] [Google Scholar]
- 11.Chakravarthy S, Gundimella SK, Caron C, Perche PY, Pehrson JR, Khochbin S, Luger K. Mol Cell Biol. 2005;25:7616–7624. doi: 10.1128/MCB.25.17.7616-7624.2005. [DOI] [PMC free article] [PubMed] [Google Scholar]
- 12.Tsunaka Y, Kajimura N, Tate S, Morikawa K. Nucleic Acids Res. 2005;33:3424–3434. doi: 10.1093/nar/gki663. [DOI] [PMC free article] [PubMed] [Google Scholar]
- 13.Bao Y, White CL, Luger K. J Mol Biol. 2006;361:617–624. doi: 10.1016/j.jmb.2006.06.051. [DOI] [PubMed] [Google Scholar]
- 14.Barbera AJ, Chodaparambil JV, Kelley-Clarke B, Joukov V, Walter JC, Luger K, Kaye KM. Science. 2006;311:856–861. doi: 10.1126/science.1120541. [DOI] [PubMed] [Google Scholar]
- 15.Chakravarthy S, Luger K. J Biol Chem. 2006;281:25522–25533. doi: 10.1074/jbc.M602258200. [DOI] [PubMed] [Google Scholar]
- 16.Clapier CR, Chakravarthy S, Petosa C, Fernandez-Tornero C, Luger K, Muller CW. Proteins. 2007;71:1–7. doi: 10.1002/prot.21720. [DOI] [PMC free article] [PubMed] [Google Scholar]
- 17.Ong MS, Richmond TJ, Davey CA. J Mol Biol. 2007;368:1067–1074. doi: 10.1016/j.jmb.2007.02.062. [DOI] [PubMed] [Google Scholar]
- 18.Lu X, Simon MD, Chodaparambil JV, Hansen JC, Shokat KM, Luger K. Nature Struct Mol Biol. 2008;15:1122–1124. doi: 10.1038/nsmb.1489. [DOI] [PMC free article] [PubMed] [Google Scholar]
- 19.Wu B, Dröge P, Davey CA. Nature Chem Biol. 2008;4:110–112. doi: 10.1038/nchembio.2007.58. [DOI] [PubMed] [Google Scholar]
- 20.S. Chakravarthy & K. Luger. To be published.
- 21.Davey GE, Wu B, Dong Y, Surana U, Davey CA. Nucleic Acids Res. 2010 doi: 10.1093/nar/gkp1174. Epub ahead of print. [DOI] [PMC free article] [PubMed] [Google Scholar]
- 22.Dickerson RE, Bansal M, Calladine CR, Diekmann S, Hunter WN, Kennard O, von Kitzing E, Lavery R, Nelson HCM, Olson WK, Saenger W, Shakked Z, Sklenar H, Soumpasis DM, Tung CS, Wang AHJ, Zhurkin VB. Nucleic Acids Res. 1989;17:1797–1803. [Google Scholar]
- 23.Tolstorukov MY, Colasanti AV, McCandlish D, Olson WK, Zhurkin VB. J Mol Biol. 2007;371:725–738. doi: 10.1016/j.jmb.2007.05.048. [DOI] [PMC free article] [PubMed] [Google Scholar]
- 24.Balasubramanian S, Xu F, Olson WK. Biophys J. 2009;96:2245–2260. doi: 10.1016/j.bpj.2008.11.040. [DOI] [PMC free article] [PubMed] [Google Scholar]
- 25.F. Xu, A. V. Colasanti, Y. Li & W. K. Olson. submitted (2010).
- 26.Olson WK, Gorin AA, Lu XJ, Hock LM, Zhurkin VB. Proc Natl Acad Sci USA. 1998;95:11163–11168. doi: 10.1073/pnas.95.19.11163. [DOI] [PMC free article] [PubMed] [Google Scholar]
- 27.Lowary PT, Widom J. J Mol Biol. 1998;276:19–42. doi: 10.1006/jmbi.1997.1494. [DOI] [PubMed] [Google Scholar]
- 28.Berman HM, Olson WK, Beveridge DL, Westbrook J, Gelbin A, Demeny T, Hsieh SH, Srinivasan AR, Schneider B. Biophys J. 1992;63:751–759. doi: 10.1016/S0006-3495(92)81649-1. [DOI] [PMC free article] [PubMed] [Google Scholar]
- 29.Lu XJ, Olson WK. Nucleic Acids Res. 2003;31:5108–5121. doi: 10.1093/nar/gkg680. [DOI] [PMC free article] [PubMed] [Google Scholar]
- 30.Lu XJ, Olson WK. Nature Protocols. 2008;37:1213–1227. doi: 10.1038/nprot.2008.104. [DOI] [PMC free article] [PubMed] [Google Scholar]
- 31.El Hassan MA, Calladine CR. J Mol Biol. 1994;282:331–343. doi: 10.1006/jmbi.1998.1994. [DOI] [PubMed] [Google Scholar]
- 32.Olson WK, Colasanti AV, Czapla L, Zheng G. In: Coarse-Graining of Condensed Phase and Biomolecular Systems. Voth GA, editor. Taylor and Francis Group, LLC; 2008. pp. 205–223. [Google Scholar]
- 33.Mariño-Ramírez L, Hsu B, Baxevanis A, Landsman D. Proteins. 2006;62:838–842. doi: 10.1002/prot.20814. [DOI] [PMC free article] [PubMed] [Google Scholar]
- 34.Stargell LA, Bowen J, Dadd CA, Dedon PC, Davis M, Cook RG, Allis CD, Gorovsky MA. Genes Dev. 1993;7:2641–2651. doi: 10.1101/gad.7.12b.2641. [DOI] [PubMed] [Google Scholar]
- 35.Pehrson JR, Fried VA. Science. 1992;257:1398–1400. doi: 10.1126/science.1529340. [DOI] [PubMed] [Google Scholar]
- 36.Costanzi C, Pehrson JR. Nature. 1998;393:599–601. doi: 10.1038/31275. [DOI] [PubMed] [Google Scholar]
- 37.Kruger W, Peterson CL, Sil A, Coburn C, Arents G, Moudrianakis EN, Herskowitz I. Genes & Dev. 1995;9:2770–2779. doi: 10.1101/gad.9.22.2770. [DOI] [PubMed] [Google Scholar]
- 38.Barski A, Cuddapah S, Cui K, Roh TY, Schones DE, Wang Z, Wei G, Chepelev I, Zhao K. Cell. 2007;129:823–837. doi: 10.1016/j.cell.2007.05.009. [DOI] [PubMed] [Google Scholar]
- 39.Mikkelsen TS, Ku M, Jaffe DB, Issac B, Lieberman E, Giannoukos G, Alvarez P, Brockman W, Kim TK, Koche RP, Lee W, Mendenhall E, O'Donovan A, Presser A, Russ C, Xie X, Meissner A, Wernig M, Jaenisch R, Nusbaum C, Lander ES, Bernstein BE. Nature. 2007;448:553–560. doi: 10.1038/nature06008. [DOI] [PMC free article] [PubMed] [Google Scholar]
- 40.Lu XJ, Shakked Z, Olson WK. J Mol Biol. 2000;300:819–840. doi: 10.1006/jmbi.2000.3690. [DOI] [PubMed] [Google Scholar]
- 41.Young HD. Statistical Treatment of Experimental Data. The McGraw-Hill Companies; 1962. [Google Scholar]
- 42.Olson WK, Srinivasan AR, Colasanti AV, Zheng G, David S. In: Handbook of Molecular Biophysics: Methods and Applications. Bohr HG, editor. WILEY-VCH Verlag GmbH & Co.; 2009. pp. 359–382. [Google Scholar]
- 43.Widlund HR, Vitolo JM, Thiriet C, Hayes JJ. Biochemistry. 2000;39:3835–3841. doi: 10.1021/bi991957l. [DOI] [PubMed] [Google Scholar]
- 44.Thåström A, Bingham LM, Widom J. J Mol Biol. 2004;338:695–709. doi: 10.1016/j.jmb.2004.03.032. [DOI] [PubMed] [Google Scholar]
- 45.Morozov AV, Fortney K, Gaykalova DA, Studitsky VM, Widom J, Siggia ED. Nucleic Acids Res. 2009;37:4707–4722. doi: 10.1093/nar/gkp475. [DOI] [PMC free article] [PubMed] [Google Scholar]
- 46.Olson WK, Britton LA, Xu F, Zheng G. J Biomol Struct Dyn. 2009;26:917. [Google Scholar]