

Abstract
We use genome-wide nucleosome maps to study sequence specificity of intrinsic histone-DNA interactions. In contrast with previous approaches, we employ an analogy between a classical one-dimensional fluid of finite-size particles in an arbitrary external potential and arrays of DNA-bound histone octamers. We derive an analytical solution to infer free energies of nucleosome formation directly from nucleosome occupancies measured in high-throughput experiments. The sequence-specific part of free energies is then captured by fitting them to a sum of energies assigned to individual nucleotide motifs. We have developed hierarchical models of increasing complexity and spatial resolution, establishing that nucleosome occupancies can be explained by systematic differences in mono- and dinucleotide content between nucleosomal and linker DNA sequences, with periodic dinucleotide distributions and longer sequence motifs playing a minor role. Furthermore, similar sequence signatures are exhibited by control experiments in which nucleosome-free genomic DNA is either sonicated or digested with micrococcal nuclease, making it possible that current predictions based on high-throughput nucleosome-positioning maps are biased by experimental artifacts.
Keywords: chromatin structure, histone-DNA interactions, nucleosome positioning, biophysical models
In eukaryotes, 75%–90% of genomic DNA is packaged into histone-DNA complexes called nucleosomes, with adjacent nucleosomes separated by stretches of linker DNA (1). Each nucleosome consists of 147 base pairs (bp) of DNA wrapped around a histone octamer in a left-handed superhelix (2). Arrays of nucleosomes fold into filamentous chromatin fibers which constitute building blocks for higher-order structures (3). DNA wrapped in a nucleosome is occluded from interacting with other DNA-binding proteins such as transcription factors, RNA polymerase, and DNA repair complexes (2). On the other hand, histone tail domains act as substrates for posttranslational modifications, providing binding sites for chromatin-associated proteins which facilitate transitions between active and silent chromatin states (4).
Several distinct factors affect nucleosome positions in living cells. First of all, intrinsic histone-DNA interactions are sequence-specific: for example, poly(dA∶dT) tracts are well known to disfavor nucleosome formation (5, 6). In addition, nucleosome-depleted regions can be generated through the action of ATP-dependent chromatin remodeling enzymes (7) and histone acetylases (8). Finally, non-histone DNA-binding factors can alter nucleosome positions through binding their cognate sites and either displacing nucleosomes or hindering their subsequent formation (9, 10).
The nucleosome code hypothesis states that DNA sequence is the primary determinant of nucleosome positions in living cells (11). This hypothesis is often contrasted with the idea of statistical positioning which asserts that most nucleosomes are ordered into regular arrays simply by steric exclusion (12, 13). In this view the nucleosomal arrays are “phased” by external boundaries such as DNA-bound factors or DNA sequences unfavorable for nucleosome formation. It is also possible that a small number of nucleosomes with favorable binding affinities create boundaries against which neighboring nucleosomes are ordered by steric exclusion (14, 15).
Nucleosome positioning can be thought of as rotational, referring to the 10–11 bp-periodic orientation of the DNA helix with respect to the surface of the histone octamer, and translational, referring to the 147 bp-long sequence covered by a particular histone octamer. Optimal rotational positioning minimizes free energy of anisotropic DNA bending, causing 10–11 bp periodicity of dinucleotide frequencies in nucleosome-positioning sequences (16). We use a probabilistic description of translational positioning in which 147 bp sites with favorable free energies of nucleosome formation have a higher probability to form nucleosomes.
To study the contribution of intrinsic histone-DNA interactions to nucleosome positioning, several computational models based solely on the DNA sequence have been proposed. These models can be divided into bioinformatics, which are trained on sets of nucleosomal sequences obtained from living cells (11, 17–21) or from in vitro reconstitution experiments (5), and ab initio, which predict nucleosome energies and occupancies using DNA elasticity theory and structural data (22–24).
Here we develop a physical model for predicting free energies of nucleosome formation directly from high-throughput maps of nucleosome positions. Unlike previous approaches, our model employs an exact relation between measured nucleosome occupancies and free energies, treating steric exclusion rigorously in the presence of histone-DNA interactions of arbitrary strength and sequence specificity. We focus in particular on nucleosomes reconstituted in vitro on yeast genomic DNA (5, 25). In this case nucleosome locations are affected solely by intrinsic histone-DNA interactions and by formation of higher-order chromatin structures. To determine whether current nucleosome-positioning maps are biased by experimental artefacts, we compare our predictions with sequence signals from two nucleosome-free control experiments in which DNA was either sonicated or digested with micrococcal nuclease (MNase) to yield mononucleosome-size segments. We also test the ability of our in vitro model to predict nucleosome positions in vivo, and study the universality of nucleosome-positioning motifs by applying our approach to other organisms.
Results
Biophysical Model of Nucleosome Occupancy and Energetics.
We have predicted histone-DNA interaction energies genome-wide using an analogy between arrays of nucleosomes and a one-dimensional fluid of nonoverlapping particles of size 147 bp in an arbitrary external potential. For such a fluid it was shown by Jerry K. Percus that particle energies can be inferred exactly from the density profile (26). Although our method neglects formation of three-dimensional chromatin structures which may cause linker DNA to adopt preferred lengths (27, 28), it rigorously takes into account both steric exclusion between neighboring particles and intrinsic histone-DNA interactions, including the 10–11 bp-periodic rotational component. Our approach, outlined in Fig. S1, proceeds in the direction opposite to previous work which first employed either bioinformatics or DNA elastic theory to construct a sequence-specific histone-DNA interaction potential and then positioned nucleosomes on genomic DNA without steric overlap (5, 11, 18, 22). In contrast, we employ an exact decomposition from experimentally available nucleosome probabilities and occupancies to free energies of nucleosome formation which we call Percus energies (Eq. 1).
To extract the sequence-specific component of nucleosome energetics, we fit Percus energies at each genomic bp to a sum of energies of individual nucleotide motifs ranging from 1 to N bp in length (see Materials and Methods). There is no need to construct an explicit background model of word frequencies with this approach, and the linear fit is guaranteed to converge to the globally optimal solution. Thus Percus decomposition allows us to bypass a nonlinear fit of motif energies to the occupancy profile. Words with the same nucleotide sequence are assumed to have the same energy if they occur anywhere in the 147 bp-long nucleosomal site (the position-independent model, Eq. 2), or fall into one of the three equal-length regions that span the 147 bp site (the three-region model), or are separated by an integer multiple of the 10 bp DNA helical twist (the periodic model). All models are constrained to assign nonzero energies to words with N nucleotides only if the sequence specificity of Percus energies cannot be captured using words with 1…N - 1 nucleotides (see SI Text). We refer to the maximum length of the words included into a model as its order N. In addition, we have developed an order 2 model in which mono- and dinucleotides are allowed to have different energies at every position in the 147 bp-long nucleosomal site (the spatially resolved model, Eq. 3).
We have used the sequence-specific models to predict nucleosome formation energies for Saccharomyce cerevisiae, Caenorhabditis elegans, and Escherichia coli. These energies serve as input to a recursive algorithm which computes the probability to start a nucleosome and the nucleosome occupancy (defined as the probability that a given bp is covered by any nucleosome) at every genomic bp (11, 22).
A∶T/G∶C Content Is the Primary Determinant of Nucleosome Sequence Preferences in S. cerevisiae.
The N = 5 position-independent model, which assigns energies to 364 independent words ranging from 1 bp to 5 bp in length, is capable of accurately predicting occupancy by nucleosomes assembled in vitro on yeast genomic DNA (Fig. S2 A and B). Remarkably, even though the model is based on Zhang et al. high-throughput nucleosome-positioning data (25) (yielding r = 0.61 between predicted and observed occupancies), its prediction of Kaplan et al. in vitro occupancies (5) is more accurate (r = 0.75), partially due to the 2.85-fold higher sequence coverage in the latter dataset. Indeed, the correlation coefficient drops from 0.75 to 0.70 when sequence reads are randomly removed from the Kaplan et al. map to match Zhang et al. level of read coverage. These correlations are highly significant: randomizing sequence read positions and creating random nucleosome arrays typically yields r < 0.1 with measured occupancies. The correlation between the two in vitro datasets themselves is rather low (r = 0.69), probably because Kaplan et al. used 0.4∶1 histone-to-DNA mass ratio, whereas Zhang et al. employed 1∶1 ratio which corresponds to in vivo levels of nucleosome occupancy (5, 25).
The N = 5 model is also highly successful in discriminating between high- and low-occupancy regions (dashed curves in Fig. 1B). Its performance is comparable to the Kaplan et al. bioinformatics model (5) which takes both distributions of 5 bp-long words in nucleosomes and linkers and position-dependent dinucleotide frequencies into account (Table S1 and Dataset S1, dashed-dotted curves in Fig. 1B). Occupancies predicted by the two models are highly correlated (r = 0.89) and thus capture essentially the same nucleosome sequence preferences. Note that we report correlations between occupancy profiles while Kaplan et al. perform a log-transform on occupancies before computing a linear correlation coefficient: as a result we obtain r = 0.79 between Kaplan et al. predicted and in vitro occupancies, whereas they report r = 0.89 for the same comparison (5).
Fig. 1.

Position-independent model predicts in vitro nucleosome occupancy in S. cerevisiae with high accuracy. (A) Density scatter plot for the nucleosome occupancy at each genomic base pair predicted with the N = 2 position-independent model vs. in vitro occupancy observed by Zhang et al. (25). The color of each region represents the number of data points mapped to that region. The model is fit on this data (see Materials and Methods). (B) The receiver operating characteristic curve for discriminating between DNA segments with high and low nucleosome occupancy. The yeast genome was parsed into 500 bp windows and the average nucleosome occupancy was computed for each window. 5,000 windows with the highest and 5,000 with the lowest average occupancies were ranked high-to-low using occupancies predicted with the N = 2 position-independent model, N = 5 position-independent model, and Kaplan et al. model (5). For each partial list of ranked windows with 1,…,10,000 entries we plot the fraction of windows in the list known to have high occupancy on the y-axis, low occupancy on the x-axis. (C) Rank-order plots of energies of 5 bp words: the energy of each word is ranked using position-independent models of order N = 1 through N = 4 and compared with the N = 5 model. Each curve shows the number of words whose ranks are separated by a given distance or less. ρ is the Spearman rank correlation coefficient.
However, we find that using 5 bp-long words is not necessary: N = 2 position-independent model is virtually identical to the N = 5 model in predicting in vitro nucleosome occupancies (Fig. 1 A and Fig. S2C), classifying high- and low-occupancy regions (solid curves in Fig. 1B), and ranking 5 bp-long sequences (Fig. 1C). The N = 2 model remains highly correlated with the Kaplan et al. bioinformatics model (r = 0.89; Fig. S3). Remarkably, even the N = 1 position-independent model with one free parameter (ϵA = ϵT and ϵC = ϵG if both DNA strands are included for each mapped nucleosome) retains most of the predictive power of the higher-order models (Fig. 1C and Table S1), in agreement with two recent studies (20, 29). Thus positions of nucleosomes reconstituted in vitro on the yeast genome are largely controlled by the differences in A∶T and G∶C dinucleotide frequencies in nucleosomes and linkers. In particular, higher-order terms play little role in the energetics of poly(dA∶dT) tracts (Fig. S4).
Indeed, Fig. 2 A and B show that DNA sequences of well-positioned nucleosomes (defined by five or more sequence reads mapped to the same genomic coordinate) are characterized by sharp A∶T/G∶C discontinuities across the nucleosome boundary. Overall, A∶T dinucleotides are depleted in nucleosomes and enriched in linkers, with the opposite trend for G∶C dinucleotides. Although well-positioned nucleosomes make up only 5.4% of all mapped nucleosomes defined by one or more sequence reads, they produce an occupancy profile which is highly correlated with the total nucleosome occupancy (r = 0.71, with 56.4% of genomic bps covered by at least one well-positioned nucleosome). In contrast, 81.5% of all nucleosomes are defined by just one or two reads and exhibit little sequence specificity (dashed lines in Fig. 2A). Furthermore, the N = 2 position-independent model based only on well-positioned nucleosomes is virtually identical to the N = 2 model based on all nucleosomes (rank correlation of 0.95 between the two sets of dinucleotide energies). Occupancies predicted by the two models correlate with r = 0.997. Thus our predictions reveal sequence preferences of a subset of nucleosomes that tend to occupy specific sites on the DNA.
Fig. 2.

Dinucleotide distributions in nucleosome and linker sequences. Nucleosomes were assembled in vitro on the yeast genome using salt dialysis (25). (A) Average relative frequencies of WW (AA, TT, AT, and TA) and SS (CC, GG, CG, and GC) dinucleotides at each position within the nucleosome are plotted with respect to the nucleosome dyad. The relative frequency of each dinucleotide is defined as its frequency at a given position divided by genome-wide frequency. All frequencies are smoothed using a 3 bp moving average. Solid lines: well-positioned nucleosomes defined by five or more sequence reads, dashed lines: bulk nucleosomes defined by one or two sequence reads. (B) Heat map of relative frequencies for each dinucleotide, plotted with respect to the nucleosome dyad. (C) Average energies of WW (AA, TT, AT, and TA) and SS (CC, GG, CG, and GC) dinucleotides at each position within the nucleosome predicted with the N = 2 spatially resolved model are plotted with respect to the nucleosome dyad.
Periodic Motif Distributions Do Not Play a Significant Role in Nucleosome Occupancy Predictions.
Besides the A∶T/G∶C discontinuities, Fig. 2 A and B reveal two additional features that could affect positioning preferences of yeast nucleosomes: prominent 10–11 bp dinucleotide periodicity and a particularly strong A∶T depletion and G∶C enrichment within 20 bp of the nucleosome dyad. To test the utility of these features in nucleosome occupancy predictions we have employed three additional models that either partially or fully differentiate between words located at different positions within the nucleosomal site.
The three-region model assigns different energies to words found in the 47 bp-long core and flanking regions and is thus capable of capturing prominent dinucleotide biases in the vicinity of the nucleosomal dyad. The periodic model enforces 10 bp helical twist periodicity. The most detailed spatially resolved model captures all three main features exhibited by the frequencies of dinucleotides found in nucleosome-positioning sequences (Fig. 2C). These models do not offer a significant improvement over the N = 2 position-independent model (Table S1 and Dataset S1), reflecting the fact that all three features are simultaneously present in well-positioned in vitro nucleosomes (Fig. 2A) and so basing a prediction on any one of them is sufficient. Furthermore, global A∶T/G∶C discontinuities appear to play a role of the primary nucleosome-positioning determinant, whereas periodic oscillations of dinucleotide frequencies can be greatly diminished or absent in other organisms and in in vivo nucleosome-positioning maps from yeast (Fig. S5).
However, the rotational positioning component of the yeast model should be more predictive for nucleosomes positioned on DNA sequences with prominent 10–11 bp dinucleotide periodicities. Indeed, the spatially resolved model works better than the N = 2 position-independent model for six nucleosomes whose in vitro positions on short (< 250 bp) DNA sequences have been determined with single bp precision by hydroxyl radical footprinting (Fig. S6). However, the predictive power is still modest, indicating that our approach is better suited to predicting nucleosome occupancies rather than exact positions of individual core particles.
In Vivo Nucleosome Positions Are Partially Controlled by the Underlying DNA Sequence.
We investigated whether the simple rules that govern in vitro nucleosome positions remain valid in living cells. Indeed, in vivo nucleosomes appear to be well positioned in the vicinity of transcription start and termination sites, with prominent nucleosome-depleted regions (NDRs) on both ends of the transcript (Fig. S7; in vivo chromatin comes from cells grown in YPD medium) (5). In contrast, in vitro nucleosomes are much more delocalized (Fig. S8), so that nucleosomal arrays around NDRs are not ordered and NDRs themselves are much less pronounced (Fig. S7) (25).
Despite these differences, dinucleotide energies extracted from in vitro and in vivo nucleosome-positioning maps are reasonably well correlated (Fig. S9), yielding nearly identical predictions of nucleosome occupancies (Table S1). Although dinucleotide energies inferred from the in vivo map of cross-linked nucleosomes are not as close to their in vitro counterparts as the energies based on the in vivo map without cross-linking, the two in vivo models yield very similar occupancy profiles (r = 0.94). We conclude that intrinsic sequence preferences cannot create the striking oscillations observed in the in vivo occupancy profile (Fig. S7). Rather, biological factors such as components of transcription initiation machinery may act to position the first nucleosome downstream of the NDR [the so-called +1 nucleosome (14)] (25).
Energetics of Nucleosome Formation in E. coli and C. elegans.
To study whether dinucleotide-based nucleosome-positioning patterns observed in S. cerevisiae extend to other organisms, we have inferred position-independent dinucleotide energies from a map of nucleosomes assembled in vitro on the E. coli genome (25). Although the correlation between observed and predicted occupancies was modest in this case (Fig. 3B), probably because the E. coli genome did not evolve to favor nucleosome formation (resulting in lower sequence read coverage in competition with yeast DNA), the dinucleotide energies were similar in yeast and E. coli (Fig. 3C). The most prominent difference was exhibited by the four C∶G-containing dinucleotides which have the lowest energies in S. cerevisiae but occupy middle positions in the case of E. coli (Table S2).
Fig. 3.

Prediction of nucleosome occupancies in C. elegans and E. coli. Density scatter plots for the nucleosome occupancy at each genomic base pair predicted with the N = 2 position-independent model vs. in vivo occupancy in C. elegans (30) (A) and in vitro occupancy in E. coli (25) (B). Rank-order plots of energies of 2 bp words (C): the energy of each word is ranked using a position-independent model of order N = 2 trained on either in vitro (S. cerevisiae, E. coli) or in vivo (C. elegans) nucleosome-positioning data. Each curve shows the number of words whose ranks are separated by a given distance or less in the C. elegans and E. coli vs. S. cerevisiae fits. ρ is the Spearman rank correlation coefficient.
Dinucleotide energies inferred from the in vivo map of C. elegans nucleosomes (30), while an excellent predictor of nucleosome occupancies in the C. elegans genome (Fig. 3A), are even further from their yeast counterparts, with C∶G-containing dinucleotides again affected most (Fig. 3C and Table S2). It is likely that in vivo effects override intrinsic nucleosome preferences in C. elegans. In addition, we find that the mononucleotide model is much less predictive in this organism: compared with the N = 2 position-independent model, the correlation between the N = 1 model and data is 30.8% worse in C. elegans but only 10.0% worse in yeast. On the other hand, fitting energies of 3 bp-long words in C. elegans resulted only in a 3.0% improvement in the correlation coefficient, indicating that it is not necessary to keep track of higher-order motifs.
Although the dinucleotide energies are somewhat different in the three organisms we examined, position-independent models from one organism can still be used to predict nucleosome positions in another. For example, using the N = 2 E. coli model to predict in vitro nucleosome occupancies in S. cerevisiae (25) results in r = 0.55, which is only a little worse than r = 0.60 observed with the “native” model (Table S1). The N = 2 C. elegans model has a correlation of 0.46 with the in vitro occupancy from S. cerevisiae, while the correlation between the N = 2 S. cerevisiae in vitro model and the in vivo occupancy from C. elegans is 0.52, somewhat lower than 0.65 obtained with the native model. Therefore it is possible to make useful predictions in organisms for which high-throughput nucleosome-positioning maps are not yet available.
Nucleosome-Free Control Experiments Can Be Used to Predict Nucleosome Positions.
Depletion of A∶T and enrichment of G∶C-containing dinucleotides in nucleosomal sequences and the discontinuity of dinucleotide frequencies across the nucleosome boundary may be exaggerated by MNase sequence specificity—MNase is well known to preferentially digest A∶T-rich sequences through its exonuclease activity (31, 32). To study this possibility, we have partially digested naked DNA from S. cerevisiae and E. coli genomes with MNase, isolated ∼150 bp DNA fragments, and sequenced them. We have also examined another control in which DNA was sonicated rather than MNase-digested (25). We have computed Percus energies for these control experiments and analyzed their sequence specificity using the N = 2 position-independent model.
Unexpectedly, in both cases predicted dinucleotide energies are very close to those obtained from in vitro nucleosome-positioning maps (Fig. 4A). The differences are comparable to those between the N = 2 in vitro and in vivo models (Fig. S9). As a result, the N = 2 model trained on yeast sequences from the sonication and MNase controls predicts Kaplan et al. in vitro nucleosome occupancies with correlation coefficients of 0.64 and 0.61, respectively, compared with r = 0.75 for the model trained on Zhang et al. in vitro nucleosomes (Table S1). The N = 2 model trained on E. coli sequences from the sonication and MNase controls yields 0.67 and 0.42 (Dataset S1).
Fig. 4.

Nucleosome-free control experiments yield sequences with nucleosome-like dinucleotide distributions. (A) Rank-order plots of energies of 2 bp words: the energy of each word is ranked using a position-independent model of order N = 2 trained on either in vitro nucleosome-positioning sequences or fragments of mononucleosomal size obtained from sonication and MNase digestion assays of nucleosome-free yeast DNA. Each curve shows the number of words whose ranks are separated by a given distance or less in the sonication and MNase digestion vs. nucleosomal fits. ρ is the Spearman rank correlation coefficient. (B) Same as Fig. 2A except the dinucleotide frequencies are from mononucleosome-size DNA sequences (defined by > 5 sequence reads) from yeast genomic DNA digested by MNase in the absence of nucleosomes.
One explanation for the predictive power of the MNase control is that dinucleotide energies assigned to nucleosomes are biased to some extent by sequence specificity of MNase exonuclease activity. Alternatively, exonuclease activity of MNase may simply isolate nucleosomal sequences fortuitously, without causing substantial loss of nucleosomes occupying A∶T-rich DNA. The distribution of dinucleotides frequencies in MNase-digested DNA of mononucleosome size is somewhat similar to that observed in nucleosomes, although there are also substantial differences (cf. Fig. 2A and Fig. 4B). In particular, MNase-digested sequences given by more than five sequence reads coincide with well-positioned in vitro nucleosomes from Zhang et al. (defined by five or more sequence reads) 3.5 times more frequently than expected by chance. We also find that sonicated sequences are A∶T-depleted and G∶C-enriched, although in contrast with MNase the deviations of dinucleotide frequencies from their genome-wide averages are rather small (Fig. S5F). Apparently, sonication tends to break DNA segments across the A∶T/G∶C “fault lines” which also define nucleosome boundaries, leading to enrichment in nucleosome-positioning sequences even in the absence of histones.
Discussion
Although nucleosome positioning has been extensively studied with high-throughput methods (5, 14, 15, 18, 21, 25, 30, 33, 34), the origin of intrinsic histone-DNA sequence specificity and its contribution to the structure of in vivo chromatin remain controversial. We have developed a biophysical approach to inferring nucleosome energies and occupancies directly from high-throughput sequencing data. The effects of steric exclusion are rigorously separated from intrinsic histone-DNA interactions under the assumption that nucleosomes form a one-dimensional array in which there are no nucleosome-nucleosome interactions besides nearest-neighbor steric hindrance. This assumption amounts to neglecting intrinsic structure of the chromatin fiber which is believed to impose “quantized” linker lengths (27, 28). Furthermore, we assume that the one-dimensional nucleosome array is in thermodynamic equilibrium, with individual nucleosome positions corresponding to the lowest free energy state of the entire array.
We find that most nucleosomes mapped in vitro are not sequence specific. However, well-positioned nucleosomes tend to occupy G∶C-enriched and A∶T-depleted DNA segments in S. cerevisiae (Fig. 2 A and B). A∶T and G∶C dinucleotide content changes sharply across the nucleosome boundary and is thus highly predictive of nucleosome positions. More complex models that take rotational positioning into account do not yield significantly improved predictions (Table S1), indicating that G∶C content is an essential nucleosome-positioning determinant. N = 2 position-independent models trained on Zhang et al. and Kaplan et al. in vitro maps yield very similar results (Table S1 and Dataset S1), despite the rather low correlation (r = 0.69) between the datasets themselves.
Surprisingly, models trained on DNA from nucleosome-free control experiments can be used to predict nucleosome occupancies (Fig. 4A and Table S1). It is possible that MNase-based nucleosome maps are biased to some extent by the sequence specificity of MNase exonuclease activity (although we cannot rule out coincidence), whereas similarities between nucleosome-positioning sequences and the sonication control appear to be coincidental. MNase- and sonication-free nucleosome-positioning maps are required to fully resolve the issue of experimental bias.
In summary, nucleosome sequence preferences can be captured using a simple physical model based on dinucleotide content. Promoter regions are unfavorable for nucleosome formation, while +1 nucleosomes have lower energies, helping define nucleosome array boundaries. Nonetheless, sequence preferences alone cannot explain why nucleosomes are ordered into well-defined arrays in vivo (Fig. S7). Similar nucleosome-positioning signals can be extracted from in vitro and in vivo chromatin (Fig. S9), showing that nucleosomes tend to occupy thermodynamically favorable positions in living cells (5).
Materials and Methods
Parallel Sequencing and Mapping of Control and Nucleosome Data.
Genomic DNA from S. cerevisiae and E. coli was purified using Qiagen genomic tip 500/G, and mixed in a 3∶1 mass ratio. Part of the mixture was treated with MNase to yield a small average fragment size (< 300 bp), and DNA fragments of approximately 150 bp were purified by excision from an agarose gel. A second fraction of the yeast/bacterial DNA mixture was subjected to sonication in a Misonix water-bath instrument to yield an average fragment size of 150 bp, as described earlier (25). Mononucleosome-size DNA fragments were sequenced using Illumina Genome Analyzer, and mapped to the S. cerevisiae genome (SGD April 2008 build) and to the E. coli K12 genome (U00096), allowing up to two mismatches per read.
We have taken a map of nucleosomes assembled in vitro on the same mixture of yeast and bacterial DNA from our previous study (25). In addition, Kaplan et al. provided two replicates for nucleosomes reconstituted in vitro on yeast genomic DNA, and six replicates (two with and four without cross-linking) for nucleosomes from log-phase yeast cells grown in YPD medium (5). We have combined the replicates separately in each of the three categories using sequence read coordinates provided by the authors. Finally, coordinates of C. elegans nucleosomes from mixed-stage, wild-type (N2) cells are from Valouev et al. (30).
Preprocessing of Nucleosome Sequence Reads.
We assume that the coordinate of each mapped read gives the actual nucleosome location. We extend all mapped reads to the 147 bp canonical nucleosome length and combine reads from both strands (SI Text). This procedure yields the number of nucleosomes that start at each genomic bp (the sequence read profile; Fig. S1A), as well as the number of nucleosomes that cover a given bp (the nucleosome coverage profile). We control for sequencing and mapping artifacts by removing regions with anomalously high and low nucleosome coverage from further consideration (SI Text).
Next we smooth the sequence read and nucleosome coverage profiles by replacing the number of nucleosomes starting at each bp with a Gaussian centered on that bp (14, 15). The area of the Gaussian is equal to the number of sequence reads starting at that position, and its σ is set to either 2 or 20. Gaussian smoothing is necessary because current levels of sequence read coverage lead to large deviations in the number of nucleosomes located at neighboring bps, contrary to the expectation that such nucleosomes should have very similar binding affinities because they occupy nearly identical sites (11). The effect of Gaussian smoothing can be seen in Fig. S10.
Finally, we normalize the sequence read and nucleosome coverage profiles by the highest value of nucleosome coverage on the chromosome. We interpret the resulting normalized profiles as the probability to start a nucleosome at a given bp (the nucleosome probability profile) and the probability that a given bp is covered by any nucleosome (the nucleosome occupancy profile; Fig. S1B).
Prediction of Nucleosome Energetics from High-Throughput Sequencing Maps.
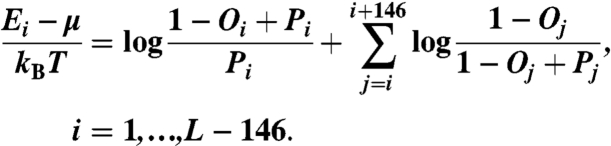
We derive nucleosome formation energies directly from the smoothed probability and occupancy profiles, under the assumption that observed nucleosome positions are affected solely by intrinsic histone-DNA interactions and steric exclusion (SI Text):
 |
[1] |
Here Ei is the Percus energy at bp i, μ is the chemical potential of histone octamers, kBT is the product of the Boltzmann constant and room temperature, L is the number of bps in the DNA segment, Pi is the probability to start a nucleosome at bp i, and Oi is the nucleosome occupancy of bp i (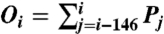 ).
).
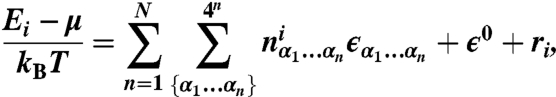
We establish the degree of correlation between Percus energies and sequence features found in nucleosomal and linker DNA by fitting them to one of four sequence-specific models (Fig. S1C). The position-independent model of order N is given by:
 |
[2] |
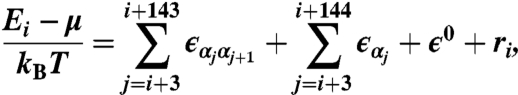
where N is the maximum word length, ϵ0 is the sequence-independent offset, and  is the number of times a word of length n with sequence α1…αn [α = {A,C,G,T}] was found within the nucleosome that started at bp i. ϵα1…αn are word energies, and ri is the residual at bp i. The word energies are constrained by
 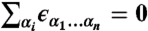 , ∀ i = 1…n, which leaves 3n independent words of length n (the constraints are introduced into Eq. 2 prior to the fit). We exclude all words that extend into three terminal bps on each end of the 147 bp nucleosomal site from our counts.
The spatially resolved model is defined by:
 |
[3] |
where the mono- and dinucleotide energies are constrained as above at each position within the nucleosomal site. The three-region model and the periodic model are described in the SI Text. We use Gaussian smoothing with σ = 20 for position-independent and three-region models and σ = 2 for spatially resolved and periodic models.
Eqs. 2 and 3 define linear models which we fit against Percus energies using the lm function from R statistical software (http://www.r-project.org) (Fig. S1C). For computational reasons the genome is divided into several segments of equal size and a separate model is trained on each segment (Fig. S11). The final energy of each word is the average over all models. To restore the dynamic range of the fitted energies, we rescale the variance of the fitted energies to match the Percus energies on which they were trained. We rescale each chromosome separately. Finally, we predict nucleosome probabilities and occupancies from fitted energies using a standard recursive algorithm (Fig. S1D and SI Text) (22). Our predictions, data, and software are available on the Nucleosome Explorer website, http://nucleosome.rutgers.edu. DNA sequencing data has been deposited on Gene Expression Omnibus with the accession number of GSE23712.
Supplementary Material
Acknowledgments.
We thank Jerry K. Percus for helpful discussions. This research was supported by National Institutes of Health (HG 004708 to A.V.M. and GM 30186 to K.S.). A.V.M. acknowledges support from an Alfred P. Sloan Research Fellowship.
Footnotes
The authors declare no conflict of interest.
*This Direct Submission article had a prearranged editor.
Data deposition: The data reported in this paper have been deposited in the Gene Expression Omnibus (GEO) database, www.ncbi.nlm.nih.gov/geo.
This article contains supporting information online at www.pnas.org/lookup/suppl/doi:10.1073/pnas.1003838107/-/DCSupplemental.
References
- 1.van Holde KE. Chromatin. New York: Springer; 1989. [Google Scholar]
- 2.Richmond TJ, Davey CA. The structure of DNA in the nucleosome core. Nature. 2003;423:145–150. doi: 10.1038/nature01595. [DOI] [PubMed] [Google Scholar]
- 3.Felsenfeld G, Groudine M. Controlling the double helix. Nature. 2003;421:448–453. doi: 10.1038/nature01411. [DOI] [PubMed] [Google Scholar]
- 4.Jenuwein T, Allis C. Translating the histone code. Science. 2001;293:1074–1080. doi: 10.1126/science.1063127. [DOI] [PubMed] [Google Scholar]
- 5.Kaplan N, et al. The DNA-encoded nucleosome organization of a eukaryotic genome. Nature. 2009;458:362–366. doi: 10.1038/nature07667. [DOI] [PMC free article] [PubMed] [Google Scholar]
- 6.Sekinger EA, Moqtaderi Z, Struhl K. Intrinsic histone-DNA interactions and low nucleosome density are important for preferential accessibility of promoter regions in yeast. Mol Cell. 2005;18:735–748. doi: 10.1016/j.molcel.2005.05.003. [DOI] [PubMed] [Google Scholar]
- 7.Becker PB, Hörz W. ATP-dependent nucleosome remodeling. Annu Rev Biochem. 2002;71:247–273. doi: 10.1146/annurev.biochem.71.110601.135400. [DOI] [PubMed] [Google Scholar]
- 8.Deckert J, Struhl K. Histone acetylation at promoters is differentially affected by activators and repressors. Mol Cell Biol. 2001;21:2726–2735. doi: 10.1128/MCB.21.8.2726-2735.2001. [DOI] [PMC free article] [PubMed] [Google Scholar]
- 9.Adams CC, Workman JL. Binding of disparate transcriptional activators to nucleosomal DNA is inherently cooperative. Mol Cell Biol. 1995;15:1405–1421. doi: 10.1128/mcb.15.3.1405. [DOI] [PMC free article] [PubMed] [Google Scholar]
- 10.Miller JA, Widom J. Collaborative competition mechanism for gene activation in vivo. Mol Cell Biol. 2003;23:1623–1632. doi: 10.1128/MCB.23.5.1623-1632.2003. [DOI] [PMC free article] [PubMed] [Google Scholar]
- 11.Segal E, et al. A genomic code for nucleosome positioning. Nature. 2006;442:772–778. doi: 10.1038/nature04979. [DOI] [PMC free article] [PubMed] [Google Scholar]
- 12.Kornberg RD, Stryer L. Statistical distributions of nucleosomes: nonrandom locations by a stochastic mechanism. Nucleic Acids Res. 1988;16:6677–6690. doi: 10.1093/nar/16.14.6677. [DOI] [PMC free article] [PubMed] [Google Scholar]
- 13.Fedor MJ, Lue NF, Kornberg RD. Statistical positioning of nucleosomes by specific protein-binding to an upstream activating sequence in yeast. J Mol Biol. 1988;204:109–127. doi: 10.1016/0022-2836(88)90603-1. [DOI] [PubMed] [Google Scholar]
- 14.Mavrich TN, et al. Nucleosome organization in the Drosophila genome. Nature. 2008;453:358–362. doi: 10.1038/nature06929. [DOI] [PMC free article] [PubMed] [Google Scholar]
- 15.Mavrich TN, et al. A barrier nucleosome model for statistical positioning of nucleosomes throughout the yeast genome. Genome Res. 2008;18:1073–1083. doi: 10.1101/gr.078261.108. [DOI] [PMC free article] [PubMed] [Google Scholar]
- 16.Widom J. Role of DNA sequence in nucleosome stability and dynamics. Q Rev Biophys. 2001;34:269–324. doi: 10.1017/s0033583501003699. [DOI] [PubMed] [Google Scholar]
- 17.Ioshikhes IP, Albert I, Zanton SJ, Pugh BF. Nucleosome positions predicted through comparative genomics. Nat Genet. 2006;38:1210–1215. doi: 10.1038/ng1878. [DOI] [PubMed] [Google Scholar]
- 18.Field Y, et al. Distinct modes of regulation by chromatin encoded through nucleosome positioning signals. PLoS Comput Biol. 2008;4(11):e1000216. doi: 10.1371/journal.pcbi.1000216. [DOI] [PMC free article] [PubMed] [Google Scholar]
- 19.Yuan GC, Liu JS. Genomic sequence is highly predictive of local nucleosome depletion. PLoS Comput Biol. 2008;4(1):e13. doi: 10.1371/journal.pcbi.0040013. [DOI] [PMC free article] [PubMed] [Google Scholar]
- 20.Peckham HE, et al. Nucleosome positioning signals in genomic DNA. Genome Res. 2007;17:1170–1177. doi: 10.1101/gr.6101007. [DOI] [PMC free article] [PubMed] [Google Scholar]
- 21.Lee W, et al. A high-resolution atlas of nucleosome occupancy in yeast. Nat Genet. 2007;39:1235–1244. doi: 10.1038/ng2117. [DOI] [PubMed] [Google Scholar]
- 22.Morozov AV, et al. Using DNA mechanics to predict in vitro nucleosome positions and formation energies. Nucleic Acids Res. 2009;37:4707–4722. doi: 10.1093/nar/gkp475. [DOI] [PMC free article] [PubMed] [Google Scholar]
- 23.Miele V, Vaillant C, d’Aubenton Carafa Y, Thermes C, Grange T. DNA physical properties determine nucleosome occupancy from yeast to fly. Nucleic Acids Res. 2008;36:3746–3756. doi: 10.1093/nar/gkn262. [DOI] [PMC free article] [PubMed] [Google Scholar]
- 24.Tolstorukov MY, Colasanti AV, McCandlish DM, Olson WK, Zhurkin VB. A novel roll-and-slide mechanism of DNA folding in chromatin: implications for nucleosome positioning. J Mol Biol. 2007;371:725–738. doi: 10.1016/j.jmb.2007.05.048. [DOI] [PMC free article] [PubMed] [Google Scholar]
- 25.Zhang Y, et al. Intrinsic histone-DNA interactions are not the major determinant of nucleosome positions in vivo. Nature Struct Mol Biol. 2009;16:847–852. doi: 10.1038/nsmb.1636. [DOI] [PMC free article] [PubMed] [Google Scholar]
- 26.Percus JK. Equilibrium state of a classical fluid of hard rods in an external field. J Stat Phys. 1976;15:505–511. [Google Scholar]
- 27.Ulanovsky LE, Trifonov EN. Biomolecular Stereodynamics III. New York: Adenine Press; 1986. pp. 35–44. [Google Scholar]
- 28.Wang JP, et al. Preferentially quantized linker DNA lengths in Saccharomyces cerevisiae. PLoS Comput Biol. 2008;4(9):e1000175. doi: 10.1371/journal.pcbi.1000175. [DOI] [PMC free article] [PubMed] [Google Scholar]
- 29.Tillo D, Hughes TR. G+C content dominates intrinsic nucleosome occupancy. BMC Bioinformatics. 2009;10:442. doi: 10.1186/1471-2105-10-442. [DOI] [PMC free article] [PubMed] [Google Scholar]
- 30.Valouev A, et al. A high-resolution, nucleosome position map of C. elegans reveals a lack of universal sequence-dictated positioning. Genome Res. 2008;18:1051–1063. doi: 10.1101/gr.076463.108. [DOI] [PMC free article] [PubMed] [Google Scholar]
- 31.Wingert L, Von Hippel PH. The conformation dependent hydrolysis of DNA by micrococcal nuclease. Biochim Biophys Acta. 1968;157:114–126. doi: 10.1016/0005-2787(68)90270-0. [DOI] [PubMed] [Google Scholar]
- 32.Hörz W, Altenburger W. Sequence specific cleavage of DNA by micrococcal nuclease. Nucleic Acids Res. 1981;9:2643–2658. doi: 10.1093/nar/9.12.2643. [DOI] [PMC free article] [PubMed] [Google Scholar]
- 33.Yuan GC, et al. Genome-scale identification of nucleosome positions in S. cerevisiae. Science. 2005;309:626–630. doi: 10.1126/science.1112178. [DOI] [PubMed] [Google Scholar]
- 34.Zawadzki KA, Morozov AV, Broach JR. Chromatin-dependent transcription factor accessibility rather than nucleosome remodeling predominates during global transcriptional restructuring in Saccharomyces cerevisiae. Mol Biol Cell. 2009;20:3503–3513. doi: 10.1091/mbc.E09-02-0111. [DOI] [PMC free article] [PubMed] [Google Scholar]
Associated Data
This section collects any data citations, data availability statements, or supplementary materials included in this article.