Abstract
We demonstrate single biomolecule detection and quantification within sub-nanolitre droplets through application of Cylindrical Illumination Confocal Spectrosocpy (CICS) and droplet confinement within a retractable microfluidic constriction.
Droplet-based microfluidic platforms offer the distinct advantages of fast sample mixing, limited reagant dispersion, and lower sample loss or contamination when compared to traditional microfluidic devices.1, 2 In addition, simple control stategies for kHz frequency droplet generation, transportation, storage, and sorting give the platform a propensity for high throughput analysis. While initial applications have been shown in a range of research disciplines, including biochemical analysis3, chemical and material synthesis4, and chemical reactions5, more recent applications have emerged that seek to expand this high throughput capability to the analysis of individual biological entities, such as single cells6–8 or biomolecules.9, 10
In single cell experiments, in vitro compartmentalization in droplets enables rapid accumulation of secreted cellular factors11, and provides both chemical isolation and a unique means of cell selection and control.12 Alternately, single molecule compartmentalization enables nucleic acid analysis through single-copy DNA PCR, extending the high throughput capacity of droplet-based microfluidics to digital PCR assays.7, 9, 10 However, the current dependence on amplification techniques (e.g. PCR or fluorogenic substrate)1 for detection of low concentration biomolecules presents limitations in droplet-based platforms; these include decreased throughput and added complexity involved with enzymatic amplification. These limitations point towards the need for integration of a highly sensitive detection platform for amplification-free detection of low-abundance biomolecules.
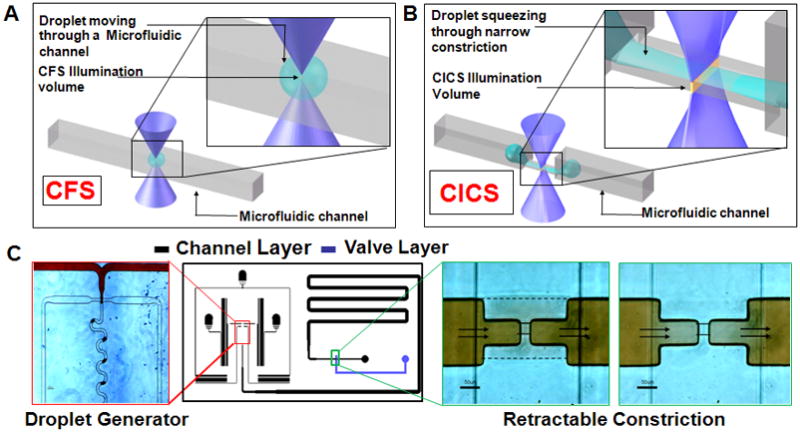
Confocal Fluorescence Spectroscopy (CFS) has traditionally been used for fluorescence based single molecule detection (SMD).13–18 Resolution of single fluorophores is accomplished through reduction of a laser-illuminated probe volume to femtolitre size, thus minimizing background noise. Although well suited for SMD in continuous sample streams, CFS is ill-suited for low abundance analyte detection in discrete volumes (e.g. droplets).19, 20 Figure 1A depicts the challenges associated with SMD in droplet platforms. A single pass of the droplet through the laser illuminated volume results in low intra-droplet detection efficiencies (i.e. detection of only a small fraction of encapsulated molecules), as most biomolecules pass around the detection volume. In addition, even at nominal flow speeds the sub-nanolitre droplets pass by the detection volume in milliseconds, making it difficult to resolve 10’s to 100’s of molecules encapsulated within each single droplet.
Fig 1.

A. A droplet moving through a microfluidic channel is shown. Inset shows the size of the droplet relative to the illumination volume of a standard Confocal Fluorescence Spectroscopy (CFS) setup. B. In contrast, elongation of a droplet squeezing through a microfluidic constriction is shown. The inset shows the sheet-like Illumination volume of a Cylindrical Illumination Confocal Spectroscopy setup relative to the elongated droplet in the microfluidic constriction. C. The multilayered microfluidic device designed for the experiments in this paper is shown. A flow focusing geometry was used for droplet generation. The left panel shows droplets being generated using a food dye as the discrete phase. The rightmost panels show the retractable constriction region in either the open (left) or actuated (right) state, as described in text. (scale bar: 50 μm)
In this report, we overcome challenges involved with biomolecular quantification in droplets, including short intradroplet signal acquisition times and droplet – illumination volume size mismatches. In our platform, one dimensional beam shaping using cylindrical optics (Cylindrical Illumination Confocal Spectrsocopy, CICS)21 produces a sheet-like illumination volume, maximizing intra-droplet detection efficiency (figure 1B). Furthermore, droplet confinement through a microfluidic constriction extends droplet duration through the illumination volume, providing the spatial and temporal resolution necessary to detect single biomolecules.
Controlled droplet confinement and passage through the illumination volume was accomplished using a microfluidic constriction channel patterned into a retractable PDMS valve (figure 1C). In the open valve state the constriction was not part of the fluidic path and presented no unnecessary challenge to droplet generation due to the increased fluidic resistance of the narrow channel. Water-in-oil droplets were generated using a flow-focusing configuration and transferred to a downstream storage chamber within the multilayered22 PDMS device (details in S1, ESI). Upon valve actuation droplets were driven through the constriction using the continuous phase at a controlled pressure, while the occasional clogging of the narrow constriction was averted by pulsing the retractable channel to remove debris. The microdevices were coupled to a custom confocal fluorescence spectroscopic system as described previously19–21, by loading the chip onto a stage capable of sub-micron positioning of the chip relative to the illumination volume (details in S2, ESI). Two separate optical configurations were used with two different cylindrical lenses (f = 200 mm or f = 300 mm) to expand the illumination volume laterally across the constriction width, while remaining diffraction limited in the other dimensions to maximize signal to noise ratio (SNR).21 These two configurations created detection volumes with 14.3 or 64.6 μm2 cross-sections, respectively (details in S2, ESI). Four separate microdevices were fabricated with constrictions ranging from ~50 – 400 μm2 sized cross-sections, yielding a range of maximum possible molecular detection efficiencies (i.e ratio of the cross sectional areas of the laser illumination and the constriction channel) in traversing droplets from 3.5% to 100%.
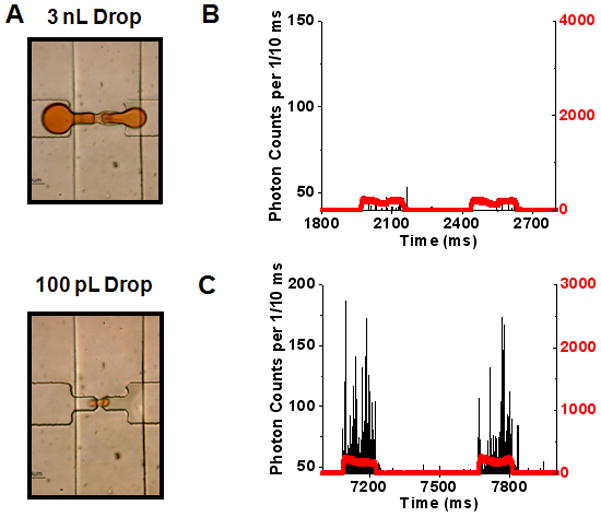
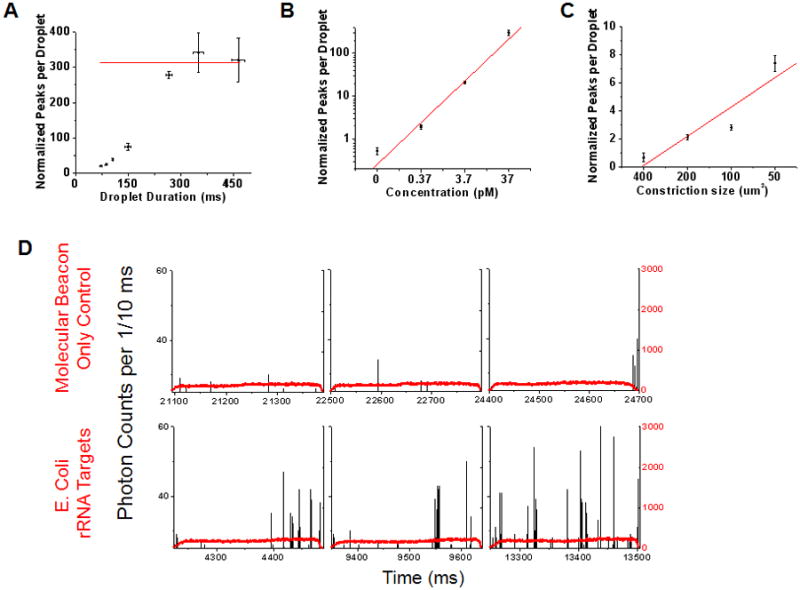
Figure 2A shows that droplets from pL to nL sizes were stretched through the constrictions without droplet break-up. In the initial experiments, TOTO®-3 stained Lambda DNA was used as a model biomolecule. Varying concentrations of DNA were loaded in ~40 pL droplets and run through the 64.6 μm2 illumination volume held within the 200 μm2 constriction. The raw data trace in figure 2B shows the outline of two control droplets (no DNA) running through the constriction (red trace – Fluorescence signal from Alexa 488 droplet indicator dye, black trace – Fluorescence signal from TOTO®-3/DNA; details in S3, ESI). Figure 2C shows the encapsulation and detection of the DNA at 37 pM concentrations. At these higher concentrations, droplet stretching through the constriction becomes increasingly essential as the ~1000 DNA molecules per droplet (37 pM within 44.5 pL) must be resolved within the droplet’s transit time through the CICS volume. Figure 3A shows the effect that droplet transit times had on single molecule counting at 37 pM. Burst counts per droplet approach a maximum value of 312 (red line – average of last three datapoints) at ~280 ms. Droplets that traverse the constriction at a faster pace yield decreasing burst rates. The lost information is a result of non-digital molecular occupancy in the illumination volume and decreased SNRs at faster speeds. However, the 312 average fluorescence bursts per droplet in the plateau region agree well with the expected value (320 bursts for the maximum possible detection efficiency of 32.3%). The small discrepancy from the expected value is attributable to molecular loss into the continuous phase and experimental variation in laser and constriction alignment (details of single molecule data analysis and thresholding in S4, ESI).
Fig 2.

A. Retractable constriction in action: Two very different sized droplets can be seen stretching through the constriction without breakup. B. Sample single molecule trace data for control sample (TOTO®-3 dye only). The discrete phase consisted of 100 nM TOTO®-3 dye along with 100 nM Alexa 488 dye (Indicator dye). The red trace shows fluorescence signal from the indicator dye, while the black trace shows the fluorescence signal from TOTO®-3 dye. C. Similar single molecule trace data with the discrete phase consisting of TOTO®-3 labeled, 37 pM Lambda DNA and 100 nM Alexa 488 dye.
Fig 3.

A. Data showing the effect of droplet transit time on the mass detection efficiency within droplets. The data was obtained using a microfluidic chip (Fig 1C) with a 200 μm2 constriction. The discrete phase consisted of 1 μM TOTO-3, 37 pM Lambda DNA and 100 nM Alexa 488 dye. The number of single molecule fluorescent bursts increase with increasing droplet transit time through the microfluidic constriction, finally reaching a plateau (average value of 312 ± 31.9; red line) at transit times >280 ms. B. SMD-droplet platform response to changing molecular concentrations. Droplets were generated using discrete phase consisting of a range of DNA concentrations and passed through a 200 μm2 constriction for single molecule detection. (Solid line: weighted linear regression, R = 0.989) C. Manipulation of mass detection efficiency within droplets by simply changing the constriction size is demonstrated. As the constriction size decreases, larger sections of each droplet pass through the illumination volume and hence, mass detection efficiency increases. (Solid line: linear regression, R = 0.928) All the experiments were conducted on a CICS setup with detection volume cross section size 64.6 μm2 and DNA concentrations of 0.37 pM (details of data normalization in S4, ESI). D. The tunable nature of the droplet-CICS platform to attain single fluorophore sensitivity is illustrated using a Cy5 molecular beacon complementary to a sequence on 16S rRNA from E coli. The top row shows three representative sample droplets from a ‘molecular beacon (MB) only’ control sample. The black trace shows single molecule data from the Cy5 dye on the MBs. The bottom row shows sample droplets made from the same concentration molecular beacon hybridized with a synthetic target DNA. The average number of single molecule bursts per droplet in the control sample was 0.282 ± 0.11, compared to 9.075 ± 0.76 in the target sample. This experiment was conducted on a chip with a constriction cross sectional area of 200 μm2 and CICS illumination volume of 14.3 μm2. Each data point represents the interpolated y-intercept at zero threshold values from three sets of experiments with standard deviation; see details of single molecule analysis and thresholding in S4, ESI.
In all subsequent experiments, pressures that yielded equal droplet durations through the constriction were selected, yielding equal drop-to-drop acquisition times. This constraint enabled molecular quantification through the expected linear increase in single molecule fluorescent bursts with increasing molecular concentrations (figure 3B). In addition, the ability to mold intradroplet detection efficiencies via alterations in the constriction channel to laser illumination cross-section ratio is apparent in figure 3C. As shown, the average fluorescent bursts per droplet show a linearly increasing trend with decreasing constriction size at equivalent DNA concentrations (maximum possible detection efficiencies of 16.15, 32.3, 64.6, and 100 %; details in S1 and S2, ESI).
The results so far, indicate the effectiveness of the droplet-SMD platform in quantifying low abundance fluorescent biomolecules encapsulated within droplets. However, the utility of the droplet-SMD platform can also be extended to sequence specific nucleic acid assays using common single fluorophore nucleic acid probes.13, 15–18, 20 As shown in figure 3D, a smaller CICS illumination volume (14.3 μm2) was used to increase SNR for single fluorophore studies. At 40 pM concentrations (~1000 molecules per 44.5 pL droplet), Cy5 molecular beacons (MB)20 for E. coli rRNA sequences show few background peaks due to thermal fluctuation of the hairpin probe (Figure 3D top panel; average peaks per droplet 0.282 ± 0.11). However, the presence of target is detectable upon target hybridization as an increase in fluorescence peak counts per drop (Figure 3D bottom panel; average peaks per droplet 9.075 ± 0.76). These single fluorophore studies were performed using a 200 μm2 constriction; however, the smaller constriction sizes used above demonstrate the ability to mold intradroplet detection efficiencies to meet a variety of experimental requirements.
In conclusion, for the first time we have demonstrated direct and amplification-free single molecule detection of biomolecules in sub-nanolitre droplets. As shown, biomolecular quantification using SMD requires only a microfluidic constriction channel for droplet confinement and elongation. Thus, the droplet-SMD microdevice presents a unique alternative to the complex PCR devices currently used for intra-droplet detection. Furthermore, by applying homogeneous probes for single molecule counting we were able to detect nucleic acids using a sequence specific probe. Future integration of the droplet-SMD platform with existing in-drop cell control and lysis techniques1, 2 or single molecule probe schemes13, 15–18 presents a general method for high-throughput single cell analysis.
Supplementary Material
Footnotes
Electronic Supplementary Information (ESI) available: S.1 – Device Fabrication and Operation, S.2 – Experimental Setup for SMD, S.3 – Sample Preparation, S.4 – Single Molecule Data Analysis
Contributor Information
T.D. Rane, Email: tushar@jhu.edu.
C.M. Puleo, Email: cpuleo@jhu.edu.
K.J. Liu, Email: Kelvin@jhu.edu.
Y. Zhang, Email: yzhang68@jhmi.edu.
A.P. Lee, Email: aplee@uci.edu.
Notes and references
- 1.Teh SY, Lin R, Hung LH, Lee AP. Lab Chip. 2008;8:198–220. doi: 10.1039/b715524g. 10.1039/b715524g. [DOI] [PubMed] [Google Scholar]
- 2.Huebner A, Sharma S, Srisa-Art M, Hollfelder F, Edel JB, Demello AJ. Lab Chip. 2008;8:1244–1254. doi: 10.1039/b806405a. 10.1039/b806405a. [DOI] [PubMed] [Google Scholar]
- 3.Chiu DT, Lorenz RM. Acc Chem Res. 2009;42:649–658. doi: 10.1021/ar8002464. 10.1021/ar8002464. [DOI] [PMC free article] [PubMed] [Google Scholar]
- 4.Nie Z, Xu S, Seo M, Lewis PC, Kumacheva E. J Am Chem Soc. 2005;127:8058–8063. doi: 10.1021/ja042494w. 10.1021/ja042494w. [DOI] [PubMed] [Google Scholar]
- 5.Song H, Chen DL, Ismagilov RF. Angew Chem Int Ed Engl. 2006;45:7336–7356. doi: 10.1002/anie.200601554. 10.1002/anie.200601554. [DOI] [PMC free article] [PubMed] [Google Scholar]
- 6.Huebner A, Srisa-Art M, Holt D, Abell C, Hollfelder F, deMello AJ, Edel JB. Chem Commun (Camb) 2007;(12):1218–1220. doi: 10.1039/b618570c. 10.1039/b618570c. [DOI] [PubMed] [Google Scholar]
- 7.Kumaresan P, Yang CJ, Cronier SA, Blazej RG, Mathies RA. Anal Chem. 2008;80:3522–3529. doi: 10.1021/ac800327d. 10.1021/ac800327d. [DOI] [PubMed] [Google Scholar]
- 8.Clausell-Tormos J, Lieber D, Baret JC, El-Harrak A, Miller OJ, Frenz L, Blouwolff J, Humphry KJ, Koster S, Duan H, Holtze C, Weitz DA, Griffiths AD, Merten CA. Chem Biol. 2008;15:427–437. doi: 10.1016/j.chembiol.2008.04.004. 10.1016/j.chembiol.2008.04.004. [DOI] [PubMed] [Google Scholar]
- 9.Schaerli Y, Wootton RC, Robinson T, Stein V, Dunsby C, Neil MA, French PM, Demello AJ, Abell C, Hollfelder F. Anal Chem. 2009;81:302–306. doi: 10.1021/ac802038c. 10.1021/ac802038c. [DOI] [PubMed] [Google Scholar]
- 10.Beer NR, Wheeler EK, Lee-Houghton L, Watkins N, Nasarabadi S, Hebert N, Leung P, Arnold DW, Bailey CG, Colston BW. Anal Chem. 2008;80:1854–1858. doi: 10.1021/ac800048k. 10.1021/ac800048k. [DOI] [PubMed] [Google Scholar]
- 11.Boedicker JQ, Li L, Kline TR, Ismagilov RF. Lab Chip. 2008;8:1265–1272. doi: 10.1039/b804911d. 10.1039/b804911d. [DOI] [PMC free article] [PubMed] [Google Scholar]
- 12.Schmitz CH, Rowat AC, Koster S, Weitz DA. Lab Chip. 2009;9:44–49. doi: 10.1039/b809670h. 10.1039/b809670h. [DOI] [PubMed] [Google Scholar]
- 13.Castro A, Williams JG. Anal Chem. 1997;69:3915–3920. doi: 10.1021/ac970389h. [DOI] [PubMed] [Google Scholar]
- 14.de Mello AJ. Lab Chip. 2003;3:29N–34N. doi: 10.1039/b304585b. 10.1039/b304585b [doi] [DOI] [PubMed] [Google Scholar]
- 15.Li H, Zhou D, Browne H, Balasubramanian S, Klenerman D. Anal Chem. 2004;76:4446–4451. doi: 10.1021/ac049512c. 10.1021/ac049512c [doi] [DOI] [PubMed] [Google Scholar]
- 16.Neely LA, Patel S, Garver J, Gallo M, Hackett M, McLaughlin S, Nadel M, Harris J, Gullans S, Rooke J. Nat Methods. 2006;3:41–46. doi: 10.1038/nmeth825. nmeth825 [pii]; 10.1038/nmeth825 [doi] [DOI] [PubMed] [Google Scholar]
- 17.Yeh HC, Chao SY, Ho YP, Wang TH. Curr Pharm Biotechnol. 2005;6:453–461. doi: 10.2174/138920105775159304. [DOI] [PubMed] [Google Scholar]
- 18.Yeh HC, Ho YP, Shih I, Wang TH. Nucleic Acids Res. 2006;34:e35. doi: 10.1093/nar/gkl021. 34/5/e35 [pii]; 10.1093/nar/gkl021 [doi] [DOI] [PMC free article] [PubMed] [Google Scholar]
- 19.Puleo CM, Yeh HC, Liu KJ, Wang TH. Lab Chip. 2008;8:822-822–825. doi: 10.1039/b717941c. 10.1039/b717941c. [DOI] [PubMed] [Google Scholar]
- 20.Puleo CM, Wang TH. Lab Chip. 2009;9:1065–1072. doi: 10.1039/b819605b. 10.1039/b819605b. [DOI] [PMC free article] [PubMed] [Google Scholar]
- 21.Liu KJ, Wang TH. Biophys J. 2008;95:2964–2975. doi: 10.1529/biophysj.108.132472. 10.1529/biophysj.108.132472. [DOI] [PMC free article] [PubMed] [Google Scholar]
- 22.Unger MA, Chou HP, Thorsen T, Scherer A, Quake SR. Science. 2000;288:113–116. doi: 10.1126/science.288.5463.113. 8400 [pii] [DOI] [PubMed] [Google Scholar]
Associated Data
This section collects any data citations, data availability statements, or supplementary materials included in this article.


