Abstract
Dual-energy x-ray computed tomography (DECT) has the capability to decompose attenuation coefficients using two basis functions and has proved its potential in reducing beam-hardening artifacts from reconstructed images. The method typically involves two successive scans with different x-ray tube voltage settings. This work proposes an approach to dual-energy imaging through x-ray beam filtration that requires only one scan and a single tube voltage setting. It has been implemented in a preclinical microCT tomograph with minor modifications. Retrofitting of the microCT scanner involved the addition of an automated filter wheel and modifications to the acquisition and reconstruction software. Results show that beam-hardening artifacts are reduced to noise level. Acquisition of a μ-Compton image is well suited for attenuation-correction of PET images while dynamic energy selection (4D viewing) offers flexibility in image viewing by adjusting contrast and noise levels to suit the task at hand. All dual-energy and single energy reference scans were acquired at the same soft tissue dose level of 50 mGy.
1. Introduction
Image reconstruction for x-ray computed tomography (CT) is based on the assumption that a monoenergetic x-ray beam is going through matter and is being attenuated according to Beer’s law. Since the most common method of generating x-rays is by bremsstrahlung, the resulting polyenergetic beams violate the assumption. The effects on reconstructed images are beam-hardening artifacts: cupping of uniform regions and streaks between highly attenuating materials such as bone.
Dual-energy x-ray computed tomography (DECT) refers to various imaging methods using projection data acquired with two different x-ray spectra. The simplest DECT methods reconstruct images independently and then use post-reconstruction techniques to combine those images (Brooks 1977). These methods ignore the polyenergetic nature of the x-ray beam and therefore suffer from the same spectral artifacts as standard methods. A more sophisticated approach, proposed by Alvarez and Macovski in their seminal paper (Alvarez and Macovski 1976), decouples the spatial and energy dependences of the attenuation coefficients and is capable of eliminating beam-hardening artifacts. This is the method that was used in this paper.
One method to obtain dual-energy sets of images is to acquire two distinct scans with two different tube voltages. Another option is to use two x-ray tubes and detector systems (typically mounted at 90° from each other) operating simultaneously at different voltages (Coleman and Sinclair 1985). These methods require either multiple data acquisitions or specialized scanner designs. Beam filters have been used in conjunction with tube voltage settings to enhance separation between spectra (Marshall et al 1984). Rutt and Fenster used a single voltage and filters to split a fan beam and obtain dual-energy information (Rutt and Fenster 1980). More recently, new technology allowing fast kVp switching of the x-ray tube makes it possible to use a single scan and alternate kVp between projections (Xu et al 2009, Grasruck et al 2009). One of the challenges with this approach is to estimate the effective spectrum since the voltage changes during the exposure period (Xu et al 2009). This technology is primarily available for clinical applications.
In this work, we focus on preclinical applications and propose an approach that uses a single tube voltage and full-beam filters to obtain dual-energy scans in a single acquisition by alternating filters between successive projections. The method allows retrofitting of existing tomographs through the addition of a filter wheel and a modified data acquisition and image reconstruction algorithm. This relatively simple and economical method may be advantageous to preclinical CT.
2. Materials and methods
2.1. Overview
The proposed method is to acquire one 360° projection scan with a fixed tube voltage while a filter wheel alternates two beam filters between successive projections. One filter provides a ‘soft’ beam while another filter provides a ‘hard’ beam. ‘Hard’ and ‘soft’ projections are then separated to produce two partial scan files with projections at every other acquired angle. The missing projections are recovered by forward projecting reconstructions of partial scan-files, and the final three-dimensional image is reconstructed with the dual-energy algorithm.
A 2 mm Al filter and a 50 μm Mo filter were selected to produce a ‘soft’ and a ‘hard’ beam, respectively. The Al filter screens out very low energy x-rays while the Mo filter was selected because of the location of its K absorption edge at 20 keV. The K-edge greatly reduces the Mo spectrum above 20 keV and maximizes the difference between Al and Mo spectra. To compensate for the heavy attenuation of the Mo filter and obtain a suitable photon flux, the x-ray tube voltage was increased to 80 kVp, which is the maximum setting on our microCAT II preclinical scanner (Siemens Preclinical Solutions, Knoxville, TN). Both spectra were measured with a CdTe detector model XR-100T (Amptek, Bedford, MA) and are shown in figure 1. The spectra have significant overlap; however, the difference in the 20–50 keV region proved to be sufficient for using the dual-energy method.
Figure 1.
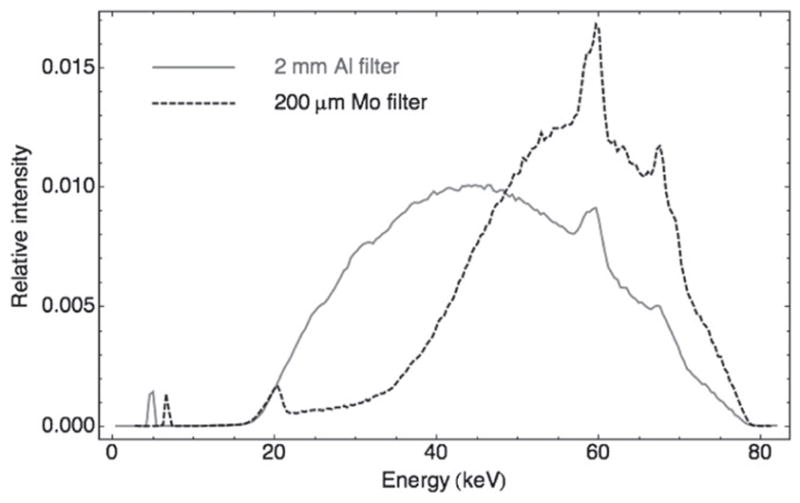
Measured x-ray energy spectra at 80 kVp with 2 mm aluminum (solid line) and 200 mm molybdenum (dashed line) filters. The average energy is 46.4 and 55.4 keV for the Al and Mo filters, respectively.
The camera in the CT scanner was a 4064 axial × 4096 transaxial array with a pixel size of 31.6 μm. All scans were performed with a hardware pixel binning of 4 × 4 with an additional software binning of 2 × 2 before reconstruction for an effective pixel size of 252.8 μm (31.6 μm × 4 × 2). A magnification factor of 1.259 yielded a reconstructed voxel size of 200 μm (252.8 μm/1.259) in three-dimensional images.
Beam filters were supported by an automated filter wheel (model RPFMAX, DTA srl, Pisa, Italy) that alternated filters when the gantry moved between projections. The filter wheel was held in front of the x-ray source by a custom-made bracket attached to the gantry. Cables were run from the filter wheel out of the scanner through an existing flexible plastic guide (‘snake’) housing other existing cables. The filter wheel was controlled by sending simple ASCII commands via a RS232 serial interface.
2.2. Theoretical background
The method of Alvarez and Macovski is based on the decomposition of attenuation coefficients into a linear combination of a pair of energy-dependent basis functions, weighted by spatially dependent coefficients. With this method, energy and spatial dependence are decoupled.
In the simplest image-formation model, the relative image intensity pm from a given x-ray energy spectrum sm(E) measured at a given pixel in the detector is
| (1) |
with m ∈ {1, 2} representing the measurements with hard and soft spectra respectively. The energy-dependent attenuation coefficient μ(x, y, z, E) at location (x, y, z) was expressed as a linear combination of two energy-dependent basis functions f1(E) and f2(E), weighted by location-dependent coefficients w1(x, y, z) and w2(x, y, z):
| (2) |
Introducing equation (2) into equation (1) and inverting the order of the integral and the sum in the exponent, we obtain
| (3) |
Furthermore, we can discretize the energy E into N values at 1 keV intervals. Using the discretized form for the energy E, the integral becomes a sum and by posing ai = ∫wi (x, y, z) ds, with i = 1, 2, the last equation can be rewritten as
| (4) |
which can be further simplified by posing Sm,n = sm(En) and Fn,i = fi(En):
| (5) |
or in matrix form
| (6) |
In equation (6), p is the two-component column vector of the measured intensities for a given pixel (one value per spectrum), F is the pre-calculated N × 2 basis matrix (N discrete energies and values for both basis functions), S is the pre-calculated 2 × N energy spectra matrix (two spectra and N discrete energies), and a, the only unknown, is a two-component column vector representing the sum of all basis coefficients for each of the two basis functions at that pixel in the projection.
If equation (6) can be inverted to obtain a from the measurements p, then a can be used to reconstruct the three-dimensional distribution of the basis coefficients wi, with beam-hardening artifacts reduced to noise level. It is then a simple matter to recover the attenuation coefficients μ from wi through equation (2). Unfortunately, direct inversion of equation (6) is not practically feasible given the ill-posedness of the problem. In their paper, Alvarez and Macovski used a fit to a logarithmic function to approximately invert the equation. We propose to use a root-finding algorithm to calculate an exact inversion. This is possible because a(p) is a well-behaved function in the domain of interest of p (see figure 8).
Figure 8.
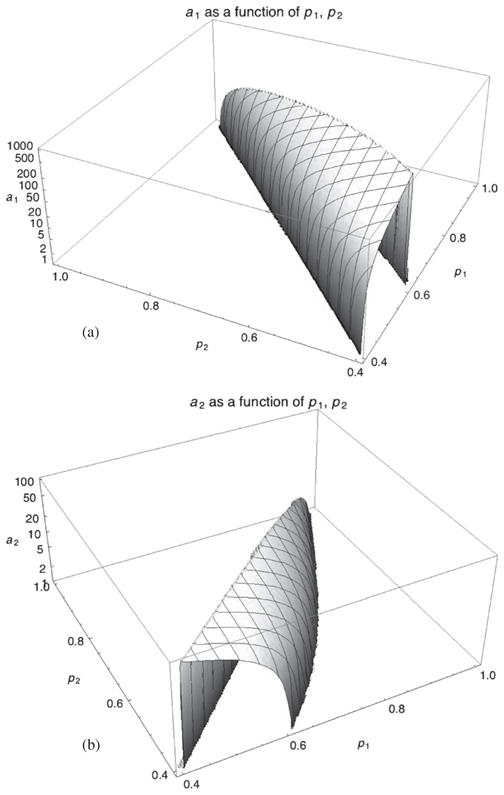
Surface plot of the components of the a(p) mapping, (a) the photoelectric component a1(p1, p2) and (b) the Compton component a2(p1, p2). In practice, the useful domain lies in (p1 ≥ 0.5, p2 ≥ 0.5) where the surface is smooth, which allows a gradient search. The high gradient of a1 amplifies contrast and noise during mapping.
We first define the residual vector gk at iteration k as being the difference between the actual measured intensity p at a given pixel and the calculated intensity from our estimate ak of a at iteration k. From equation (6), we obtain
| (7) |
The goal is to find the value of a that will set g equal to zero. Using the Raphson–Newton method for root finding (see for example Press et al 1992), we obtain a recursion equation to update the value of a at iteration k:
| (8) |
where (Jk)−1 is the inverse of the 2 × 2 Jacobian matrix Jk, whose components are given by
| (9) |
The inverse of the Jacobian matrix can easily be calculated using the well-known formula for matrix inverse:
| (10) |
where det(.) is the determinant, cof(.) is the cofactor matrix and (.)T denotes the transpose operation. Because of the well-behaved nature of the function (equation (7)) used to calculate the residual vector g, we observed that for the vast majority of pixels, root finding took less than ten iterations to find a solution within machine precision.
The two basis functions used in the model (equation (2)) are weighted versions of the photoelectric and Compton (Klein–Nishina) total cross-sections expressions:
| (11) |
| (12) |
where E is the photon energy in keV, and γ = E/511 keV. The exponent 3.05 in equation (11) was obtained by curve-fitting photon cross-section data from the National Institute of Standards and Technology (NIST)1. Other basis functions can also be used, see for example Williamson et al (2006).
2.3. Image reconstruction
To use the method described in the previous section, two projections (from the two different spectra) and from the same angle are required. Because beam quality filters (spectra) alternate between projections, only one projection per angle is available, either soft or hard; the other one is missing. Missing projections for each angle are recovered by forward projecting a 3D reconstructed image from soft-only or hard-only projections. The series of steps involved in the reconstruction of the final image are as follows:
separation of even (low-energy) and odd (high-energy) projections from the set of acquired data;
3D reconstruction of low- and high-energy images using the Feldkamp–Davis–Kress (FDK) reconstruction algorithm (Feldkamp et al 1984);
forward projection of low- and high-energy 3D images at every angle (360 projections) using our implementation of Siddon’s algorithm (Siddon 1985);
conversion from intensity projections to photo-electric (PE) and Compton coefficients integrals (as described in the previous section);
3D reconstruction of basis-coefficient images using the FDK algorithm;
calculation of the final attenuation coefficient image at a given energy E using equation (2).
Although in theory any energy can be chosen for reconstruction, noise and contrast issues come into play (see results and discussion) and one has to select the energy that suits best one’s purpose. The total processing time is about 20 min for dual energy as opposed to about 3 min for a regular scan.
2.4. Acquisition and image quality assessment
Image quality was assessed by comparing DECT scans with reference scans with various phantoms and by using three figures-of-merit: (a) the intensity of beam hardening artifacts, (b) the in-plane image resolution, as expressed by the modulation transfer function (MTF), and (c) the contrast-to-noise ratio.
Routine microCT scans at our institution give a soft tissue radiation dose of about 50 mGy. This level is a trade-off between imaging needs (beam hardening, contrast) and potential harm or perturbations caused to the animal, especially when longidutinal studies are performed (Taschereau et al 2006). Accordingly, the radiation dose for dual-energy scans was also constrained to the same level, and all scans performed in this study gave a radiation dose of 50 mGy.
Reference scans were obtained at 70 kVp with a 2 mm Al filter, an x-ray tube current of 500 μA and 360 projections at 500 ms exposure in 1° angle intervals. FDK reconstruction was used with a voxel size of 0.2 mm × 0.2 mm × 0.2 mm. DECT scans were obtained as follows: 360 projections in 1° intervals and at a constant x-ray tube voltage of 80 kVp and constant tube current of 500 μA, alternating 2 mm Al and 200 μm Mo filters between projections. Exposure times were 400 ms and 2840 ms for Al and Mo filters, respectively. Reconstruction was performed as described in the previous section with a voxel size 0.2 mm × 0.2 mm × 0.2 mm. The total scan time was broken down as follows:
where the camera transfer time was about 1 s. Hence, for 360-exposure scans there was a fixed transfer time of 6 min. Regular scans took 9 min (transfer time plus 3 min exposure time) and dual-energy scans took 15 min (transfer time plus 9 min exposure time).
It is worth pointing out that comparisons performed in this study might favor regular scans, especially in terms of contrast and noise. The lower 70 kVp setting used for standard single-energy scans will provide better tissue contrast since photon cross-sections are more differentiated at lower energies. Also, the detective quantum efficiency (DQE) of the x-ray detector (a thin layer of gadolinium oxysulfide) is higher for the standard scan, resulting in less noisy scans. This is because the photo-electric cross-section of gadolinium is about 40% higher at 70 keV than at 80 keV.
The reason for using 80 kVp for dual-energy scans was to compensate for Mo filter attenuation by an increased photon flux to keep overall acquisition time within practical limits. An x-ray tube accepting a higher current would have allowed using the same kVp setting.
For beam-hardening assessment, the phantom used was a hollow polymethyl methacrylate (PMMA) cylinder filled with water. Phantom dimensions were 5 cm outer diameter, 4.7 cm inner diameter and 7 cm long. Four pieces of plastic bone (CIRS, Norfolk, VA) of approximate dimensions of 5 mm × 5 mm × 35 mm were placed inside the water-filled phantom. This phantom is known to create beam-hardening artifacts (cupping, streaks) when scanned with the polyenergetic reference beam. For resolution measurements, a 1 mm thick, 4 mm wide and 10 cm long piece of plastic-bone was imaged. The edge method (Cunningham and Reid 1992) for MTF measurements was used and the following edge spread function model was fitted to the right edge profile:
| (13) |
where erfc(·) is the complementary error function. The derivative of m(x) is the point spread function and its Fourier transform is the modulation transfer function (MTF).
Finally, a 3 cm diameter plastic centrifugal tube filled with water and fat (shortening made from palm oil) was used to measure contrast between fat and water.
3. Results
Figure 2 shows single transverse slices of the PMMA–water–bone phantom from (a) the reference scan and (b) the dual-energy scan. As a qualitative assessment of the two images, we notice that streaks between bone inserts that are apparent in the reference image have disappeared in the dual-energy scan.
Figure 2.
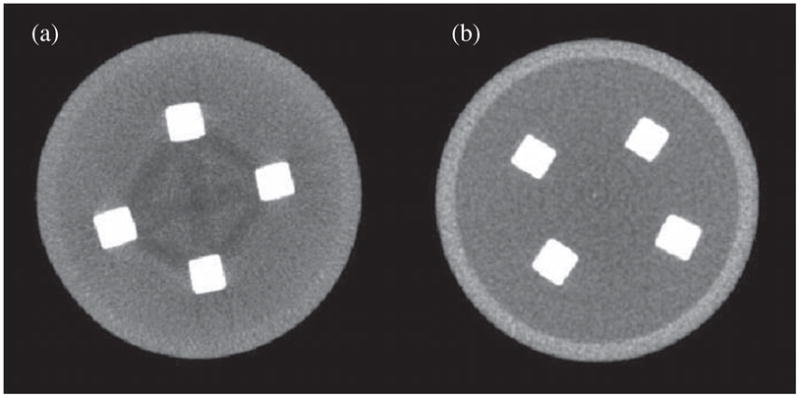
Transverse views of the PMMA–water phantom with plastic-bone inserts: (a) reference scan (mono-energy 70 kVp, 2 mm Al filter), (b) dual-energy scan reconstructed at 45 keV. Streak artifacts between bone inserts (caused by beam hardening) can clearly be seen in the reference scan but are visually absent in the dual-energy scan. Both scans deliver the same dose (50 mGy) to the phantom. The voxel size is 0.2 mm × 0.2 mm × 0.2 mm. The display window was chosen to adapt to the histogram of each data set: the window is centered at the middle hump in the histogram (the bulk of gray pixels) and the window width is three times the width of the hump defined as the full-width at tenth-maximum.
A summary of measurements is shown in table 1. For measurement of beam-hardening artifacts, several central transverse slices of reconstructed 3D images were averaged to reduce noise, and line profiles were drawn across the phantom below the central axis, avoiding bone inserts (figure 3). The part of the profile corresponding to water (in between PMMA walls) was extracted from the curve and a parabola model (to match the cupping artifact) was fitted to the data. The ratio of the value of the parabola at the edge over the value at the center gave the magnitude of the beam-hardening artifact. The measured values were 10% and 3% for the reference and dual-energy scans, respectively. This represents a reduction by a factor of about 3 for the cupping artifact.
Table 1.
Comparison of DE and reference scans.
| Figure-of-merit | DE scan | Reference scan |
|---|---|---|
| Resolution (MTF at 10%) | 1.54 lp mm−1 | 1.70 lp mm−1 |
| Contrast-to-noise ratio | 6.3 | 10.1 |
| Beam-hardening artifact | 3.0% | 10.0% |
Figure 3.
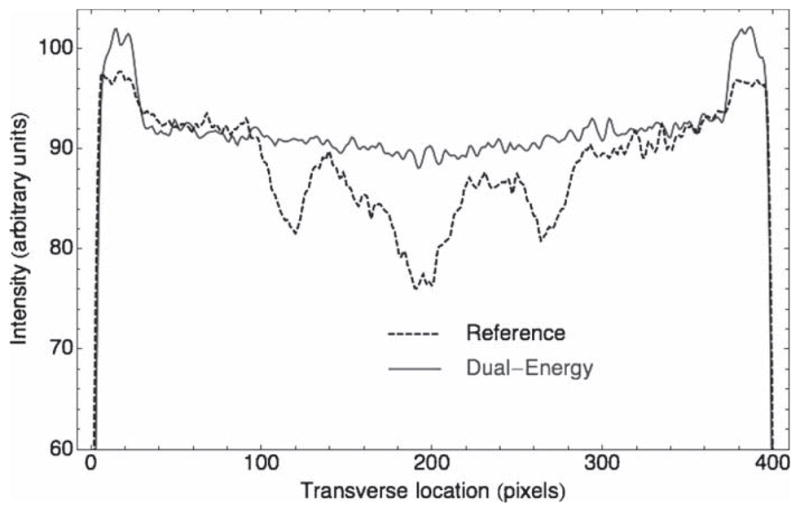
Transverse intensity profiles on the reference scan (dotted line) and the dual-energy (DE) scan (solid line). The ratio of the intensity at the edge over the intensity at the center characterizes the so-called cupping artifact. Expressed in percentage, the cupping artifact was found to be 10% and 3% for the reference scan and the DE scan, respectively.
MTF measurements are shown in figure 4. The value of the MTF at 10% contrast is 1.70 and 1.54 line-pairs per mm (lp/mm) for the reference scan and the dual-energy scan, respectively. This 10% loss of resolution observed with the DE scan is mainly attributable to multiple back- and forward-projection steps and the blurring filter used during the reconstruction process. Missing angles (in the DECT scan) seem to have little impact on image resolution since a reference scan reconstructed with only half the views showed less than 1% degradation on the MTF at 10% with respect to a full reconstruction.
Figure 4.
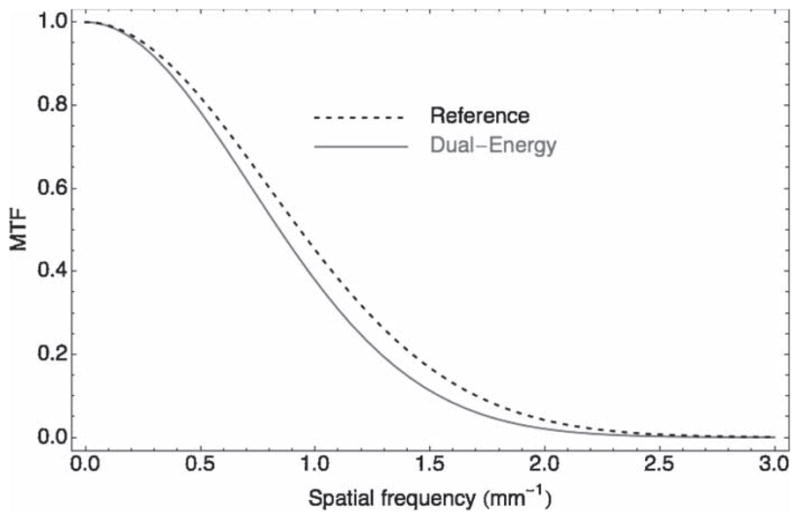
Modulation transfer function (MTF) for the reference scan (dashed line) and the dual-energy (DE) scan (solid gray line). The value of the MTF at 10% is 1.70 (line-pairs per mm) and 1.54 for the reference scan and the DE scan, respectively. This 10% loss of resolution observed with the DE scan is mainly attributable to multiple back- and forward-projection steps and blurring filters in the image reconstruction process.
To perform fair comparisons of noise and contrast, reference scans were blurred by a Gaussian filter (σ = 0.1 mm) to bring the resolution (MTF) to the level of that of dual-energy scans. Regions-of-interest (ROIs) were drawn on 3D images with the Amide visualization software (Loening and Gambhir 2003). Care was taken to make regions about the same number of pixels in order to have comparable statistics. Measurements were made within ROIs and between pairs of substances: PMMA and water, and fat and water.
Relative noise within an ROI was measured as the ratio of the standard deviation over the mean. Relative contrast between two substances was measured as the ratio of the absolute value of the difference between the means over the smallest mean.
The contrast-to-noise ratio (CNR) was calculated with the following equation:
| (14) |
where X̄ and Ȳ are the mean values from two ROIs and σx and σy are the standard deviations.
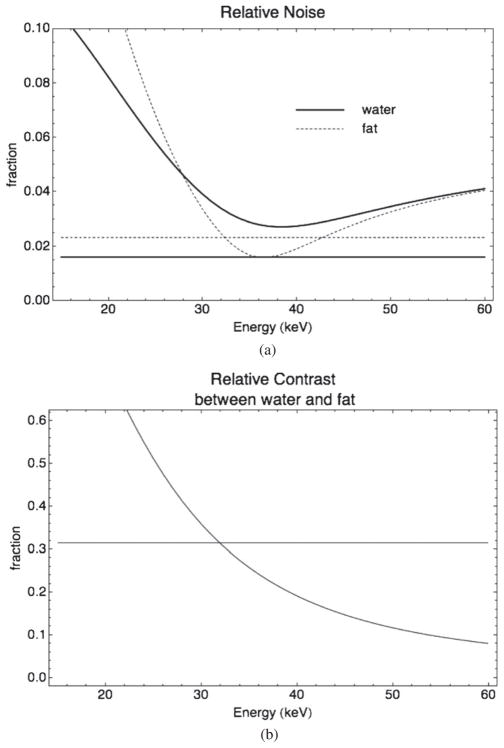
Several plots are shown in figure 5 showing the energy dependence of noise, contrast and CNR measured in reconstructed images at various energies. We observe the following.
Figure 5.
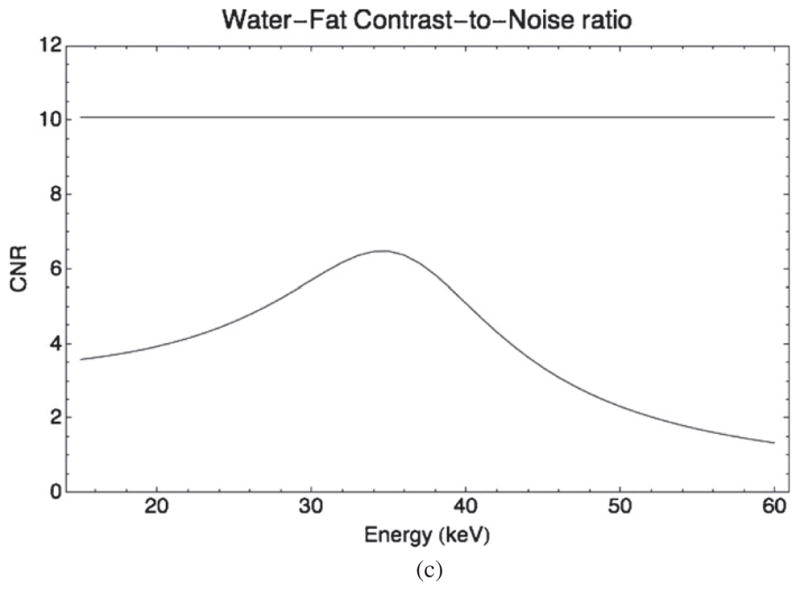
(a) Relative noise in fat (dashed lines) and water (solid lines) regions as a function of energy for the DE scan (curves) compared to the reference 70 kVp (straight lines). (b) Relative contrast between fat and water regions as a function of energy for the DE scan (curve) compared to the reference 70 kVp (straight line). (c) Contrast-to-noise ratio of water over fat as a function of energy for the DE scan (curve) compared to the reference 70 kVp (straight line).
Contrast between water and fat decreases with increasing energy, since contrast is due to differences between μ, which also decreases with increasing energy.
Contrast is higher in the DE scans at reconstructed energies below 30 keV.
Noise and CNR do not have monotonic dependence on energy and reach an optimum point around 35 keV. At that point, relative noise in DE scans is at its lowest. The CNR is higher in the reference scan (10.1 versus 6.3) at that energy. This optimal energy is not the only useful reconstruction energy; it was found useful to use pairs of reconstructed images (e.g. 25 and 35 keV) simultaneously to offer high contrast in addition to the best CNR.
Figure 6 shows central coronal slices of a mouse scan reconstructed at energies between 25 and 60 keV. It can be seen that greater contrast is achieved at lower energies. Materials for which attenuation is similar at a given energy (e.g. PMMA and water at 30 keV or water and fat at 50 keV) offer poor contrast with ordinary scans. Dual energy can improve contrast by selecting an appropriate reconstruction energy.
Figure 6.
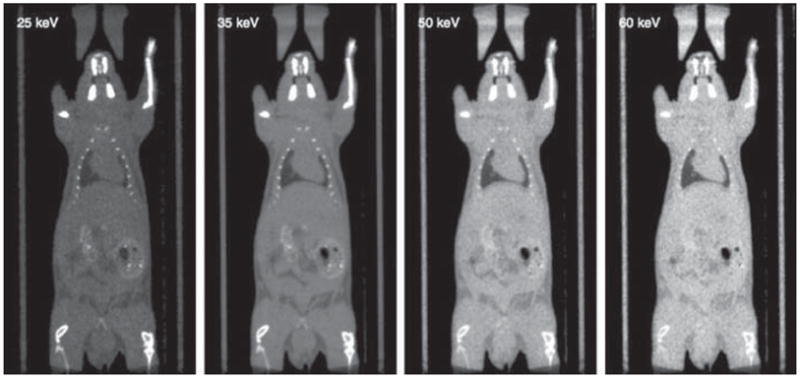
Coronal slices from a dual-energy scan of a mouse. From left to right, reconstruction at 25, 35, 50 and 60 keV. The display window is set to correspond to the 50th (min) and 99th (max) percentile of the data in each panel.
4. Discussion
Creating a final μ-image is a simple matter of recovering attenuation coefficients with equation (2), i.e. mixing w1 and w2 in proportions corresponding to the desired energy. For example, a μ-image at 35 keV (see figure 6) is a mixture of approximately 30% w1 and 70% w2. It is thus instructive to look at w1 and w2 images separately to understand the behavior of noise and contrast.
Figure 7 shows coronal slices of the fat–water phantom from w1 and w2 images. In the w1 image, noise in fat and water is 27% and 13%, respectively; in the w2 image, noise is 5% (in comparison to 1.5–2% noise in the blurred reference image). Contrast between water and fat is 137% compared to 31% in the reference scan. Noise and contrast behavior—both more pronounced in w1 than in w2—can be understood by looking at the mapping process a(p), from projection image intensity p to sum of basis coefficients a.
Figure 7.
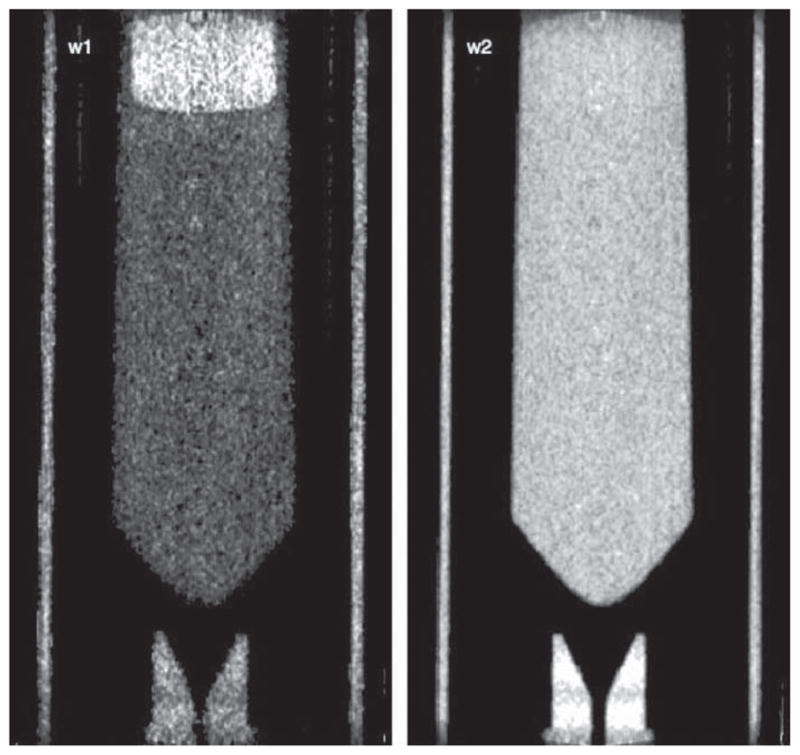
Coronal slices of the two components of the dual-energy reconstruction: w1, the photoelectric image, and w2, the Compton image from the water–fat phantom. The display window is set to correspond to the 50th (min) and 99th (max) percentile of the data in each panel.
The mapping from raw projection data vectors (p1, p2) to basis-coefficients integrals (a1, a2) is done with recursive equation (8). Graphs of that mapping are shown on a logarithmic scale in figure 8 for each component; in (a), a1 is shown as a function of (p1, p2) and in (b), a2 as a function of (p1, p2). The graphs use different scales: a1 ranges from 0 to 885 while a2 ranges from about 0 to about 80.
The strongest gradient is with a1, which confers greater contrast to the w1 image over the w2 image but also amplifies noise. In the region of interest (p1 ≥ 0.5, p2 ≥ 0.5), gradients are in opposite directions. As a result, noise is reduced when mixing w1 and w2 as is the case when creating the final μ-reconstructed image. For example, for an image reconstructed at 35 keV, noise is in the 1–3% range. Both mappings exhibit smooth behavior, which allows the iterative mapping process to be precise and fast and not contribute additional noise.
The overall behavior of the a(p)mapping—higher gradient in w1 and gradients going in opposite directions—is a natural consequence of the energy dependence of photoelectric and Compton attenuation coefficients. Photoelectric attenuation coefficients (w1) have stronger energy dependence than Compton (w2) and also have opposite relationships with respect to energy.
The mapping domain shown in figure 9 is a relatively narrow band that lies below the diagonal p2 = p1. This figure is a scatter plot of actual (p1, p2) points from the water–fat phantom. The width of the domain, which influences the gradient and resulting noise, is controlled by the separation between spectra. The wider the separation between the two spectra, the larger the mapping domain and the lower the gradient and noise amplification. The current method of using filters with the same peak voltage to obtain different spectra can only achieve limited separation; hence, some noise amplification is inevitable. Although in theory all points should be below the diagonal p2 = p1, in the region where there is little attenuation some points lie above it. This can be attributed to scatter, noise, lower detector DQE at 80kVp and the method used to recover missing data.
Figure 9.
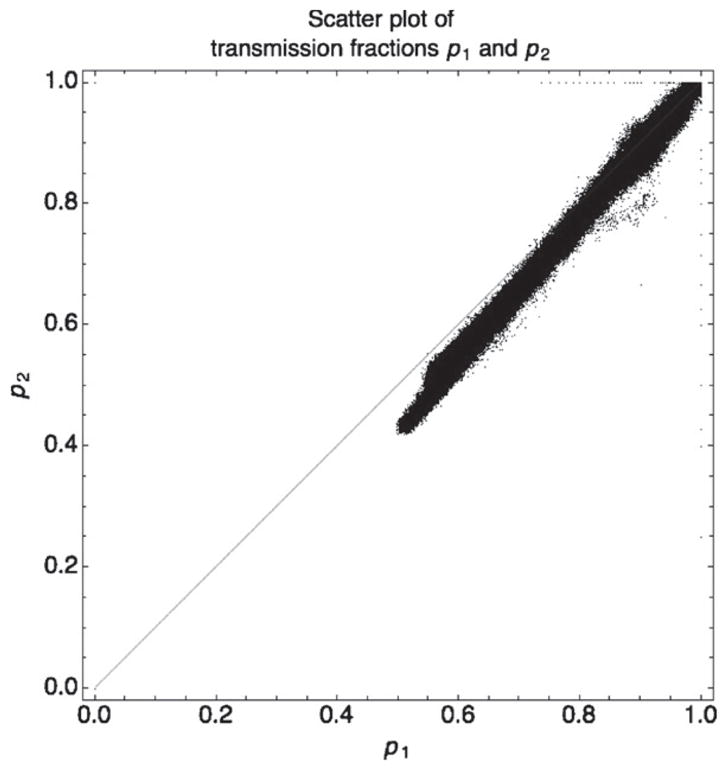
Scatter plot of actual transmission fractions p1 (high-energy projection pixel values) and p2 (low-energy projection pixel value) from the fat–water phantom. Since attenuation for the high-energy beam is less than the attenuation for the low-energy beam, the value of p1 should always be greater than p2, i.e. in theory all (p1, p2) pairs should lie under the diagonal p1 = p2. In practice, due to scatter and noise some pairs lie above that diagonal, especially at low attenuation.
A final remark concerns the use of CT images to create attenuation maps for PET attenuation correction (Chow et al 2005, Kinahan et al 2006). Attenuation correction of PET images requires a 3D map of attenuation coefficients at 511 keV. Such an image can be obtained by a transmission scan on the PET scanner. However, since a CT scan is often being performed in conjunction with the PET scan, it is convenient to use this scan instead to create a μ-map at 511 keV. Standard methods have to extrapolate attenuation coefficients from their values at CT energies to values at 511 keV, a nonlinear process exacerbated by the polychromatic nature of the x-ray beam, and μ-maps obtained by this method are only approximate.
At 511 keV, Compton scattering is the dominant interaction for photons (>99%) and the change in the Compton cross-section from 80 keV to 511 keV is about the same for water and bone (56% and 52%, respectively). As a result, it is possible to use the attenuation coefficient model (equation (2)) to obtain a good estimate of the μ-map at 511 keV by scaling the w2 image of Compton coefficients. Using the fat–water phantom as an example and by looking at the reference scan and the Compton image, one can see that a significant error would be made by extrapolation since μ differences between fat and water are nonexistent at 511 keV. Therefore, dual-energy acquisition and reconstruction also provide a more accurate solution to the attenuation correction problem from x-ray CT than previous methods.
5. Conclusion
A practical implementation of a dual-energy method using differential filtration has been proposed that required minimal hardware changes and allowed retrofitting of our existing preclinical tomograph. The benefits from DE scans are (a) the significant reduction of beam-hardening artifacts, (b) a μ-Compton image ideal for attenuation-correction of PET images and (c) dynamic contrast and noise level adjustments through energy selection.
For the same radiation dose to the subject and at the cost of a 10% loss in resolution, beam-hardening artifacts were reduced by a factor of 3. The contrast-to-noise ratio was enhanced or degraded depending on materials and reconstruction energy considered. Through the selection of reconstructed energy, various contrast and noise levels can be obtained and the user can choose what is appropriate for the specific application. Depending on the specifics of the experiment, one might be more important than the other.
The filter wheel approach is relatively simple and economical and may be the most advantageous to preclinical CT. For clinical CT, it is possible that this technique be combined with fast kVp switching to improve spectra separation.
In future work we will investigate the performance and sensitivity of the method with regard to spectra separation and spectra estimation. We will also be developing software to view DE scans as four-dimensional images (the fourth dimension being energy) so that microCT images can be viewed in three spatial dimensions while dynamically changing energy to alter contrast and noise characteristics. Finally, the effect of contrast agents on DE scans will be investigated.
Acknowledgments
The authors wish to thank Dr D Stout, director of the Preclinical Imaging Center at the Crump Institute for his support and JA Edwards, W Ladno, and B Chun for technical support. This work was supported by a grant from the National Institutes of Health (SAIRP NIH-NCI 2U24 CA092865).
Footnotes
References
- Alvarez RE, Macovski A. Energy-selective reconstructions in x-ray computerized tomography. Phys Med Biol. 1976;21:733–44. doi: 10.1088/0031-9155/21/5/002. [DOI] [PubMed] [Google Scholar]
- Brooks RA. A quantitative theory of the Hounsfield unit and its application to dual energy scanning. J Comput Assist Tomogr. 1977;1:487–93. doi: 10.1097/00004728-197710000-00016. [DOI] [PubMed] [Google Scholar]
- Chow PL, Rannou FR, Chatziioannou AF. Attenuation correction for small animal PET tomographs. Phys Med Biol. 2005;50:1837–50. doi: 10.1088/0031-9155/50/8/014. [DOI] [PMC free article] [PubMed] [Google Scholar]
- Coleman A, Sinclair M. A beam-hardening correction using dual energy computed tomography. Phys Med Biol. 1985;30:1251–56. doi: 10.1088/0031-9155/30/11/007. [DOI] [PubMed] [Google Scholar]
- Cunningham IA, Reid BK. Signal and noise in modulation transfer function determinations using the slit, wire, and edge techniques. Med Phys. 1992;19:1037–44. doi: 10.1118/1.596821. [DOI] [PubMed] [Google Scholar]
- Feldkamp LA, Davis LC, Kress JW. Practical cone-beam algorithm. J Opt Soc Am. 1984;1:612–19. [Google Scholar]
- Grasruck M, et al. Dual energy with dual source CT and kVp switching with single source CT: a comparison of dual energy performance. Proc SPIE. 2009;7258:72583R. [Google Scholar]
- Kinahan PE, Alesio AM, Fessler JA. Dual energy CT attenuation correction methods for quantitative assessment to cancer therapy with PET/CT imaging. Technol Cancer Res Treat. 2006;5:319–27. doi: 10.1177/153303460600500403. [DOI] [PubMed] [Google Scholar]
- Loening AM, Gambhir SS. AMIDE: a free software tool for multimodality medical image analysis. Mol Imaging. 2003;2:131–7. doi: 10.1162/15353500200303133. [DOI] [PubMed] [Google Scholar]
- Marshall W, Hall E, Doost-Hoseini A, Alvarez R, Macovski A, Cassel D. An implementation of dual-energy CT scanning. J Comput Assist Tomogr. 1984;8:745–49. doi: 10.1097/00004728-198408000-00029. [DOI] [PubMed] [Google Scholar]
- Press WH, Tukolsky SA, Vellerling WT, Flannery BP. Numerical Recipes in C. 2. Cambridge: Cambridge University Press; 1992. pp. 379–81. [Google Scholar]
- Rutt B, Fenster A. Split-filter computed tomography: a simple technique for dual energy scanning. J Comput Assist Tomogr. 1980;4:501–9. doi: 10.1097/00004728-198008000-00019. [DOI] [PubMed] [Google Scholar]
- Siddon RL. Fast calculation of the exact radiological path for a three-dimensions CT array. Med Phys. 1985;12:252–5. doi: 10.1118/1.595715. [DOI] [PubMed] [Google Scholar]
- Taschereau R, Chow PL, Chatziioannou AF. Monte Carlo simulations of dose from microCT imaging procedures in a realistic mouse phantom. Med Phys. 2006;33:216–24. doi: 10.1118/1.2148333. [DOI] [PMC free article] [PubMed] [Google Scholar]
- Williamson JF, Li S, Devic S, Whiting BR, Lerma FA. On two-parameter models of photon cross sections: application to dual-energy CT imaging. Med Phys. 2006;33:4115–19. doi: 10.1118/1.2349688. [DOI] [PubMed] [Google Scholar]
- Xu D, et al. Dual energy CT via fast kVp switching spectrum estimation. Proc SPIE. 2009;7258:72583T. [Google Scholar]


