Abstract
Background
A preliminary animal study was performed to determine if hepatic micrometastases from uveal melanoma secrete vascular endothelial growth factor (VEGF) that is measurable in serum.
Methods
We analysed the serum of a C57Bl/6 mouse model of uveal melanoma (n=10) at days 4, 7, 14 and 21 post-inoculation for VEGF levels. We compared the serum VEGF levels with the number and location of hepatic micrometastases and their respective expression of VEGF mRNA.
Results
Serum VEGF levels rose after inoculation of C57Bl/6 mice eyes with B16LS9 cutaneous melanoma cells. Beginning on day 14 there was a statistically significant (p<0.05) increase in VEGF levels, rising to an average peak level of 37.985 pg/ml at day 21. Peak serum VEGF levels correlated with the total number of hepatic micrometastases (R=0.444) and there was moderate correlation of peak VEGF serum levels with micrometastases in more hypoxic locations (R=0.572). VEGF mRNA expression by micrometastases was highest in the most hypoxic regions of the hepatic lobule.
Conclusions
Hepatic micrometastastic melanoma arising in a mouse model of ocular melanoma secretes VEGF. The number and location of the micrometastases correlate with serum VEGF levels.
Keywords: Pathology, neoplasia
Introduction
Uveal melanoma is the most common primary malignant intraocular tumour in adults. In addition, up to 40% of patients die within 5 years, usually due to hepatic micrometastases.1 2 The most common sites of metastases are the liver (93%), lung (24%) and bone (16%), with 87% of patients with metastasis having multiple sites involved.3 Increased size of tumour has been associated with a worse prognosis.
Metastatic spread occurs haematogenously and we have previously reported that murine uveal melanoma cells express and secrete VEGF both locally and at distant sites of metastasis.4 Others have also noted local VEGF secretion within human uveal melanoma.5 VEGF secretion stimulates angiogenesis and can enhance metastatic potential. Ascierto and co-workers observed that higher levels of VEGF expression in serum were associated with shorter disease-free survival intervals in cases of cutaneous melanoma, but did not correlate this directly with the presence of metastases.6 Cutaneous melanoma usually spreads via lymphatics as opposed to the virtually exclusive haematogenous spread of uveal melanoma. Inhibition of VEGF may prevent or slow the metastatic potential of a recently diagnosed and treated uveal melanoma.7 We believe that it would be beneficial to detect VEGF levels in the serum of patients with uveal melanoma and correlate this to the potential for metastases or even the presence of difficult to detect micrometastases. This may allow for the early treatment of undetectable micrometastases and prolongation of survival. Previous studies have evaluated VEGF expression levels in ocular tissues in eyes with uveal melanomas.8–10 In this study, we evaluate the VEGF expression in sera from mice inoculated with intraocular melanoma and correlate this with the number and location of hepatic micrometastases.
Materials and methods
B16LS9 cells (courtesy of D. Rusciano, Friedrich Miescher Institut, Basel, Switzerland) were derived from cutaneous melanoma cells; they express high levels of c-met and metastasise to the liver.11 This melanoma cell line resembles a highly aggressive metastatic uveal melanoma. There are no other reproducible non-immune suppressed animal models of uveal melanoma metastatic to the liver. Therefore, this is the best currently available model of hepatic micrometastatic melanoma from the eye in a non-immune suppressed animal. Detailed characteristics of this cell line including the number of passages are described elsewhere.11–13
All experiments were conducted in accordance with the Declaration of Helsinki and Guiding Principles in the Care and Use of Animals. Eight-week old female C57BL/6 mice were used (Jackson Laboratories, Bar Harbor, Maine, USA). Frozen cells were thawed and resuspended in 15 ml of minimum essential medium (MEM) supplemented with fetal calf serum, l-glutamine and sodium bicarbonate. The cell suspensions were centrifuged and the pellet was washed and resuspended in 15 ml of supplemental MEM. Once grown to confluence, the cells were trypsinised, divided into aliquots, and washed three times in 5 ml of Hanks' balanced salt solution. An aliquot of 10 μl of suspension was placed in a haemocytometer (AO; Buffalo, New York, USA) to calculate the concentration of melanoma cells.
Aliquots of 2×10⁵ cells/μl were inoculated into the posterior compartment (PC) of the right eyes of 12-week-old female C57Bl6 mice (n=10) using a method previously described.14 Briefly, the mice were anaesthetised with intramuscular (IM) ketamine hydrochloride 0.66/mg/kg and the tip of a 10 μl glass syringe with a blunt metal needle (Hamilton, Reno, Nevada, USA) was introduced via a trans-corneal tunnel that had been prepared with a 30 gauge needle. A 5.0 μl suspension of cells was inoculated into the posterior compartment of the right eye with no tumour cell reflux. The right eye was enucleated 7 days after inoculation. Control mice were inoculated as above with phosphate buffered saline (PBS), and were also enucleated on day 7. Blood was taken from the tail vein at post-inoculation day 4, 7, 14 and 21. All mice were enucleated at day 7 and killed on day 21. Whole blood was spun down and the serum was separated and frozen separately at −70°C for group analysis. Harvested serum was analysed for the presence of VEGF expression by ELISA (R&D Systems, Minneapolis, Minnesota, USA) and quantified against a standard control.
The right eyes were routinely processed for light microscopic examination. Serial 5 μm thick sections were stained with haematoxylin and eosin and evaluated for the presence and location of melanoma. The livers were grossly examined, submitted in 4% neutral buffered formaldehyde, and processed for light microscopic examination. Three sections through the centres of the livers were microscopically examined (Olympus BX41, Tokyo, Japan) for the presence of micrometastases (<100 μm diameter) and the average number of micrometastases per section were determined.
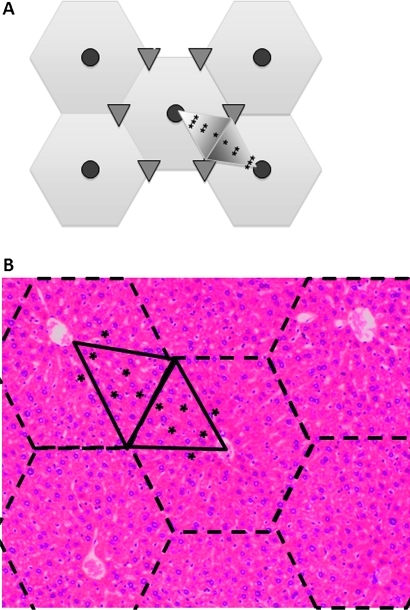
The locations of the micrometastases were determined relative to the hepatic triads and central veins in hepatic lobules. The liver is divided into functional units of the hepatic lobule centred on a tributary of the portal system, the central vein, which is surrounded by six small portal triad clusters. These clusters contain branches of the hepatic artery, vein and biliary system. These lobules can be divided into six acini, each with their base between the connecting branches of the hepatic artery and their apex at the central vein. The region nearest the central artery is the most oxygenated region of the acinus and the region at the point of the acinus is the most hypoxic. There is a gradient of oxygenation within the acinus accordingly, zone 1 is the most oxygenated along the base of the acinus and nearest the branches of the hepatic artery and zone 3 is at the point nearest the central vein. Zone 2 is located in between zones 1 and 3. Localisation of the micrometastases was performed as shown in figure 1. Micrometastases were classified in zones 1, 2 or 3 if they were between 0 to 1/3, 1/3 to 2/3, or 2/3 to full apical height (base to apex) of the acinus, respectively.
Figure 1.
Hepatic micrometastasis by zone. (A) Representative image of a hepatic lobule (hexagons) and acinus (large shaded triangles). The central veins in the lobules are represented by shaded circles, the portal triads by small triangles. Portal triad, T; zone 1, *; zone 2, **; zone 3, ***. (B) Mouse hepatic lobules are outlined with dashed lines and the acini outlined with solid lines. Zone 1, *; zone 2, **; zone 3, ***. Haematoxylin and eosin staining, magnification ×25.
For laser-capture microscopy (LCM), a clean surface was prepared with Rnase Away (Invitrogen, Carlsbad, California, USA) before tissue collection and staining. The livers of all ten mice were cut into small pieces and frozen in molds (SAKURA, Torrance, California, USA) filled with optimum cutting temperature compound (SAKURA) on dry ice. The samples were stored at −80°C. Sections of frozen hepatic tissue (10 μm) were mounted on non-adhesive glass slides. The HistoGene Frozen Section Staining kit (Arcturus, Mountain View, California, USA) was used for staining. The slides were placed in the following solutions: 75% ethanol for 30 s, distilled water for 30 s, HistoGene staining solution (haematoxylin) for 45 s, distilled water for 30 s, 75% ethanol for 30 s, 95% ethanol for 30 s, 100% ethanol for 30 s, xylene for 5 min. The slides were dried for 5 min and placed in a desiccator.
The PixCell IIe Laser Capture Microdissection system (Arcturus) was used to microdissect metastatic melanoma cells from the hepatic tissue sections. Prior to LCM, a field with micrometastases was microscopically identified. A CapSure HS LCM Cap (Arcturus) was placed on the micrometastatic area. The following settings were used: 7.5 μm laser spot size, 4.4 mA current, 100 mW power and 750–950 ms pulse duration. The laser spots were controlled to select the micrometastases without disturbing surrounding hepatic tissue. Complete capture was defined as capture of more than 90% of the tissue within the laser-activated capture area without transfer of any tissue outside the capture area. After LCM, the cap was removed, RNA buffer was immediately loaded and the cap was covered with a microcentrifuge tube.
Total RNA of LCM obtained cells was extracted using the PicoPureTM RNA isolation kit (Arcturus) according to instructions of the manufacturer. Total RNA from LCM cells was amplified according to the RiboAmpTM RNA amplification kit protocol (Arcturus). The optical density of the RNA samples was measured at 260 nm and 280 nm by the UV-1601 model UV-visible spectrophotometer (Shimadzu, Norcross, Georgia, USA).
One step real-time reverse transcription (RT)-PCR was performed using QuantiTectTM SYBR green RT-PCR kit (QIAGEN, Valencia, California, USA) on a thermocycler (iCycler, Bio-Rad, Hercules, California, USA). The primers were designed by Primer Express software (Applied Biosystems, Foster City, California, USA). The GenBank accession number of mouse VEGF is NM_009505. The primers for detection of mouse VEGF mRNA were 5′-CGC GAG TCT GTG TTT TTG CA-3′ and 5′-CAG AGC GGA GAA AGC ATT TGT-3′. β-Actin was selected as the internal control reference gene. The sequences of mouse β-actin primers were 5′-AAG TGT GAC GTT GAC ATC CGT AA-3′ and 5′-TGC CTG GGT ACA TGG TGG TA-3′. The procedure was the same as previously performed.4
All samples were run in triplicate with each VEGF ELISA and PCR for mRNA repeated three times. The micrometastatic cells that were extracted to obtain RNA samples were captured by LCM from livers from three different areas (zones 1, 2 and 3). Each cap captured 5–20 hepatic micrometastases depending on the cell number and size of the micrometastasis in the same livers. All micrometastases were not captured since we only chose to capture those that were clearly distinguishable from surrounding tissue. In addition, 100–1000 μm metastases that co-opted vascular channels were rarely encountered and not captured. There were no 1000–2000 μm vascularised macrometastases present. The delta–delta cycle threshold (ΔΔCt) method was used to calculate the real-time PCR results, which measures gene expression between the model and a housekeeping gene (∆ cross threshold), then between the model and control groups (∆∆ cross threshold). First, calculated the ΔCt values that are the difference between the VEGF Ct value and the β-actin Ct value from three zones. Then calculated the ΔΔCt values that are the difference between the ΔCts from three zones.
Statistical analysis was done with Microsoft Excel 2008 (Redmond, Washington, USA). A one-way ANOVA was used to determine statistical significance of differences in serum VEGF levels over time. A correlation coefficient analysis was used to determine the correlation of VEGF serum levels to the location and number of hepatic micrometastases. The level of significance was set at a p value <0.05.
Results
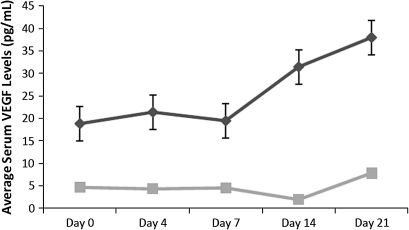
Serum VEGF levels rose after inoculation of C57Bl/6 mouse eyes with the B16LS9 melanoma cells (figure 2). On day 14 there was a statistically significant (p<0.05) increase in VEGF levels in the serum of mice inoculated with the cells, with an average peak level of 37.985 pg/ml at day 21. Mice injected with PBS did not exhibit the same rise in serum VEGF expression and VEGF expression remained relatively stable over the time course studied.
Figure 2.
Averaged serum levels of vascular endothelial growth factor (VEGF) over time. Mice were inoculated with either B16LS9 murine melanoma cells or phosphate buffered saline (PBS) and serum VEGF levels were measured by ELISA at the indicated post-inoculation time points, with SE bars shown. The black line indicates the B16LS9 group and the grey line indicates the PBS control group. p=0.04 for days 7, 14 and 21 compared with day 0 by ANOVA.
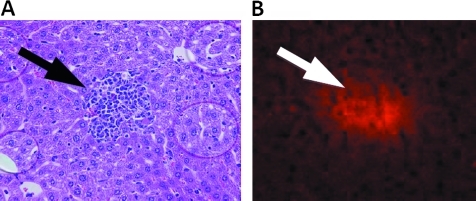
A representative photomicrograph of a mouse hepatic lobules is shown in figure 1B. Zones 1–3 micrometastastic locations are depicted in figures 1B (asterisks). VEGF protein expression was confirmed with immunohistochemistry for VEGF in identified hepatic micrometastases. A representative micrometastasis with corresponding VEGF staining is shown in figure 3.
Figure 3.
Uveal melanoma hepatic micrometastases express vascular endothelial growth factor (VEGF) protein. (A) Micrometastastic melanoma in liver (arrow) (haematoxylin and eosin staining, magnification, ×100). (B) Hepatic micrometastasis expresses VEGF (arrow) (anti-VEGF, ×100).
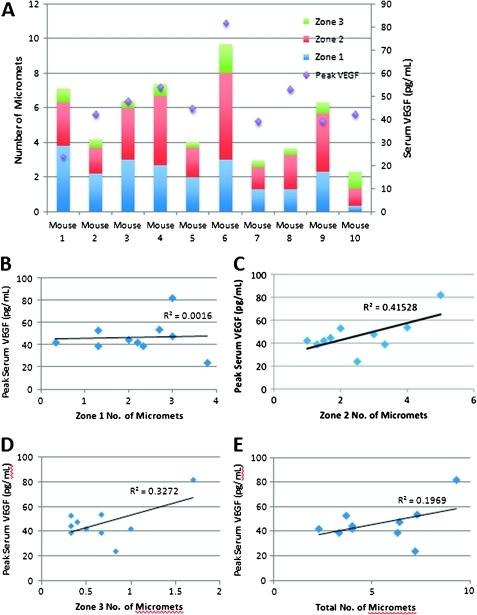
The number and location of micrometastases was determined for each mouse and correlated with their averaged and peak VEGF serum levels (figure 4). Peak serum VEGF levels weakly correlated with the total number of hepatic micrometastases (Pearson R=0.444, p<0.05). There was moderate correlation of peak VEGF serum levels with zone 2 (Pearson R=0.644, p<0.05) and zone 3 micrometastases (Pearson R=0.572, p<0.05), although this is a preliminary study in a limited number of mice. R2 values are also reported, which indicate the percentage of variability of serum VEGF levels as it relates to the number and location of hepatic micrometastases. There was a slight rise in total and in particular zone 2 and 3 micrometastases as serum VEGF levels rose.
Figure 4.
Serum vascular endothelial growth factor (VEGF) levels correlate with micrometastases. (A) The number of micrometastases by zone correlates with serum VEGF levels for each mouse. (B) Zone 1 micrometastases (micromets) did not correlate with peak serum VEGF levels (R2=0.0016). (C) Zone 2 micrometastases correlated with peak serum VEGF levels (R2=0.41528). (D) Zone 3 micrometastases correlated with peak serum VEGF levels (R2=0.3272). (E) Total micrometastases correlated with peak serum VEGF levels (R2=0.1969). Pearson correlation coefficient and R2 analysis are indicated in the text and figure, respectively; p<0.05.
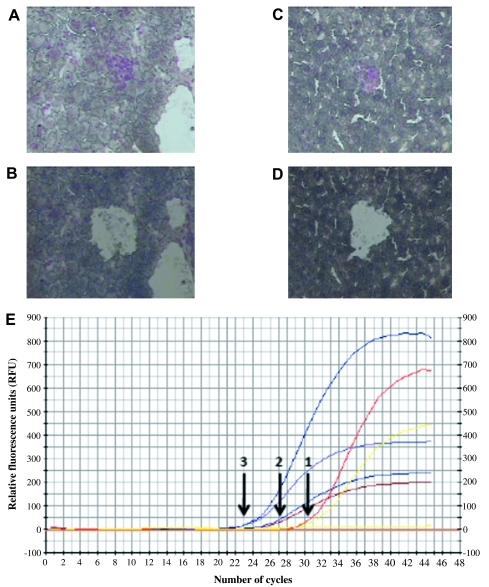
VEGF mRNA expression in micrometastases correlated with location of micrometastases according to real-time comparative PCR. VEGF mRNA was detected by real-time RT-PCR in zones 1, 2 and 3 hepatic micrometastases. Micrometastases in each zone were identified and isolated from each of the 10 mice by laser-capture microscopy. Representative photomicrographs are depicted in figure 5A–D. The captured tissue from each zone was pooled from all 10 mice to ensure an appropriate quantity of mRNA for real-time RT-PCR analysis. After normalisation to the internal control ß-actin, the ΔΔCt for VEGF expression in zone 3 versus zone 1 was 6.55. The ΔΔCt for VEGF expression in zone 3 versus zone 2 was 2.15. The ΔΔCt for zone 2 versus zone 1 was 4.4. This indicates a higher level of VEGF mRNA expression in zone 3 micrometastases versus zones 1 and 2 (figure 5E).
Figure 5.
Real-time reverse transcription (RT)-PCR for vascular endothelial growth factor (VEGF) expression from zone-separated hepatic micrometastases. (A, B) Representative photomicrograph of laser-capture microscopy (LCM) before (A) and after (B) of zone 1 micrometastases analysed for VEGF mRNA expression. (C, D) Representative photomicrograph of LCM before (C) and after (D) of zone 3 micrometastases analysed for VEGF mRNA expression. After normalisation to the internal control ß-actin (E), the ΔΔCt for VEGF expression in zone 3 versus zone 1 was 6.55. The ΔΔCt for VEGF expression in zone 3 versus zone 2 was 2.15. The ΔΔCt for zone 2 versus zone 1 was 4.4. This indicates a higher level of VEGF mRNA expression in zone 3 micrometastases versus zones 1 and 2. CF, curve fit; RFU, relative fluorescence units.
Discussion
We have shown that serum VEGF levels rise over time in mice inoculated intra-ocularly with a cutaneous melanoma cell line. The presence of the development of metastases leads to measurable VEGF levels in the murine serum. These results provide new information on serum VEGF levels and how they correlate with metastatic disease. Previous studies have described VEGF expression in ocular tissues alone.8–10 15 16 Sheidow and coworkers evaluated localised VEGF expression in the enucleated eyes of patients with uveal melanoma and did not show a correlation of survival and incidence of metastases with local VEGF expression.5 Later, Boyd and coworkers observed elevated expression of VEGF in local tissue and ocular fluid samples of a small case series of patients with uveal melanoma, but were also unable to correlate these localised elevated levels of VEGF with local tumour size or presence of neovascularisation.15 Missotten and coworkers evaluated a larger number of eyes enucleated for uveal melanoma and also noted higher levels VEGF expression in both local tissue and aqueous humour compared with controls.9 Recently, El Filali et al found variable levels of VEGF production in uveal melanoma cell lines and primary cultures, but did note a significant rise in serum VEGF in patients with metastatic uveal melanoma.17 Our data support the above study and provide a useful animal model of metastatic uveal melanoma.
There have been several studies looking at serum and tissue for VEGF levels in a variety of cancers. Specifically, colorectal cancer, which also metastasises to the liver, is associated with a poor prognosis based on peri-operative serum VEGF levels.18 19 Osteosarcoma is associated with a poor prognosis in patients with serum VEGF levels greater than 1000 pg/ml.20 21 There are now data indicating that serum VEGF levels are a prognostic indicator of metastatic uveal melanoma to the liver, although the pre-operative VEGF levels were not measured in that study.17
Our laboratory has found variable expression of VEGF in human uveal melanoma cell lines.7 We have also shown that bevacizumab inhibits metastasis and growth of experimental uveal melanoma.7 That study showed a decreased size of the primary ocular melanoma and a decrease in the number of micrometastases.7 There are also new data that show an increase in serum levels of VEGF in uveal melanoma patients with metastases versus those without metastases.17 This variability in VEGF expression relates to the tumour dormancy model as described by Logan et al and Luzzi et al.22 23 Patients may go for years after diagnosis and apparent successful treatment of a uveal melanoma before metastases develop. Although there may be clinically undetectable micrometastases at the time of diagnosis or soon after, we speculate that micrometastases expressing high levels of VEGF have the capability to proliferate in the liver and other sites of metastasis. This hypothesis is supported by the successful inhibition of growth and metastases in our experimental uveal melanoma model.7
Since micrometastases may be present at the time of diagnosis of uveal melanoma, it would be useful to follow a serum marker of potential metastases other than liver function tests, which are non-specific and become elevated only when a large metastatic focus has developed. Serum VEGF may be clinically useful as an early marker of micrometastasis or progression and interventional therapy could potentially be initiated earlier.
Footnotes
Funding: NIH R01 CA126557, NEI P30 EY06360, Research to Prevent Blindness, Inc.
Competing interests: None.
Provenance and peer review: Not commissioned; externally peer reviewed.
References
- 1.Singh AD, Topham A. Incidence of uveal melanoma in the United States: 1973–1997. Ophthalmology 2003;110:956–61 [DOI] [PubMed] [Google Scholar]
- 2.Singh AD, Bergman L, Seregard S. Uveal melanoma: epidemiologic aspects. Ophthalmol Clin North Am 2005;18:75–84, viii [DOI] [PubMed] [Google Scholar]
- 3.The Collaborative Ocular Melanoma Study (COMS) randomized trial of pre-enucleation radiation of large choroidal melanoma I: characteristics of patients enrolled and not enrolled. COMS report no. 9. Am J Ophthalmol 1998;125:767–78 [DOI] [PubMed] [Google Scholar]
- 4.Yang H, Xu Z, Iuvone PM, et al. Angiostatin decreases cell migration and vascular endothelium growth factor (VEGF) to pigment epithelium derived factor (PEDF) RNA ratio in vitro and in a murine ocular melanoma model. Mol Vis 2006;12:511–17 [PubMed] [Google Scholar]
- 5.Sheidow TG, Hooper PL, Crukley C, et al. Expression of vascular endothelial growth factor in uveal melanoma and its correlation with metastasis. Br J Ophthalmol 2000;84:750–6 [DOI] [PMC free article] [PubMed] [Google Scholar]
- 6.Ascierto PA, Leonardi E, Ottaiano A, et al. Prognostic value of serum VEGF in melanoma patients: a pilot study. Anticancer Res 2004;24:4255–8 [PubMed] [Google Scholar]
- 7.Yang H, Jager MJ, Grossniklaus HE. Bevacizumab suppresses establishment of micrometastases in experimental ocular melanoma. Invest Ophthalmol Vis Sci 2010;51:2835–42 [DOI] [PMC free article] [PubMed] [Google Scholar]
- 8.Sahin A, Kiratli H, Tezel GG, et al. Expression of vascular endothelial growth factor a, matrix metalloproteinase 9 and extravascular matrix patterns in iris and ciliary body melanomas. Ophthalmic Res 2007;39:40–4 [DOI] [PubMed] [Google Scholar]
- 9.Missotten GS, Notting IC, Schlingemann RO, et al. Vascular endothelial growth factor a in eyes with uveal melanoma. Arch Ophthalmol 2006;124:1428–34 [DOI] [PubMed] [Google Scholar]
- 10.Notting IC, Missotten GS, Sijmons B, et al. Angiogenic profile of uveal melanoma. Curr Eye Res 2006;31:775–85 [DOI] [PubMed] [Google Scholar]
- 11.Rusciano D, Lorenzoni P, Burger M. Murine models of liver metastasis. Invasion Metastasis 1994;14:349–61 [PubMed] [Google Scholar]
- 12.Fidler IJ, Gersten DM, Budmen MB. Characterization in vivo and in vitro of tumor cells selected for resistance to syngeneic lymphocyte-mediated cytotoxicity. Cancer Res 1976;36:3160–5 [PubMed] [Google Scholar]
- 13.Harning R, Szalay J. Ocular metastasis of in vivo and in vitro derived syngeneic murine melanoma. Invest Ophthalmol Vis Sci 1987;28:1599–604 [PubMed] [Google Scholar]
- 14.Dithmar S, Rusciano D, Grossniklaus HE. A new technique for implantation of tissue culture melanoma cells in a murine model of metastatic ocular melanoma. Melanoma Res 2000;10:2–8 [PubMed] [Google Scholar]
- 15.Boyd SR, Tan D, Bunce C, et al. Vascular endothelial growth factor is elevated in ocular fluids of eyes harbouring uveal melanoma: identification of a potential therapeutic window. Br J Ophthalmol 2002;86:448–52 [DOI] [PMC free article] [PubMed] [Google Scholar]
- 16.Sahin A, Kiratli H, Soylemezoglu F, et al. Expression of vascular endothelial growth factor-A, matrix metalloproteinase-9, and extravascular matrix patterns and their correlations with clinicopathologic parameters in posterior uveal melanomas. Jpn J Ophthalmol 2007;51:325–31 [DOI] [PubMed] [Google Scholar]
- 17.El Filali M, Missotten GS, Maat W, et al. Regulation of VEGF-A in uveal melanoma. Invest Ophthalmol Vis Sci 2010;51:2329–37 [DOI] [PubMed] [Google Scholar]
- 18.Alabi AA, Suppiah A, Madden LA, et al. Preoperative serum vascular endothelial growth factor-a is a marker for subsequent recurrence in colorectal cancer patients. Dis Colon Rectum 2009;52:993–9 [DOI] [PubMed] [Google Scholar]
- 19.Alabi AA, Suppiah A, Madden LA, et al. Preoperative serum levels of serum VEGF-C is associated with distant metastasis in colorectal cancer patients. Int J Colorectal Dis 2009;24:269–74 [DOI] [PubMed] [Google Scholar]
- 20.Kaya M, Wada T, Akatsuka T, et al. Vascular endothelial growth factor expression in untreated osteosarcoma is predictive of pulmonary metastasis and poor prognosis. Clin Cancer Res 2000;6:572–7 [PubMed] [Google Scholar]
- 21.Kaya M, Wada T, Nagoya S, et al. The level of vascular endothelial growth factor as a predictor of a poor prognosis in osteosarcoma. J Bone Joint Surg Br 2009;91:784–8 [DOI] [PubMed] [Google Scholar]
- 22.Logan PT, Fernandes BF, Di Cesare S, et al. Single-cell tumor dormancy model of uveal melanoma. Clin Exp Metastasis 2008;25:509–16 [DOI] [PubMed] [Google Scholar]
- 23.Luzzi KJ, MacDonald IC, Schmidt EE, et al. Multistep nature of metastatic inefficiency: dormancy of solitary cells after successful extravasation and limited survival of early micrometastases. Am J Pathol 1998;153:865–73 [DOI] [PMC free article] [PubMed] [Google Scholar]


