

Abstract
Nuclear calcium is a key signal in the dialogue between synapse and nucleus that controls the genomic responses required for persistent adaptations, including memory and acquired neuroprotection. The amplitude and duration of nuclear calcium transients specify activity-induced transcriptional changes. However, the precise relationship between synaptic input and nuclear calcium output is unknown. Here, we used stereotaxic delivery to the rat brain of recombinant adeno-associated viruses encoding nuclear-targeted calcium sensors to assess nuclear calcium transients in CA1 pyramidal neurons after stimulation of the Schaffer collaterals. We show that in acute hippocampal slices, a burst of synaptic activity elicits a nuclear calcium signal with a regenerative component at above-threshold stimulation intensities. Using classical stimulation paradigms (i.e., high-frequency stimulation (HFS) and θ burst stimulation (TBS)) to induce early LTP (E-LTP) and transcription-dependent late LTP (L-LTP), we found that the magnitude of nuclear calcium signals and the number of action potentials activated by synaptic stimulation trains are greatly amplified by their repetition. Nuclear calcium signals and action potential generation were reduced by blockade of either NMDA receptors or L-type voltage-gated calcium channels, but not by procedures that lead to internal calcium store depletion or by blockade of metabotropic glutamate receptors. These findings identify a repetition-induced switch in nuclear calcium signaling that correlates with the transition from E-LTP to L-LTP, and may explain why the transcription-dependent phase of L-LTP is not induced by a single HFS or TBS but requires repeated trains of activity. Recombinant, nuclear-targeted indicators may prove useful for further analysis of nuclear calcium signaling in vivo.
Introduction
Synapse-to-nucleus communication pathways and nuclear calcium signaling control gene expression programs that are critical for the maintenance of many adaptive responses in the nervous system, including memory formation, activity-dependent survival, addiction, and chronic pain. The transcription factor CREB and coactivator CBP are key targets of nuclear calcium signaling (1–4) that have been implicated in transcription-dependent, long-lasting (>2 h) long-term potentiation (LTP) (5). Blockade of nuclear calcium signaling blocks activity-dependent neuronal survival (6–9) and memory formation (4), indicating a broad functional role for this signaling ion in the nucleus.
Although many of the mechanisms underlying synaptically activated gene transcription have been established, less is known about the nature of the nuclear calcium signals evoked by synaptic stimulations, in particular those that lead to long-lasting changes in synaptic efficacy. Trains of synaptic stimulation evoke interacting and compartmentally specific calcium signals in neurons. Synaptically activated calcium signals in the somata and primary apical dendrites of hippocampal CA1 pyramidal neurons appear to depend on complex interactions between dendritic geometry, inositol 3,4,5 triphosphate (IP3) receptors, backpropagating action potentials, and voltage-operated calcium channels (VOCCs) (10–13). Furthermore, synaptic activity can activate a regenerative phenomenon involving the release of calcium from internal stores. This can initiate a propagating calcium wave that invades the soma and presumably the nucleus of pyramidal neurons in the CA1 and medial prefrontal cortex (14–21). This complexity in calcium signaling in neurons governs how synaptic input is encoded into a nuclear calcium signal to determine the transcriptional output critical for plasticity and survival. The nature of the synaptic stimulation that is necessary for transcription-dependent plasticity is best understood in terms of late LTP (L-LTP); however, the relationship between synaptic input and nuclear calcium output in the context of L-LTP is less understood.
Progress in this field has been impeded by the technical difficulty of unambiguously measuring calcium in the nucleus. Studies of nuclear calcium signaling to date have used synthetic, small-molecule indicators imaged with two-photon microscopy and defined the nuclear boundaries according to dye compartmentalization. The advent of recombinant calcium indicators presents an opportunity to target indicators to cell types and intracellular compartments using the appropriate promoter and localization sequences. Targeting of the nucleus with genetically encoded calcium indicators (GECIs) has been achieved in HeLa cells (22,23), but to date has not been applied to functional studies of neurons.
Using a nuclear localized calcium indicator, we unambiguously demonstrate for the first time (to our knowledge) a nuclear calcium signal induced by synaptic activity. We examine nuclear calcium signaling generated by synaptic activity in relation to L-LTP-inducing stimulation protocols in hippocampal brain slices. This reveals a dramatic increase in nuclear calcium signals when stimulation trains are repeated, as is the case for L-LTP induction protocols. The potentiation of nuclear calcium responses to repeated trains of synaptic activity may serve to switch on genomic, CREB/CBP-mediated transcriptional responses and hence L-LTP, which is known to require repeated trains of synaptic stimulation.
Materials and Methods
See the Supporting Material for details of the materials and methods used in this work.
Results
Visualizing nuclear calcium signals with GECIs
We generated three adeno-associated viruses (rAAVs)—rAAV-Inverse Pericam (IP)-NLS, rAAV-GCaMP1.6-NLS, and rAAV-GCaMP2.0-NLS—that contain expression cassettes for Inverse Pericam (24), GCaMP1.6 (25), and GCaMP2.0 (26), respectively, and each one was fused to three copies of a nuclear localization signal (NLS) that targets the calcium sensors to the cell nucleus (Fig. 1, Fig. S1, and Movie S1). IP-NLS and GCaMP2.0-NLS showed a much brighter basal fluorescence than GCaMP1.6-NLS, which made the infected cells much easier to locate. All three indicators were able to detect oscillatory calcium signals in dissociated or organotypic cultures over long recording periods (up to 1 h; Fig. S1 B). These synchronous nuclear calcium transients were induced by application of bicuculline, a GABAA receptor antagonist that removes tonic inhibition to cause recurrent synchronous action potential bursting mediated by glutamatergic synaptic transmission (27). All three indicators showed a similar dynamic range of ∼300–600% in culture and ∼80–150% in acute brain slices (data not shown), consistent with previous reports (28–30). Fmax measurements were complicated by photoisomerization, which varied with illumination and absorbance, causing emissions after ionomycin or a depolarizing solution to slowly decline (Fig. S1 B and Fig. S2 D, inset; also see Fig. 4 C). This may have been responsible for differences in our dynamic range estimates due to underestimation of Fmax in slices. These complications precluded routine measurements of Fmax and Fmin for calibration purposes.
Figure 1.
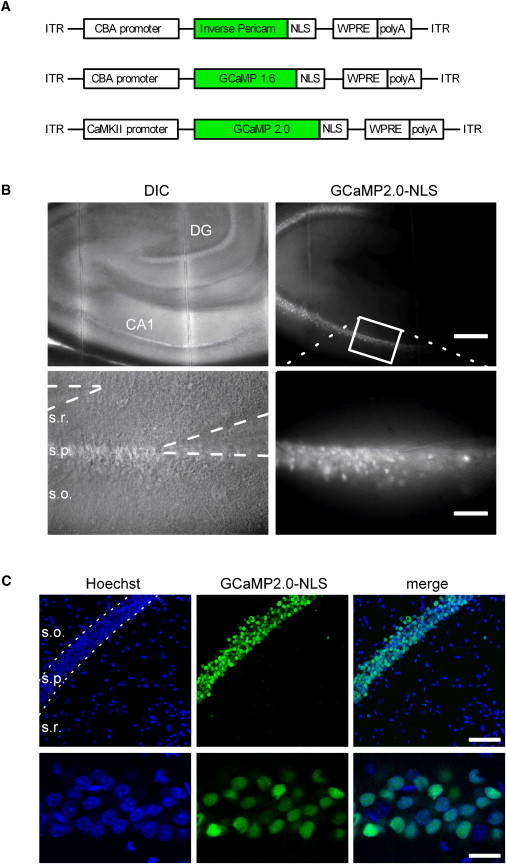
Expression of recombinant nuclear calcium indicators in vivo. (A) Schematic maps of the three constructs encoding nuclear localized recombinant calcium indicators. An NLS was added to the circularly permutated YFP variant IP and GFP variants GCaMP1.6 and GCaMP2.0, which were then subcloned into rAAVs. (B) Acute brain slices (300 μm thick) from rats 2 weeks after a stereotactic injection of rAAV-GCaMP2.0-NLS into the ventral hippocampus at postnatal day 22. Differential interference contrast (left) and GCaMP2.0-NLS fluorescence (right) images are shown at 4× (upper row) and 20× (lower row) magnification. Patch and stimulation pipettes are visible in the stratum pyramidale (s.p.) and stratum radiatum (s.r.), respectively. s.o., stratum oriens; DG, dentate gyrus. Scale bars are 250 μm (upper row) and 50 μm (lower row). (C) Confocal images of the CA1 region in a 40 μm thick brain slice from a perfusion fixed brain. Scale bars are 75 μm (upper row) and 10 μm (lower row). See also Movie S1.
Figure 4.
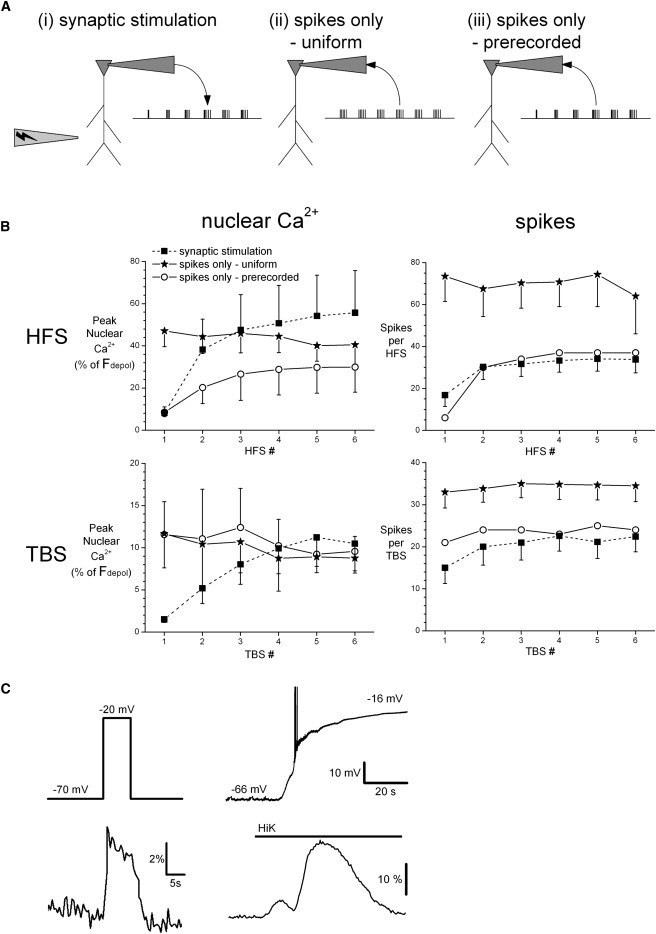
Analysis of the depolarization-induced component of nuclear calcium responses to synaptic stimulation. (A) Schematic representation of the experimental paradigm where recordings were made in the same cell in response to (i) trains of synaptic stimulation, (ii) trains of 1 ms current injections to evoke spikes in current clamp mode (spikes only, uniform), and (iii) trains of typical spike activity recorded from a different slice in response to synaptic stimulation and applied to the neuron in voltage clamp mode (spikes only, prerecorded). See Materials and Methods for details. (B) GCaMP2.0-NLS responses of patched neurons to synaptic stimulation and spike-only trains normalized respectively to the calcium response of the same cell to depolarization (Fdepol) induced by application of 40 mM K+ (HiK) and depolarization to −20 mV in voltage clamp. Calcium responses are not significantly different from each other as indicated by two-way repeated-measures ANOVA. (C) Typical nuclear calcium responses (lower panels) to depolarization (upper panels) using voltage clamp (left) and HiK application (right) in the same cell.
Evoking nuclear calcium signals in CA1 pyramidal cells with synaptic stimulation
Nuclear calcium signaling was next examined in acute brain slices prepared from P35-P42 rats 13–19 days after stereotaxic injection of nuclear GECI encoding viruses into the ventral hippocampus (see Materials and Methods). Expression was almost exclusively confined to the stratum pyramidale for all three indicators and was spread throughout large regions of CA1–3 and the dentate gyrus with GCaMP2.0-NLS (Fig. 1 B). The intracellular distribution of these recombinant indicators was exclusively nuclear (Fig. 1, B and C, Fig. S1 A, and Movie S1), although we also observed a small percentage of cells with some dendritic signal when extreme concentrations of virus were injected (data not shown).
Somatic whole-cell patch clamp recordings were established from CA1 pyramidal neurons identified by relatively low-frequency action potentials with rounded afterhyperpolarization potentials and spike accommodation (Fig. 2 A). Passive membrane properties, including the resting membrane potential, membrane capacitance, and resistance, were assessed and did not differ from those observed for control cells in uninfected slices (Table S1). Field stimulation of axons in stratum radiatum and stratum oriens triggered excitatory postsynaptic potentials (EPSPs) or currents (EPSCs). Before imaging was initiated, responses to a range of stimulus current intensities were first characterized to determine the spike threshold, defined as the minimal intensity necessary to evoke a spike in most trials (Fig. 2 B). This stimulation intensity for the spike threshold in neurons expressing GECIs was not different from that for neurons in uninfected slices (Table S1). Since GCaMP2.0-NLS infection also usually reached the CA3 region, we checked for effects on release probability using standard paired pulse (PP) protocols and found no difference between uninfected control slices and slices expressing GCaMP2.0-NLS (Fig. 2, C and D).
Figure 2.
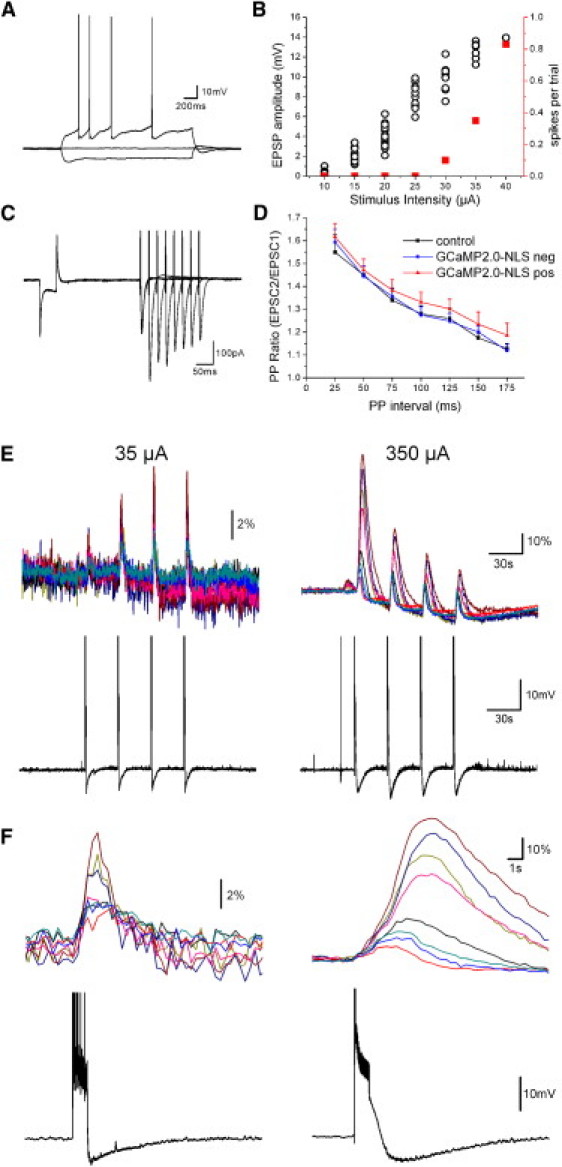
Nuclear calcium responses to HFS stimulation vary with stimulation intensity. (A) Response of a GCaMP2.0-NLS positive CA1 pyramidal neuron to current injection. (B) EPSP amplitude (black circles) and the proportion of stimuli evoking action potentials (red squares) are plotted as a function of the stimulation intensity of a field stimulating electrode in the stratum radiatum. (C) Ten overlaid responses to PP stimulation in the same neuron shown in A and B. A hyperpolarizing step of −5 mV is included at the beginning of each sweep. (D) Summary data for the PP ratio in control neurons in slices from noninjected rats (n = 5), and from GCaMP2.0-NLS positive (n = 13) and negative (n = 5) neurons in slices from GCaMP2.0-NLS injected rats. The three cell groups are not significantly different (two-way ANOVA, p = 0.59). (E) Shown are nuclear calcium (% ΔF/F0, GCaMP2.0-NLS; top) and the membrane potential (bottom) recorded from same pyramidal neuron measured in A–C among the infected cells in response to repeated trains of HFS stimulation (100 Hz, 1 s) at stimulation intensities of 35 μA (left) and 350 μA (right). A 20 min pause was made between the two series of stimulations. The sinking baseline and diminishing response peaks at 350 μA stimulation intensity are at least partly an artifact of strong photoisomerization at such high absorbance levels. (F) An expanded timescale showing of responses to the last HFS train at 35 μA and the first HFS train at 350 μA of the stimulation series shown in E. Spikes have been clipped for display purposes in E and F.
Calcium imaging was performed only on nuclei in the CA1 pyramidal region from both patched and nonpatched intact cells. Trains of high-frequency stimulation (HFS) at threshold intensities were sufficient to induce postsynaptic action potentials in the recorded cell and a nuclear calcium signal in infected cells up to 100 μm away (Fig. 2, E and F, left). Tenfold larger stimulation intensities evoked nuclear calcium signals of larger amplitude and longer duration, which continued to grow after the cessation of EPSPs (n = 4; Fig. 2, E and F, right). Such responses are typical of previously described regenerative mechanisms that delay and amplify the peak of calcium responses due to the release of calcium from internal stores (14,16,18,20,31,32). At threshold stimulation intensities (∼50% spike induction probability; see Fig. 2 B), delayed peaks in the nuclear calcium responses were not observed using θ burst stimulation (TBS; 833 cells in 24 slices) and were rarely seen using HFS (12 cells in four slices, out of 1042 cells in 26 slices). Regenerative nuclear calcium signals were more frequently observed with 10-fold higher stimulation intensities (six out of 11 slices).
LTP experiments were performed in parallel with imaging to examine nuclear calcium signals associated with HFS and TBS stimulation paradigms that induce L-LTP. The stimulation strength was set to spike threshold levels in the recorded neuron that produced a peak nuclear calcium response typically within 2 s of the cessation of stimulation, such as the response to 35 μA stimulation in Fig. 2, E and F, and apparently subthreshold for the initiation of regenerative calcium signals (Fig. S2 D). The intensity of stimuli used to evoke test EPSPs or EPSCs was adjusted to ∼30% of spike threshold under baseline conditions. Single HFS and TBS trains (see Materials and Methods) induced LTP lasting ≥20 min (data not shown), whereas five or more repetitions of HFS or TBS trains could induce LTP lasting >1.5 h (Fig. S2 B).
Repetition of HFS and TBS trains elicits larger nuclear calcium responses and more action potentials
Given the importance of nuclear calcium for transcription-dependent L-LTP, we wished to further analyze nuclear calcium responses to typical induction protocols for L-LTP. A single HFS or TBS train can induce E-LTP, whereas five to eight repetitions of TBS or three to six repetitions of HFS are typically required for L-LTP induction (10,33–35). We found a sharp increase in action potentials and nuclear calcium signals evoked by the first two to five repetitions of either HFS or TBS trains in slices that had not previously received trains of stimulation (Fig. S2, D and E, and Fig. 3). The increment in nuclear calcium responses with successive stimulation trains was evident with all intertrain intervals tested (i.e., 30 s, 60 s, and 5 min for HFS, and 60 s for TBS). The increase in nuclear calcium responses was more pronounced with GCaMP1.6-NLS and GCaMP2.0-NLS than with IP-NLS (Fig. 3 A), most likely due to the higher affinity and thus better resolution of smaller nuclear calcium signals for the GCaMP constructs. To normalize for differences in expression levels and brightness in these three indicators, the data were replotted relative to the maximum response of each cell to repeated stimulation trains (Fig. 3 B). Averaging results from all indicators, we found that train repetition increased the amplitude of nuclear calcium responses by 4.97 ± 0.25-fold for HFS and 3.52 ± 0.10-fold for TBS, and increased the number of action potentials by 6.34 ± 1.85-fold for HFS and 1.71 ± 0.17-fold for TBS (p < 0.0001 comparing the first response to the largest response; see Materials and Methods section for paired t-tests, and figure legends for n-values). This augmentation of nuclear calcium signals with successive stimulation trains was also more pronounced with HFS compared to TBS (p < 0.0001). The amplitude and increase in nuclear calcium responses with successive HFS trains seen in nonpatched neurons was identical to that of patched neurons from which the spike data was gathered (Fig. 3 C, left). Furthermore, the number of action potentials induced by HFS and the increase in spike number seen with successive trains were equivalent in CA1 pyramidal neurons from control slices from uninfected animals and GCaMP2.0-NLS positive and negative neurons from infected animals (Fig. 3 C, right). GCaMP2.0-NLS negative neurons were included in this analysis to detect any differences in presynaptic function, given the expression of our recombinant indicators in the CA3 region in most slices. Thus, the repetition of HFS and TBS trains causes a dramatic increase in nuclear calcium signaling and action potentials that correlates with the ability of train repetition to induce transcription-dependent L-LTP.
Figure 3.
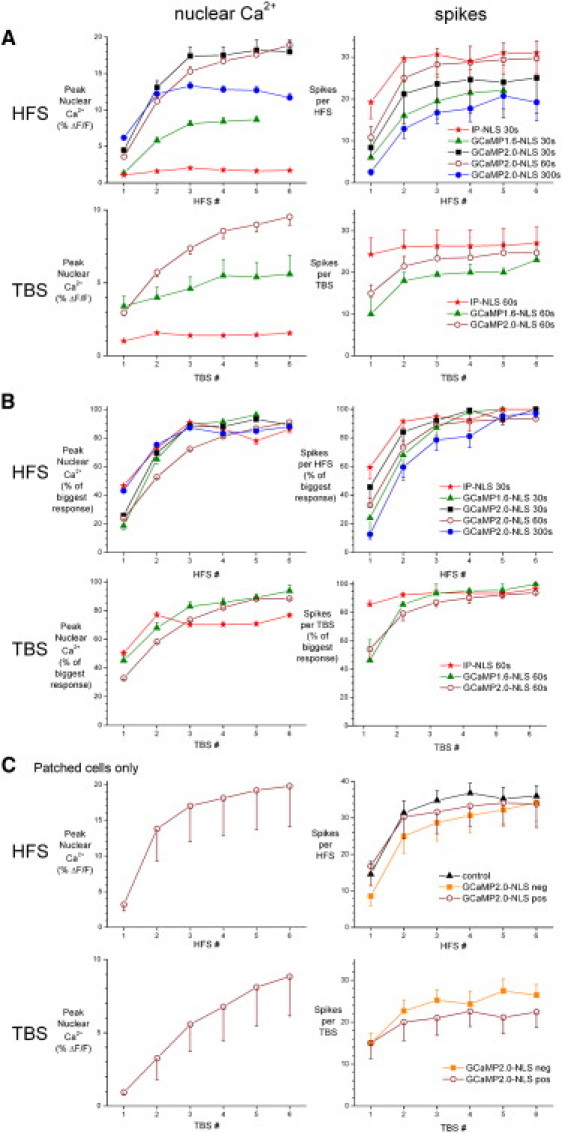
Nuclear calcium signals evoked by trains of HFS or TBS in slices infected with IP-NLS, GCaMP1.6-NLS, or GCaMP2.0-NLS. (A) Cumulative data from multiple slices show the mean peak nuclear calcium response amplitude (left) and number of action potentials (right) evoked by five or six trains of HFS (upper) or TBS (lower) at the indicated intertrain intervals, using a stimulation intensity set to the approximate threshold for eliciting an action potential with a single stimulus (30–80 μA). IP-NLS HFS, 112 cells in five slices; IP-NLS TBS, 119 cells in six slices; GCaMP1.6-NLS HFS, 49 cells in two slices; GCaMP1.6-NLS TBS, 23 cells in two slices; GCaMP2.0-NLS HFS, 30 s interval 259 cells in seven slices; GCaMP2.0-NLS HFS, 60 s interval 707 cells in 23 slices; GCaMP2.0-NLS HFS, 300 s interval 364 cells in eight slices; and GCaMP2.0-NLS TBS, 666 cells in 16 slices. (B) The data from all cells presented in A have been normalized for each region of interest and patched cell to their maximum response across the series of stimulation trains. (C) Data from patched cells only in brain slices from control animals (n = 10) or slices from animals injected with GCaMP2.0 NLS (GCaMP2.0 NLS pos: HFS n = 15, TBS n = 8; GCaMP2.0 NLS neg: HFS n = 9, TBS n = 9).
Mimicking HFS- or TBS-induced activity without synaptic stimulation
Our data show a marked correlation between spike number and nuclear calcium signals, suggesting a strong contribution of local somatic VOCCs. To directly investigate whether action potentials alone could trigger such nuclear calcium signals, we compared in the same cell synaptically evoked responses to HFS and TBS with that of comparable spike trains in the absence of synaptic activation (Fig. 4 A). The nuclear calcium signals induced by spikes alone were smaller than those of synaptically induced signals (data not shown, p < 0.001, repeated-measures analysis of variance (ANOVA)). Similarly, nuclear calcium responses to depolarization with voltage clamp to −20 mV were smaller than those to bath application of 40 mM K+ (HiK) in the same cell (depolarization to −20 mV: 0.11 ± 0.03% ΔF/F0; HiK: 0.55 ± 0.04% ΔF/F0; n =16; Fig. 4 C). Both methods of depolarization resulted in a membrane potential of ∼−20 mV, which in principle should produce similar calcium responses. Similar differences were recorded in the presence of TTX (data not shown). Since both synaptic stimulation trains and HiK responses activate nuclear calcium signals in nearby cells that are not activated by single-cell depolarization with voltage clamp or our spike-only protocols, we reasoned that the larger nuclear calcium responses to synaptic stimulation and HiK were largely caused by scattered light from neighboring cells, which cannot be excluded with wide-field microscopy. To correct for this, we normalized our data for synaptic trains and spike trains to the depolarization responses to HiK and voltage clamp depolarization to −20 mV, respectively. This correction fully accounted for the differences in nuclear calcium responses to TBS and largely compensated for the differences with HFS (Fig. 4 B), although considering the imprecise nature of our data correction, we cannot exclude a contribution of calcium from sources other than VOCCs. The successive increase in nuclear calcium responses to repeated trains of action potentials was identical to that seen with synaptic stimulation for the prerecorded spike trains, but not for uniform spike trains. These data suggest that the increasing spike numbers evoked by successive stimulation trains causes rather than just correlates with the parallel increasing nuclear calcium responses with successive stimulation trains.
Nuclear calcium signals activated by repeated HFS require NMDA receptors and L-Type VOCCS
Previous studies using small-molecule calcium indicators implicated VOCCs in HFS-induced somatic calcium signals and the induction of LTP (10,13,36–38). Using a recombinant indicator, we also found that nuclear calcium signals and the number of action potentials evoked by repeated trains of HFS were greatly reduced by the L-type VOCC blocker, nifedipine (percentage decrease for trains 1–6 relative to control: calcium using GCaMP2.0-NLS: 60, 82, 83, 83, 83, 85; spikes 43, 66, 58, 65, 60, 59; p < 0.001; Fig. 5, B and D). The fold increase in nuclear calcium responses from the first to the largest response decreased slightly from 5.81 ± 0.31 (259 cells in seven slices) in control conditions to 3.35 ± 0.35 (305 cells in six slices) after nifedipine treatment (p < 0.00001, independent t-test).
Figure 5.
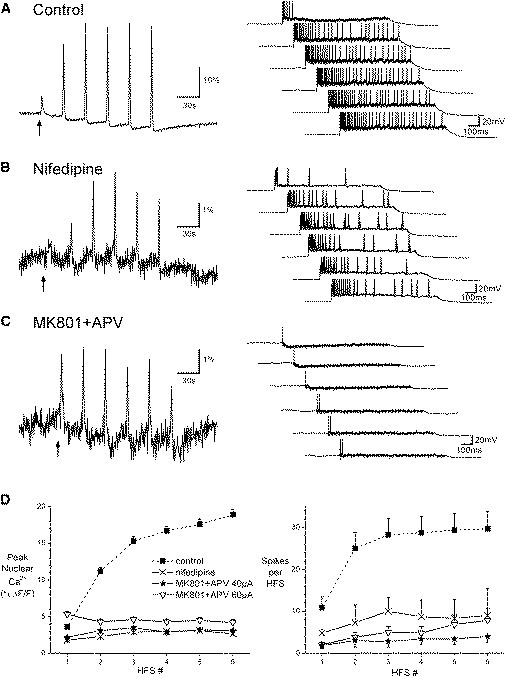
Nuclear calcium signals require NMDA receptors and L-type VOCCs. (A–C) Representative average calcium signals (GCaMP2.0-NLS, left; 25–44 cells per slice) and membrane potential recordings (right) from slices stimulated with six trains of HFS. The presentation of the first stimulation train is indicated by the arrow. Recordings were made under control conditions (A) or in the presence of either 10 μM nifedipine (B) or 10 μM MK801 and 50 μM APV (C). (D) Histograms show the average amplitude of nuclear calcium signals (left) and number of action potentials (right) evoked by HFS under control conditions (n = 359 cells in six slices) or after preincubation with nifedipine (15–18 min preincubation, n = 305 cells in six slices), or APV and MK801 (10–18 min preincubation, n = 202 cells in five slices using 40 μA stimulation; 276 cells in six slices using 60 μA stimulation). The stimulation intensities for control and nifedipine experiments were between 35 and 50 μA.
The dependence of CA1 LTP and hippocampus-dependent learning and memory on NMDA receptors is well established; however, the contribution of NMDA receptors to HFS-induced nuclear calcium signals is unknown. Blockade of NMDA receptors via 8–12 min preincubation with a combined application of APV and MK-801 dramatically reduced the nuclear calcium transient amplitudes and the number of action potentials generated in response to HFS trains (percentage decrease for trains 1–6 relative to control: calcium: 51, 76, 80, 83, 82, 83; spikes: 79, 86, 88, 86, 84, 82; p < 0.0001; Fig. 5, C and D). NMDA receptor blockade with MK801 and APV also greatly reduced the progressive increase in nuclear calcium responses to successive HFS trains. The fold increase in nuclear calcium responses from the first to the largest response decreased from 5.81 ± 0.31 (259 cells in seven slices) in control conditions to 1.91 ± 0.056 (202 cells in five slices) after MK801 + APV treatment (p < 0.00001, independent t-test). NMDA receptor blockade caused a rightward shift of the IO curve for stimulation intensity and EPSP amplitude (data not shown) and a small increase in the stimulation intensity necessary to evoke an action potential (MK-801 + APV: 66 ± 12 μA, n = 6; control slices from the same animals: 48 ± 6 μA, n = 17). However, increasing the stimulation intensity of HFS trains only partially restored the spike and nuclear calcium responses (Fig. 5 D). NMDA receptor blockade with APV was previously shown to shift the IO curve for spikes generated by HFS trains (39). This suggests that the blockade of nuclear calcium signals by NMDA receptor antagonists is due to their suppression of synaptically evoked action potentials and especially of HFS-induced bursts.
mGluR receptors and calcium release from internal stores do not contribute to nuclear calcium signals activated by repeated HFS trains at threshold intensities
Because mGluR receptors and IP3-mediated release of calcium from internal stores have been shown to be evoked by synaptic stimulation trains in CA1 pyramidal cells (16,18–20), we next investigated their involvement in nuclear calcium signals evoked by trains of HFS at threshold stimulation intensity. The group I and II mGluR receptor antagonist (RS)-a-methyl-4-carboxyphenylglycine (MCPG) had no effect on nuclear calcium or spike responses to HFS trains (n = 3; Fig. 6, A and D). Similarly, perfusion with the SERCA pump inhibitor cyclopiazonic acid (CPA, 30 μM, 20 min) had little effect on HFS-evoked nuclear calcium responses or the number of action potentials evoked by a series of HFS trains (n = 4; Fig. 6, B and D). Similar results were seen after 60 min perfusion with CPA (n = 2; data not shown). Prolonged incubation for 120 min in another SERCA pump inhibitor, thapsigargin, also did not significantly affect nuclear calcium or spike responses to a series of HFS trains (Fig. 6, C and D). The passive membrane properties, threshold stimulation intensity, and PP ratios in thapsigargin-treated slices did not differ from control values (data not shown). We also compared responses to a series of HFS trains before and after MCPG or CPA application in the same cell (Fig. 6 E). Spike and nuclear calcium responses remained potentiated during the MCPG or CPA application period causing normalized responses to show a massive increase in the first and second HFS trains. This within-cell, repeated-measures design confirmed the absence of mGluR-activated calcium release from internal stores to nuclear calcium signals evoked by repeated HFS trains. To verify that our CPA treatment was sufficient to empty the stores, we recorded somatic calcium responses to uncaging of IP3 and found that 20 min of CPA perfusion completely abolished IP3-mediated store release (Fig. 6, F and G) without affecting the calcium response to a depolarization to 0 mV (Fig. 6 H). In summary, these data show a lack of contribution of mGluR receptors and calcium release from internal stores to nuclear calcium responses to a series of HFS trains, in line with the absence of regenerative calcium signals at this threshold stimulation intensity (see Fig. 2). Furthermore, the lack of effect of CPA or thapsigargin on the increase in nuclear calcium responses to successive HFS trains suggests that this increment is not due to a loading of internal stores via the SERCA pumps between stimulation trains.
Figure 6.
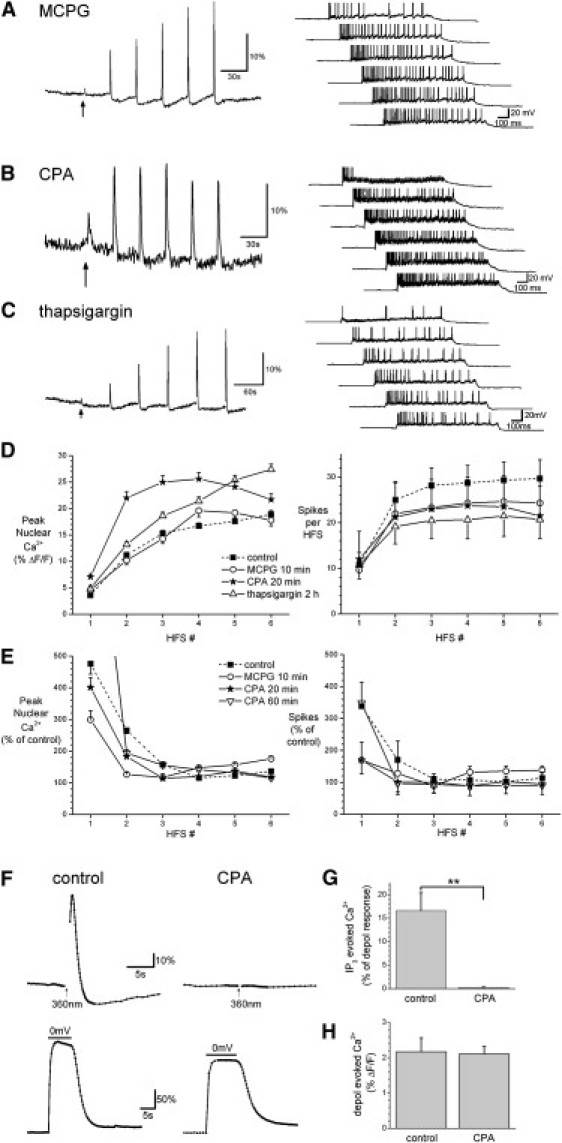
HFS-evoked nuclear calcium signals at threshold stimulation intensities do not require mGluR activation or release from internal stores. Nuclear calcium responses (left, averaged from 26–42 cells near the patched cell) and spikes (right) recorded after application of (A) MCPG (500 μM, 10 min) or (B) CPA (30 μM, 20 min), or (C) preincubation in thapsigargin (3 μM, 2 h). (D) Summary data for A–C. MCPG n = 97 cells in three slices; CPA n = 168 cells in four slices; thapsigargin n = 415 cells in 12 slices. (E) Summary data for CPA or MCPG treatment in slices where responses were normalized to those from an identical series of HFS trains given before drug application in the same slice (control n = 165 cells in five slices, MCPG n = 237 cells in six slices, CPA 30 min n = 368 cells in seven slices, CPA 60 min n = 98 cells in two slices). (F) Somatic calcium responses measured with Fluo-4 in response to uncaging of NPE-IP3 with a 40 ms exposure to 360 nm light (top) and depolarization to 0 mV (bottom) after 20 min perfusion with control ACSF (left, n = 4) or CPA (30 μM, right, n = 4). The control and CPA recordings came from separate neurons. (G) Summary histogram of the data shown in F, where responses to NPE-IP3 uncaging have been normalized to depolarization responses in the same cell. (H) Summary data for depolarization responses in F and G.
Discussion
Nuclear calcium has emerged as an important regulator of the activity-induced genomic responses that are required for long-term memory and neuronal survival. Using what we believe to be novel recombinant calcium sensors targeted to the cell nucleus, we show here that nuclear calcium signals greatly increase in amplitude over the first three to five stimulation trains of typical L-LTP-inducing stimulation protocols in parallel with an increase in action potential generation. The transition from E-LTP, induced by a single stimulation train, to L-LTP induced by multiple train repetitions correlates with this dramatic increase in nuclear calcium signaling, which may be necessary for transcriptional activation.
Recombinant nuclear targeted indicators: advantages and problems
Given the broad interest in localized subcellular calcium signaling, the targeting of recombinant calcium indicators to subcellular compartments is emerging as a technique with great potential. GCaMP2.0 is well suited for detecting nuclear signals in vivo due to its high signal/noise ratio, stable expression and folding at 37°C, fast association, and dissociation constants, and because it can be delivered by stereotaxic injection, in utero electroporation, or mutant animal lines (this study) (26,30). The number of cells available for simultaneous imaging is almost limitless, and the specificity of the signal to the nuclear compartment relieves the need to spatially resolve the nucleus with the imaging system and avoids any effects of calcium buffering by the indicator in the cytoplasm.
A number of technological hurdles surrounding recombinant calcium indicators still remain. First, GECIs based on circularly permutated GFP variants are notoriously difficult to calibrate and thus translate into calcium concentrations due to their nonlinear calcium-binding curves and emission-dependent photoisomerization (29,40). Photoisomerization difficulties can partly be overcome with slow regular imaging rates, as we have done, but may also be reduced with techniques that minimize illumination. IP also showed some bleaching typical of YFP-based constructs that imposed a steady baseline drift in some recordings. Second, IP, GCaMP1.6, and GCaMP2.0 show steep Hill coefficients (29,41), reducing the calcium concentration range over which they respond. This may cause weak fluorescence under baseline conditions, as we found for GCaMP1.6 and as reported for GCaMP2.0 localized to the plasma membrane (30). However, we found GCaMP2.0 to be bright enough to identify individual nuclei in baseline conditions.
Synaptically induced regenerative calcium signals
It is not known whether regenerative calcium signals contribute to nuclear calcium signaling during LTP induction. Although our study was primarily limited to stimulation at threshold intensities, we also found that higher stimulation intensities elicited regenerative nuclear calcium signals in large numbers of cells. The delayed peak of these nuclear calcium signals indicates that they are likely due to a wave phenomenon mediated by regenerative release from internal calcium stores, because synaptically activated calcium release, in contrast to VOCC or NMDA receptor-mediated calcium influx, exhibits a distinct delay (14,16,18,20,31,32). It is thought that regenerative calcium release is IP3 receptor-dependent and can generate synaptic stimulation-evoked calcium waves that propagate from the proximal dendrite to the soma in pyramidal neurons of the neocortex and hippocampus (16,18–20). Although much of this work employed conditions that pharmacologically enhance or isolate IP3 signaling, synaptically evoked calcium waves also occur in the absence of pharmacological manipulation (15,18,20,42). Using threshold stimulation intensities and physiological solutions at 32°C, we rarely observed delayed nuclear calcium signals indicative of wave phenomena in response to one series of six stimulation trains of TBS or HFS. Furthermore, our experiments showed no reduction in nuclear calcium signal after store depletion, which is a curious result given the proposed role of regenerative calcium waves in signaling from the synapse to the nucleus (15–18,20,21,32). However, previous reports have also shown that IP3 receptor function and release from internal stores are not necessary for nuclear calcium signals evoked during L-LTP induction with repeated trains of TBS or HFS (10,36). Thus, it seems that repeated HFS trains at threshold stimulation intensities sufficient to induce L-LTP activate nuclear calcium signals that are greatly increased by train repetition but do not require store release or regenerative calcium waves.
Mechanism of enhanced nuclear calcium responses to repeated stimulation trains
The findings presented here suggest that train repetition, one of the most ubiquitously used methods for inducing robust and long-lasting LTP (10,33–35), activates a switch in nuclear calcium dynamics. Nuclear calcium responses to bursts of synaptic activity were markedly potentiated during repetitive trains of HFS or TBS. A previous study using nontargeted small-molecule indicators also revealed this phenomenon, which was specific to the soma and nucleus but absent in dendrites and spines (36). The progressive increase in nuclear calcium responses with successive stimulation trains represents a major difference in the nuclear calcium signal activated by such E-LTP and L-LTP protocols.
The time course of increasing nuclear calcium signals suggests that they do not result from a simple summation of responses. We found that nuclear calcium signals evoked by trains at threshold stimulation intensities rapidly return to baseline within 10 s of the stimulus, consistent with the findings of two-photon imaging studies (10,36). A more likely mechanism for the augmentation of nuclear calcium responses we observed involves cumulative post-tetanic potentiation (PTP). Short-term potentiation increases EPSP amplitude, which in turn facilitates action potential generation and thus calcium influx through VOCCs. We found that spikes and nuclear calcium signals increased with train repetitions at intervals of 30 s to 5 min, consistent with the persistence of PTP for 5–10 min (43). The loading of intracellular stores by SERCA pumps between trains could also contribute to the increment in nuclear calcium responses to repeated stimulation trains by priming the neuron for calcium release (42,44); however, this increment was not affected by blockers of SERCA pump activity in our experiments (see above). Thus, we propose that PTP grows over the first few train repetitions to potentiate spiking, depolarization-activated calcium influx, and nuclear calcium responses.
NMDA receptors versus VOCCs in nuclear calcium signals
We found that L-type VOCCs are important for nuclear calcium responses to trains of synaptic HFS, in line with previous reports that somatic calcium signals exhibit a strict dependence on action potential firing (45,46). The somatodendritic localization (47) and relative lack of inactivation (48) of L-type VOCCs make them a likely candidate for directly contributing to nuclear calcium signals. Another potential indirect effect of nifedipine would be to block presynaptic mechanisms of PTP (49); this might mediate the increment of nuclear calcium responses to successive trains (see above), which is also reduced by nifedipine. Whether direct or indirect, the role of L-type VOCCs in synaptically activated nuclear calcium signals seems consistent with the correlation we observe between nuclear calcium signals and somatic action potential generation, and the role of L-type VOCCs in activity-dependent gene expression (13,50–52).
We show that NMDA function is necessary for HFS-stimulated action potential generation and nuclear calcium signals. The blockade of synaptically induced spiking by NMDA receptor antagonists will reduce calcium entry through VOCCs, which may at least partly explain the reduced calcium signals. Thus, calcium flux through NMDA receptors may not directly contribute to nuclear calcium signals, but rather promote action potential generation. This in turn would generate or amplify VOCC-mediated calcium signals, as was previously proposed to underlie the NMDA receptor dependency of Schaffer collateral LTP induced by HFS (39). The NMDA receptor dependency of increased nuclear calcium signaling due to HFS repetition in our results relates directly to the involvement of NMDA receptors in L-LTP induced by HFS repetition (34) and transcriptional responses to synaptic activity (1,2,53–55). NMDA receptor function is also necessary for PTP and short-term potentiation resulting from either HFS or TBS (10,34,56), in line with our proposed role of PTP in the potentiation of nuclear calcium responses to successive HFS trains (see above). Despite their localization at synapses distant from the soma, it seems that NMDA receptors play a permissive role in synaptic activity-induced nuclear calcium signaling.
Implications for gene expression and L-LTP
The incremental nature of nuclear calcium responses to successive stimulation trains may play an important role in the summation or potentiation of calcium-dependent signaling cascades, which instigate L-LTP. It seems that repetition is the key feature of synaptic input, which greatly amplifies nuclear calcium signaling and thereby activates the genomic responses that are necessary for long-lasting plasticity and survival. Exploring the implications of this finding for learning will require further testing in in vivo learning paradigms. Fortunately, compartmentally targeted recombinant calcium indicators like GCaMP2.0-NLS are suitable for such applications.
Acknowledgments
We thank Iris Bünzli-Ehret for dissociated cell culture preparation, Ruth Jelinek for virus production, Désirée Ditzel for organotypic slice culture preparation and infection, and Anna Hagenston for her comments on the manuscript.
This work was supported by the Alexander von Humboldt Foundation (Wolgang Paul Prize to H.B.), a European Research Council Advanced Grant (H.B.), the EU Project GRIPANNT, the EU Network of Excellence NeuroNE, and the Sonderforschungsbereich (SFB 488 and SFB 636). H.B. is a member of the Excellence Cluster CellNetworks at Heidelberg University.
Supporting Material
References
- 1.Bading H., Ginty D.D., Greenberg M.E. Regulation of gene expression in hippocampal neurons by distinct calcium signaling pathways. Science. 1993;260:181–186. doi: 10.1126/science.8097060. [DOI] [PubMed] [Google Scholar]
- 2.Hardingham G.E., Arnold F.J., Bading H. Nuclear calcium signaling controls CREB-mediated gene expression triggered by synaptic activity. Nat. Neurosci. 2001;4:261–267. doi: 10.1038/85109. [DOI] [PubMed] [Google Scholar]
- 3.Hardingham G.E., Chawla S., Bading H. Distinct functions of nuclear and cytoplasmic calcium in the control of gene expression. Nature. 1997;385:260–265. doi: 10.1038/385260a0. [DOI] [PubMed] [Google Scholar]
- 4.Limbäck-Stokin K., Korzus E., Mayford M. Nuclear calcium/calmodulin regulates memory consolidation. J. Neurosci. 2004;24:10858–10867. doi: 10.1523/JNEUROSCI.1022-04.2004. [DOI] [PMC free article] [PubMed] [Google Scholar]
- 5.Nguyen P.V., Abel T., Kandel E.R. Requirement of a critical period of transcription for induction of a late phase of LTP. Science. 1994;265:1104–1107. doi: 10.1126/science.8066450. [DOI] [PubMed] [Google Scholar]
- 6.Papadia S., Stevenson P., Hardingham G.E. Nuclear Ca2+ and the cAMP response element-binding protein family mediate a late phase of activity-dependent neuroprotection. J. Neurosci. 2005;25:4279–4287. doi: 10.1523/JNEUROSCI.5019-04.2005. [DOI] [PMC free article] [PubMed] [Google Scholar]
- 7.Hardingham G.E., Bading H. Synaptic versus extrasynaptic NMDA receptor signalling: implications for neurodegenerative disorders. Nat. Rev. Neurosci. 2010;11:682–696. doi: 10.1038/nrn2911. [DOI] [PMC free article] [PubMed] [Google Scholar]
- 8.Zhang S.J., Steijaert M.N., Bading H. Decoding NMDA receptor signaling: identification of genomic programs specifying neuronal survival and death. Neuron. 2007;53:549–562. doi: 10.1016/j.neuron.2007.01.025. [DOI] [PubMed] [Google Scholar]
- 9.Zhang S.J., Zou M., Bading H. Nuclear calcium signaling controls expression of a large gene pool: identification of a gene program for acquired neuroprotection induced by synaptic activity. PLoS Genet. 2009;5:e1000604. doi: 10.1371/journal.pgen.1000604. [DOI] [PMC free article] [PubMed] [Google Scholar]
- 10.Raymond C.R., Redman S.J. Spatial segregation of neuronal calcium signals encodes different forms of LTP in rat hippocampus. J. Physiol. 2006;570:97–111. doi: 10.1113/jphysiol.2005.098947. [DOI] [PMC free article] [PubMed] [Google Scholar]
- 11.Nakamura T., Lasser-Ross N., Ross W.N. Spatial segregation and interaction of calcium signalling mechanisms in rat hippocampal CA1 pyramidal neurons. J. Physiol. 2002;543:465–480. doi: 10.1113/jphysiol.2002.020362. [DOI] [PMC free article] [PubMed] [Google Scholar]
- 12.Nakazawa H., Murphy T.H. Activation of nuclear calcium dynamics by synaptic stimulation in cultured cortical neurons. J. Neurochem. 1999;73:1075–1083. doi: 10.1046/j.1471-4159.1999.0731075.x. [DOI] [PubMed] [Google Scholar]
- 13.Miyakawa H., Ross W.N., Johnston D. Synaptically activated increases in Ca2+ concentration in hippocampal CA1 pyramidal cells are primarily due to voltage-gated Ca2+ channels. Neuron. 1992;9:1163–1173. doi: 10.1016/0896-6273(92)90074-n. [DOI] [PubMed] [Google Scholar]
- 14.Kapur A., Yeckel M., Johnston D. Hippocampal mossy fiber activity evokes Ca2+ release in CA3 pyramidal neurons via a metabotropic glutamate receptor pathway. Neuroscience. 2001;107:59–69. doi: 10.1016/s0306-4522(01)00293-7. [DOI] [PMC free article] [PubMed] [Google Scholar]
- 15.Watanabe S., Hong M., Ross W.N. Modulation of calcium wave propagation in the dendrites and to the soma of rat hippocampal pyramidal neurons. J. Physiol. 2006;575:455–468. doi: 10.1113/jphysiol.2006.114231. [DOI] [PMC free article] [PubMed] [Google Scholar]
- 16.Larkum M.E., Watanabe S., Ross W.N. Synaptically activated Ca2+ waves in layer 2/3 and layer 5 rat neocortical pyramidal neurons. J. Physiol. 2003;549:471–488. doi: 10.1113/jphysiol.2002.037614. [DOI] [PMC free article] [PubMed] [Google Scholar]
- 17.Power J.M., Sah P. Nuclear calcium signaling evoked by cholinergic stimulation in hippocampal CA1 pyramidal neurons. J. Neurosci. 2002;22:3454–3462. doi: 10.1523/JNEUROSCI.22-09-03454.2002. [DOI] [PMC free article] [PubMed] [Google Scholar]
- 18.Nakamura T., Barbara J.G., Ross W.N. Synergistic release of Ca2+ from IP3-sensitive stores evoked by synaptic activation of mGluRs paired with backpropagating action potentials. Neuron. 1999;24:727–737. doi: 10.1016/s0896-6273(00)81125-3. [DOI] [PubMed] [Google Scholar]
- 19.Nakamura T., Nakamura K., Ross W.N. Inositol 1,4,5-trisphosphate (IP3)-mediated Ca2+ release evoked by metabotropic agonists and backpropagating action potentials in hippocampal CA1 pyramidal neurons. J. Neurosci. 2000;20:8365–8376. doi: 10.1523/JNEUROSCI.20-22-08365.2000. [DOI] [PMC free article] [PubMed] [Google Scholar]
- 20.Hagenston A.M., Fitzpatrick J.S., Yeckel M.F. MGluR-mediated calcium waves that invade the soma regulate firing in layer V medial prefrontal cortical pyramidal neurons. Cereb. Cortex. 2008;18:407–423. doi: 10.1093/cercor/bhm075. [DOI] [PMC free article] [PubMed] [Google Scholar]
- 21.Berridge M.J. Neuronal calcium signaling. Neuron. 1998;21:13–26. doi: 10.1016/s0896-6273(00)80510-3. [DOI] [PubMed] [Google Scholar]
- 22.Brini M., Murgia M., Rizzuto R. Nuclear Ca2+ concentration measured with specifically targeted recombinant aequorin. EMBO J. 1993;12:4813–4819. doi: 10.1002/j.1460-2075.1993.tb06170.x. [DOI] [PMC free article] [PubMed] [Google Scholar]
- 23.Miyawaki A., Llopis J., Tsien R.Y. Fluorescent indicators for Ca2+ based on green fluorescent proteins and calmodulin. Nature. 1997;388:882–887. doi: 10.1038/42264. [DOI] [PubMed] [Google Scholar]
- 24.Nagai T., Sawano A., Miyawaki A. Circularly permuted green fluorescent proteins engineered to sense Ca2+ Proc. Natl. Acad. Sci. USA. 2001;98:3197–3202. doi: 10.1073/pnas.051636098. [DOI] [PMC free article] [PubMed] [Google Scholar]
- 25.Ohkura M., Matsuzaki M., Nakai J. Genetically encoded bright Ca2+ probe applicable for dynamic Ca2+ imaging of dendritic spines. Anal. Chem. 2005;77:5861–5869. doi: 10.1021/ac0506837. [DOI] [PubMed] [Google Scholar]
- 26.Tallini Y.N., Ohkura M., Kotlikoff M.I. Imaging cellular signals in the heart in vivo: Cardiac expression of the high-signal Ca2+ indicator GCaMP2. Proc. Natl. Acad. Sci. USA. 2006;103:4753–4758. doi: 10.1073/pnas.0509378103. [DOI] [PMC free article] [PubMed] [Google Scholar]
- 27.Arnold F.J., Hofmann F., Bading H. Microelectrode array recordings of cultured hippocampal networks reveal a simple model for transcription and protein synthesis-dependent plasticity. J. Physiol. 2005;564:3–19. doi: 10.1113/jphysiol.2004.077446. [DOI] [PMC free article] [PubMed] [Google Scholar]
- 28.Hendel T., Mank M., Reiff D.F. Fluorescence changes of genetic calcium indicators and OGB-1 correlated with neural activity and calcium in vivo and in vitro. J. Neurosci. 2008;28:7399–7411. doi: 10.1523/JNEUROSCI.1038-08.2008. [DOI] [PMC free article] [PubMed] [Google Scholar]
- 29.Pologruto T.A., Yasuda R., Svoboda K. Monitoring neural activity and [Ca2+] with genetically encoded Ca2+ indicators. J. Neurosci. 2004;24:9572–9579. doi: 10.1523/JNEUROSCI.2854-04.2004. [DOI] [PMC free article] [PubMed] [Google Scholar]
- 30.Mao T., O'Connor D.H., Svoboda K. Characterization and subcellular targeting of GCaMP-type genetically-encoded calcium indicators. PLoS ONE. 2008;3:e1796. doi: 10.1371/journal.pone.0001796. [DOI] [PMC free article] [PubMed] [Google Scholar]
- 31.Miller L.D., Petrozzino J.J., Connor J.A. Ca2+ release from intracellular stores induced by afferent stimulation of CA3 pyramidal neurons in hippocampal slices. J. Neurophysiol. 1996;76:554–562. doi: 10.1152/jn.1996.76.1.554. [DOI] [PubMed] [Google Scholar]
- 32.Power J.M., Sah P. Distribution of IP3-mediated calcium responses and their role in nuclear signalling in rat basolateral amygdala neurons. J. Physiol. 2007;580:835–857. doi: 10.1113/jphysiol.2006.125062. [DOI] [PMC free article] [PubMed] [Google Scholar]
- 33.Morgan S.L., Teyler T.J. Electrical stimuli patterned after the θ-rhythm induce multiple forms of LTP. J. Neurophysiol. 2001;86:1289–1296. doi: 10.1152/jn.2001.86.3.1289. [DOI] [PubMed] [Google Scholar]
- 34.Huang Y.Y., Nguyen P.V., Kandel E.R. Long-lasting forms of synaptic potentiation in the mammalian hippocampus. Learn. Mem. 1996;3:74–85. doi: 10.1101/lm.3.2-3.74. [DOI] [PubMed] [Google Scholar]
- 35.Huang Y.Y., Kandel E.R. Recruitment of long-lasting and protein kinase A-dependent long-term potentiation in the CA1 region of hippocampus requires repeated tetanization. Learn. Mem. 1994;1:74–82. [PubMed] [Google Scholar]
- 36.Johenning F.W., Holthoff K. Nuclear calcium signals during L-LTP induction do not predict the degree of synaptic potentiation. Cell Calcium. 2007;41:271–283. doi: 10.1016/j.ceca.2006.07.005. [DOI] [PubMed] [Google Scholar]
- 37.Grover L.M., Teyler T.J. Two components of long-term potentiation induced by different patterns of afferent activation. Nature. 1990;347:477–479. doi: 10.1038/347477a0. [DOI] [PubMed] [Google Scholar]
- 38.Morgan S.L., Teyler T.J. VDCCs and NMDARs underlie two forms of LTP in CA1 hippocampus in vivo. J. Neurophysiol. 1999;82:736–740. doi: 10.1152/jn.1999.82.2.736. [DOI] [PubMed] [Google Scholar]
- 39.Zhao M., Adams J.P., Dudek S.M. Pattern-dependent role of NMDA receptors in action potential generation: consequences on extracellular signal-regulated kinase activation. J. Neurosci. 2005;25:7032–7039. doi: 10.1523/JNEUROSCI.1579-05.2005. [DOI] [PMC free article] [PubMed] [Google Scholar]
- 40.Nakai J., Ohkura M., Imoto K. A high signal-to-noise Ca(2+) probe composed of a single green fluorescent protein. Nat. Biotechnol. 2001;19:137–141. doi: 10.1038/84397. [DOI] [PubMed] [Google Scholar]
- 41.Knöpfel T., Díez-García J., Akemann W. Optical probing of neuronal circuit dynamics: genetically encoded versus classical fluorescent sensors. Trends Neurosci. 2006;29:160–166. doi: 10.1016/j.tins.2006.01.004. [DOI] [PubMed] [Google Scholar]
- 42.Hong M., Ross W.N. Priming of intracellular calcium stores in rat CA1 pyramidal neurons. J. Physiol. 2007;584:75–87. doi: 10.1113/jphysiol.2007.137661. [DOI] [PMC free article] [PubMed] [Google Scholar]
- 43.Zucker R.S. Short-term synaptic plasticity. Annu. Rev. Neurosci. 1989;12:13–31. doi: 10.1146/annurev.ne.12.030189.000305. [DOI] [PubMed] [Google Scholar]
- 44.Pozzo-Miller L.D., Pivovarova N.B., Andrews S.B. Activity-dependent calcium sequestration in dendrites of hippocampal neurons in brain slices. J. Neurosci. 1997;17:8729–8738. doi: 10.1523/JNEUROSCI.17-22-08729.1997. [DOI] [PMC free article] [PubMed] [Google Scholar]
- 45.Garaschuk O., Milos R.I., Konnerth A. Optical monitoring of brain function in vivo: from neurons to networks. Pflugers Arch. 2006;453:385–396. doi: 10.1007/s00424-006-0150-x. [DOI] [PubMed] [Google Scholar]
- 46.Smetters D., Majewska A., Yuste R. Detecting action potentials in neuronal populations with calcium imaging. Methods. 1999;18:215–221. doi: 10.1006/meth.1999.0774. [DOI] [PubMed] [Google Scholar]
- 47.Westenbroek R.E., Ahlijanian M.K., Catterall W.A. Clustering of L-type Ca2+ channels at the base of major dendrites in hippocampal pyramidal neurons. Nature. 1990;347:281–284. doi: 10.1038/347281a0. [DOI] [PubMed] [Google Scholar]
- 48.Catterall W.A. Structure and regulation of voltage-gated Ca2+ channels. Annu. Rev. Cell Dev. Biol. 2000;16:521–555. doi: 10.1146/annurev.cellbio.16.1.521. [DOI] [PubMed] [Google Scholar]
- 49.Jensen K., Jensen M.S., Lambert J.D. Role of presynaptic L-type Ca2+ channels in GABAergic synaptic transmission in cultured hippocampal neurons. J. Neurophysiol. 1999;81:1225–1230. doi: 10.1152/jn.1999.81.3.1225. [DOI] [PubMed] [Google Scholar]
- 50.Murphy T.H., Worley P.F., Baraban J.M. L-type voltage-sensitive calcium channels mediate synaptic activation of immediate early genes. Neuron. 1991;7:625–635. doi: 10.1016/0896-6273(91)90375-a. [DOI] [PubMed] [Google Scholar]
- 51.Deisseroth K., Bito H., Tsien R.W. Signaling from synapse to nucleus: postsynaptic CREB phosphorylation during multiple forms of hippocampal synaptic plasticity. Neuron. 1996;16:89–101. doi: 10.1016/s0896-6273(00)80026-4. [DOI] [PubMed] [Google Scholar]
- 52.Lee P.R., Cohen J.E., Fields R.D. Gene expression in the conversion of early-phase to late-phase long-term potentiation. Ann. N. Y. Acad. Sci. 2005;1048:259–271. doi: 10.1196/annals.1342.023. [DOI] [PubMed] [Google Scholar]
- 53.Hardingham G.E., Bading H. Coupling of extrasynaptic NMDA receptors to a CREB shut-off pathway is developmentally regulated. Biochim. Biophys. Acta. 2002;1600:148–153. doi: 10.1016/s1570-9639(02)00455-7. [DOI] [PubMed] [Google Scholar]
- 54.Cole A.J., Saffen D.W., Worley P.F. Rapid increase of an immediate early gene messenger RNA in hippocampal neurons by synaptic NMDA receptor activation. Nature. 1989;340:474–476. doi: 10.1038/340474a0. [DOI] [PubMed] [Google Scholar]
- 55.Morgan J.I., Cohen D.R., Curran T. Mapping patterns of c-fos expression in the central nervous system after seizure. Science. 1987;237:192–197. doi: 10.1126/science.3037702. [DOI] [PubMed] [Google Scholar]
- 56.McNaughton B.L., Shen J., Barnes C.A. Persistent increase of hippocampal presynaptic axon excitability after repetitive electrical stimulation: dependence on N-methyl-D-aspartate receptor activity, nitric-oxide synthase, and temperature. Proc. Natl. Acad. Sci. USA. 1994;91:4830–4834. doi: 10.1073/pnas.91.11.4830. [DOI] [PMC free article] [PubMed] [Google Scholar]
Associated Data
This section collects any data citations, data availability statements, or supplementary materials included in this article.