

Abstract
The role of the mechanical properties of the initial lymphatic wall and of the surrounding tissue in supporting lymph formation and/or progression was studied in six anaesthetized, neuromuscularly blocked and mechanically ventilated rats. After mid-sternal thoracotomy, submesothelial initial lymphatics were identified on the pleural diaphragmatic surface through stereomicroscopy. An ‘in vivo’ lymphatic segment was prepared by securing two surgical threads around the vessel at a distance of ∼2.5 mm leaving the vessel in place. Two glass micropipettes were inserted into the lumen, one for intraluminar injections of 4.6 nl saline boluses and one for hydraulic pressure (Plymph) recording. The compliance of the vessel wall (Clymph) was calculated as the slope of the plot describing the change in segment volume as a function of the post-injection Plymph changes. Two superficial lymphatic vessel populations with a significantly different Clymph (6.7 ± 1.6 and 1.5 ± 0.4 nl mmHg−1 (mean ± s.e.m.), P < 0.001) were identified. In seven additional rats, the average elastic modulus of diaphragmatic tissue strips was determined by uniaxial tension tests to be 1.7 ± 0.3 MPa. Clymph calculated for an initial lymphatic completely surrounded by isotropic tissue was 0.068 nl mmHg−1, i.e. two orders of magnitude lower than in submesothelial lymphatics. Modelling of stress distribution in the lymphatic wall suggests that compliant vessels may act as reservoirs accommodating large absorbed fluid volumes, while lymphatics with stiffer walls serve to propel fluid through the lumen of the lymphatic vessel by taking advantage of the more efficient mechanical transmission of tissue stresses to the lymphatic lumen.
Introduction
The great majority of lymphatic networks are organized as an extended mesh of lymphatic capillaries, also called ‘initial lymphatics,’ characterized by an often discontinuous basal lamina and the presence of peripheral anchoring filaments linking lymphatic endothelial cells to the surrounding connective tissue and/or muscle fibres (Schmid-Schöenbein, 1990; Aukland & Reed, 1993). Initial lymphatics empty into progressively larger collecting vessels, delimited by a continuous basal membrane and surrounded by smooth muscles cells, through which the lymph leaves the tissue to eventually flow into the blood stream. Lymph formation depends upon the development of a transmural pressure gradient (ΔPtm) driving fluid from the interstitial tissue to the lumen of initial lymphatics. In lymphatics with smooth muscle cells in their wall, ΔPtm is sustained by spontaneous cyclic contractions of the vessel wall (Mawhinney & Roddie, 1973; Zweifach & Prather, 1975; McHale & Roddie, 1976; Hargens & Zweifach, 1977; Ohhashi et al. 1980; Benoit et al. 1989). In lymphatics not surrounded by intrinsic smooth muscle, ΔPtm depends upon phasic compression and expansion of initial lymphatics caused by arteriolar vasomotion, skeletal and/or smooth muscle contraction and/or tissue displacement (Schmid-Schöenbein, 1990; Aukland & Reed, 1993). Development of a time-variable ΔPtm requires tissue stresses to be transmitted to the initial lymphatics and converted into intraluminar pressure waves. The magnitude of force transmission varies according to: (a) the relative mechanical properties of the vessel wall and the adjacent tissue, with transmission being more effective in stiff vessels than in more distensible structures and (b) the distribution of fibre density and orientation in the vessel wall and tissue adjacent to the vessel. The target of this study was to investigate: (a) whether the mechanical properties of the tissue may affect the transmission of pressure to the lumen of the initial lymphatics and (b) whether the mechanical properties of the tissue affect lymph formation and/or flow.
The experimental phase of this study was performed on the submesothelial diaphragmatic lymphatic network that drains fluid, solutes and cells from the surrounding interstitial tissue and, through the lymphatic stomata (Wang, 1975; Negrini et al. 1991), from the pleural and peritoneal cavity. The stomata discharge into a mesh of submesothelial lacunae (Negrini et al. 1992) which, for their morphological and functional characteristics, may be considered as large initial lymphatics. Within the submesothelial tissue, the most superficial lacunae are delimited almost entirely by the mesothelium, while deeper ones are surrounded by the muscular and tendineous tissue over most of their surface (Grimaldi et al. 2006). Externally to the lymphatic endothelial layer, the wall of the submesothelial lymphatic lacunae may be supported by varying proportions of mesothelium and muscular and tendineous tissue. The hypothesis here is that the mechanical behaviour of the initial lymphatics depends upon the relative contributions of the tissue coat and the vessel surface. To test this hypothesis, the mechanical compliance of the initial lymphatics and the elastic modulus of the tissue were measured in the rat diaphragm and the distribution of stress in the initial vessel wall was simulated using a computational model. Our results suggest that tissue stiffness affects the stress distribution within the walls of terminal lymphatic structures, and thus plays a significant role in regulation of initial lymphatic function.
Methods
Adult male Wistar rats (mean body weight (± s.e.m.), 374.3 ± 15.7 g, n = 6) housed and handled following the guidelines of the University of Insubria ethical committee, were anaesthetised with an intraperitoneal injection of 75 mg kg−1 ketamine (Sigma Aldrich, Milan, Italy) plus 0.5 mg kg−1 medetomidine (Domitor, Pfizer). Additional half boluses of the same anaesthesia cocktail were given every hour until the end of the experiments, when animals were killed via an anaesthetic overdose. Once a deep surgical anaesthesia level had been attained, as evaluated from the absence of corneal reflexes, the rats were moved to a heated (37°C) blanket and placed in the supine position. Following tracheotomy, a T-shaped cannula was inserted into the trachea and connected to a heated pneumotacograph (Hans Rudolph, Inc., USA, model 8420) equipped with a dedicated amplifier (Hans Rudolph, Inc., model 1110A) to continuously record respiratory flow. The flow signal was digitised with a National Instruments BNC-2090 A/D board (100 Hz sampling rate) and integrated through dedicated LabView software (National Instruments Corporation, USA) to obtain respiratory tidal volume; both flow and volume signals were then displayed on a monitor screen and recorded in a data file on the hard drive.
Animals were neuromuscularly blocked with a single intravenous bolus of 0.2 ml of pancuronium bromide (Sigma Aldrich) solution (2 mg ml−1 in saline) via the femoral vein cannula. Immediately after blockade, the tracheal cannula was connected to a mechanical ventilator (Harvard Apparatus, model Inspira ASV DC1-7058, USA) and rats were ventilated with room air at a tidal volume and frequency automatically set by the ventilator on the basis of rat weight. The chest wall was opened by mid-sternal thoracotomy and the four to five most caudal ribs were carefully removed to expose the pleural diaphragmatic dome. Dehydration of the diaphragmatic tissue was prevented by frequently wetting the surface with a gentle flush of warm saline solution (37°C).
The lymphatic vessels running over the pleural surface of the diaphragm (Fig. 1A) were visualized through a stereomicroscope (SV11 Carl Zeiss, Milan, Italy) equipped with a cooled B/W CCD camera (ORCA ER, Hamamatsu, Milan, Italy) and connected to a PC running SimplePCI software (Hamamatsu) to control all aspects of image acquisition and analysis. As shown in previous studies (Grimaldi et al. 2006; Moriondo et al. 2008) the shape of the cross-section of the submesothelial lymphatics is typically approximated by an ellipse. The principal radius (rmax) of the ellipse, parallel to the parietal mesothelium covering the diaphragmatic surface, was measured from images acquired using SimplePCI. The smaller radius (rmin), perpendicular to the mesothelial surface, was not measurable by video imaging, but previous measurements (Grimaldi et al. 2006; Moriondo et al. 2008) estimated it to be 35% of rmax.
Figure 1. Subpleural lymphatic vessels and experimental set-up.
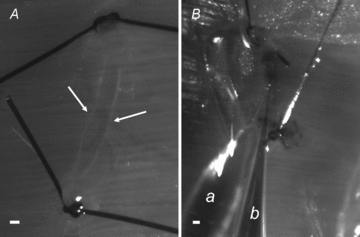
A, micrograph taken under white light epi-illumination of a lymphatic segment delimited by two occluding silk knots positioned at a distance of about 3300 μm along a linear submesothelial lymphatic vessel. Lymphatic vessels appear as darker-than-background conduits delimited by faint white borders (arrows). Underneath the lymphatic vessel, the diaphragmatic muscular fibres can be distinguished crossing the vessel almost perpendicularly. B, micrograph showing the simultaneous insertion of two micropipette tips into the lumen of a lymphatic segment prepared in a vessel belonging to a complex loop. Only the tract used for the measurements was ligated. a, micropipette for Plymph recording; b, micropipette for bolus injection. Scale bars: 200 μm.
In vivo measurement of the compliance of the diaphragmatic initial lymphatics (Clymph)
The mechanical compliance of the submesothelial initial lymphatics (Clymph) was measured in vivo in vessels (n = 6) identified on the pleural diaphragmatic surface. This experimental approach was chosen to maintain the diaphragm in conditions as close as possible to the physiological ones. In fact, the diaphragm is dome shaped and subject to complex stresses depending upon its anatomical insertions: medially to the oesophagus and to the mediastinal ligaments, laterally to the ribs and caudally to the hepatic sub-diaphragmatic ligaments. Although respiratory movements were abolished by neuromuscular blockade and chest opening, the lungs were ventilated with 50% oxygen in air, so that cardiac activity was completely preserved, allowing us to perform all measurements in the blood-perfused diaphragm.
Submesothelial lymphatics to be investigated were selected according to the possibility of simultaneously inserting two micropipette tips in their lumen. Due to the constraints of preparing an experimental field suitable for double micropuncture, the observed vessels were all located in the peripheral muscular region of the right hemi-diaphragm.
Once a vessel both long and wide enough (∼200 μm diameter) had been identified, two silk surgical threads (8/0 Viacryl) were secured around the vessel at a distance of ∼2.5 mm (Fig. 1A) leaving the vessel in place; by tightening the threads, the vessel segment was occluded at both ends, isolating the vessel segment from the remaining lymphatic network. Care was taken to avoid lymphatic segments with detectable intraluminar valves. Two glass micropipettes were inserted into the segment lumen (Fig. 1B) and held in place: one (micropipette a in Fig. 1B, average tip diameter ∼2–4 μm) was used to record intraluminar hydraulic lymphatic pressure (Plymph) prior, during and after sequential dye injections; the other (micropipette b in Fig. 1B, average tip diameter ∼30 μm) was used to deliver multiple sequential injections of lissamine green-coloured saline solution into the lymphatic segment lumen. All bolus injections were delivered through a single injecting micropipette while simultaneously recording Plymph through the recording micropipette. Micropipettes for microinjection were pulled with a vertical puller (PP30, Narishige, Tokyo, Japan) from borosilicate glass capillaries (WPI Europe, Berlin, Germany, 1B100-4, 1.0 mm OD, 0.58 mm ID), filled with mineral oil and mounted onto a mechanical microinjector (WPI Europe) set to deliver 4.6 nl injections. Under the stereomicroscope, micropipettes were front-filled with 1 μl of 0.2 μm filtered 2% lissamine in saline. The micropipette holder was mounted in a three-dimensional hydraulic micromanipulator (Joystick Micromanipulator MO-188 or MO-109, Narishighe, Tokyo, Japan) equipped with a fourth axial micromanipulator movement. Micropipettes for Plymph recordings were bevelled down to 2–4 μm tip diameter, filled with 1 m NaCl solution and secured to a micropipette holder filled with the same solution. The holder was connected to a mineral oil-filled pressure transducer (Gould Instruments System, Inc.), motor driven by an electro-hydraulic system (Dual Servonull pressure measuring system, Vista Electronics Company, Ramona, CA, USA). The pressure signal was conveyed to an amplifier and a signal conditioner (Model 6600, Gould Electronics), digitised with an A/D board (National Instruments Corporation, USA) and displayed on the monitor screen using dedicated LabView software (National Instruments Corporation). Prior to its use, each micropipette was calibrated in a modified Lucite box by imposing step changes of ± 5 mmHg in the box chamber; micropipettes displaying a non-linear calibration in the pressure range ± 30 mmHg were discarded. Electrical zeroing of the recording system was performed prior to micropipette insertion and immediately after extraction of the micropipette tip from the vessels at the end of all Plymph recordings by dipping the micropipette tip in a saline pool positioned at the same height as the micropipette insertion point. Criteria for acceptance of the micropipette pressure recordings were: (a) an unchanged electrical zero of the system on withdrawal from the tissue compared to pre-insertion value; (b) a stable pressure reading for at least 2 min; and (c) repeated measurements from the same area were within ± 1 mmHg.
The two micropipettes were sequentially inserted in the segment lumen. Each micropipette was longitudinally aligned over the lymphatic vessel to be injected with the lowest possible angle with respect to the diaphragmatic surface. Then the micropipette tip was gently advanced through the mesothelium until clearly inside the lymphatic lumen. Correct positioning of the recording micropipette tip in the vessel lumen was assessed both visually and from the stability of Plymph recording while moving the micropipette tip inside the vessel lumen. During the recording period (usually less than 5 min for each vessel), to avoid artefactual oscillations of Plymph due to the ventilator-supported inflation/deflation lung displacements, rats were temporarily disconnected from the ventilator and were oxygenated with a continuous intra-tracheal flux of 50% O2 in nitrogen at a continuous positive airway pressure of 7 mmHg. Multiple 4.6 nl dye boluses were injected in each lymphatic segment while simultaneously measuring Plymph in close proximity to the injection site. Up to 30 sequential injections were performed in the same vessel. Leaks of injected dye solution through lesions occurring in the vessels wall during micropipettes insertion, or through an imperfectly secured thread tie, were easily detected under stereomicroscopic view. This being the case, or in the event of obvious wall rupture, the dye rapidly spread to the tissue surrounding the vessel as the observed Plymph quickly decayed toward its pre-injection value. In these instances the data were discarded.
Images of the selected vessel segment were acquired immediately before and at the end of the measurements. Based on the limited number of large lymphatic ducts directly visible on the pleural diaphragmatic dome and on the technical difficulty of the preparation, at most one lymphatic vessel per rat could be used for determination of the lymphatic compliance. After completion of the experiments, at about 2 h from the anaesthesia induction, the animals were killed.
Uniaxial tension tests on tissue strips
A separate group of adult rats (n = 7) received an intraperitoneal overdose of the previously described anaesthetic cocktail. The thorax was immediately opened through a wide mid-sternal thoracotomy to expose the whole diaphragm which was then excised by carefully micro-dissecting the tendineous fibres around the phrenic centre and the muscular fibres along the external peripheral costal and vertebral margins. The excised diaphragm was first rinsed and then maintained in 4°C PBS. Tissue strips were cut from fresh diaphragm within 2–3 h of the anaesthesia overdose. Four tissue strips (∼8 mm long and ∼3 mm wide) were excised from: (1) the ventral hemi-diaphragm, dissected in the direction perpendicular to diaphragmatic fibres axis; (2) the ventral hemi-diaphragm, dissected in the direction parallel to fibres axis; (3) the dorsal hemi-diaphragm, dissected in the direction parallel to diaphragmatic fibres axis; and (4) the dorsal hemi-diaphragm, dissected in the direction perpendicular to fibres axis, as schematically depicted in Fig. 2A. Each sample was gripped with a testing machine (Fig. 2B; Enduratec ELF3200, Bose Corporation, Eden Prairie, MN, USA, equipped with a load cell of 22 N) and underwent a series of tension tests. The length between the grips was measured by a calliper after imposing a pre-load of 0.05 N and was defined as the initial sample length. To avoid dehydration, the samples were immersed in saline during the test. After 20 pre-conditioning cycles up to 20% strain, the specimens were exposed to the standard stress–relaxation test. Each relaxation test was performed by applying a fixed stretch corresponding to the desired strain and measuring the resulting force. Force and displacements were recorded during the test by the machine software and then processed to obtain strains (ɛ) and stresses (σ). The strain is defined as:
Figure 2. Tension tests on diaphragmatic tissue strips.
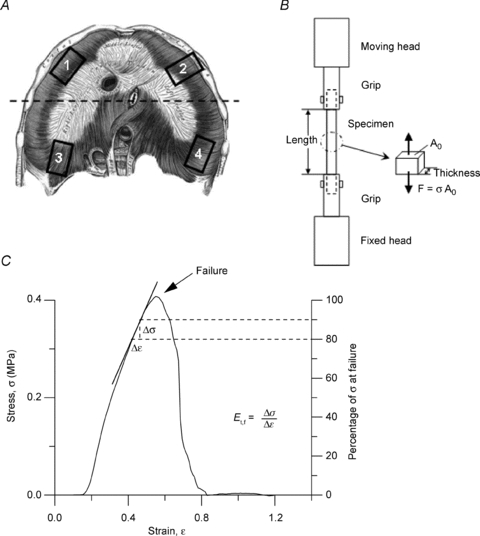
A, schematic drawing of the diaphragm with indication of the site of excision of the tissue strips: 1, ventral zone, transversal to major fibres axis; 2, ventral zone, longitudinal with respect to fibres axis; 3, dorsal zone, longitudinal to major fibres axis; 4, dorsal zone, transversal to fibres axis. B, schema of the apparatus used for tension test on diaphragmatic tissue strips. F, force measured by the machine; Ao, initial sample resistant area; σ, resulting stress. C, typical stress (σ)–strain (ɛ) plot until failure (arrow) of a diaphragmatic tissue strip. The elastic modulus before failure, Et,f, was graphically represented by the slope of the tangential line to the stress–strain curve at a stress of 80 to 90% of the failure stress (Failure = 100% on the right Y axis). Mathematically, Et,f was obtained as:  .
.
| (1) |
where l and l0 are the specimen length after elongation and the initial length, respectively. With the initial specimen resistant area (Ao), given by the product of specimen width (Wo) times thickness (ho), the stress, according to the Lagrangial description, is defined as:
| (2) |
where F is the measured force returned by the machine (Fig. 2B). Specimen width was measured by a calliper, whereas its thickness was measured, before the test sequence, by placing the sample between the machine grips and applying a small compressive load (5 mN) in the direction of the sample thickness. The step-wise test was defined as a series of four strain ramps, each 5% of the sample initial length, at a velocity of 10% s−1, followed by stress relaxation to equilibrium. The elastic modulus of the tissue (Et) for all of the tested strain levels was calculated from the stress–relaxation test as:
| (3) |
where Δσ and Δɛ are, respectively, variation of equilibrium stress (i.e. at the end of stress–relaxation) and variation of strain between successive ramps. After the last ramp, the samples were returned to the initial length and a constant velocity elongation of 10% s−1 was applied until specimen failure (Fig. 2C). The elastic modulus before failure (Et,f) is defined as the linear portion of the curve preceding the yield stress, the latter being the value of σ where the stress–strain curve bends before failure. As graphically indicated in Fig. 2C, in our experiments this linear portion was between 80 and 90% of the maximum stress.
The time relaxation constants (τ) were evaluated by fitting the relaxation curve to the following function:
| (4) |
Numerical evaluation of the lymphatic vessels elastic modulus
In order to estimate the relative contribution of the mesothelial and endothelial layers and of the muscular and tendineous coat to the mechanical properties of the diaphragmatic initial lymphatics, the finite element models method (FEM) was used to model the mechanics of the submesothelial lymphatics. The FEM model was developed using shell and solid elements provided by the commercial software ABAQUS (Hibbit Karlsson and Sorenses, Inc. Pawtucket, RI, USA), setting the large strain option on. FEM is a widely used numerical technique which in mechanics allows an approximation of a real object shape by dividing the object into smaller parts (or ‘elements’) and simultaneously solving each part. The number of the elements is considered appropriate when the numerical solution does not change when further increasing the number of elements. Three ideal typical initial diaphragmatic lymphatics were modelled: (a) a superficial lymphatic laying over the muscular/tendineous plane and delimited almost entirely by the mesothelium; (b) a lymphatic still partially delimited on one side by the mesothelium, but surrounded by the muscular/tendineous tissue over most of its lateral surface; and (c) a lymphatic completely surrounded by muscular/tendineous tissue. For the submesothelial lymphatics and underlying diaphragmatic tissue 2322 shell elements and 1634 solid elements were used, respectively; 9786 solid elements were required to reproduce the essential architecture of the deep lymphatics.
Shell and solid elements can carry forces and moments lying in their plane as well as transverse to their plane. In shell elements the thickness is small with respect to the other two dimensions therefore they are appropriate to model thin structures with an inherent bending stiffness like the lymphatic wall. Both the lymphatics and the tissue were represented as linear isotropic materials. The elastic modulus of the tissue was set equal to the Et,f determined by the tension tests, whereas the elastic modulus of the lymphatic wall, Elymph, was set to an estimated value that could be changed during the analysis. Model calculation of Clymph (Clymph-M) was performed with the equation:
| (5) |
with rmin and rmax being the smaller and larger vessel average vessel radii and l the vessel length.
The wall stress distribution was also extracted as an algorithm from the models.
Statistical analysis
Data are presented as mean ± standard error of the mean (s.e.m.). Statistical significance of the differences between mean values was computed using Student's t test provided the variance of the group was equal. In case of failure of the equal variance test, the differences were tested through the Mann–Whitney rank sum test. When required, a Kolmorogorov–Smirnov normality test was performed to verify the Gaussian distribution of a given parameter. Absolute values were compared by one-way ANOVA. Whenever one-way ANOVA detected a significant difference between mean values, all pair-wise multiple comparison procedures were performed (Holm–Sidak test). Differences between means were considered significant at P < 0.05.
Results
Compliance of submesothelial lymphatics (Clymph)
The pre-injection diameter (d0) and length (l0) between the two occluding threads of the occluded submesothelial lymphatic segments (Fig. 1A) was 255 ± 13.5 μm and 2516.9 ± 345.7 μm, respectively. Evidence from previous studies revealed that the cross-sectional area of diaphragmatic superficial lymphatics tends to be elliptical rather than cylindrical, the smaller radius in the plane perpendicular to the pleural surface (rmin-0) being ∼35% of the larger radius in the plane parallel to the pleural surface (rmax-0) (Moriondo et al. 2008). Thus, for rmin-0 = 0.35 rmax-0, the pre-injection segment volume (V0), calculated as: V0 = π·rmax-0·rmin-0·l0 , averaged 44.2 ± 11.1 nl. Hence, each injected bolus amounted to ∼10% of V0.
Figure 3A presents the pre-injection Plymph values (at t = 0) and the time course of Plymph during the first nine sequential 4.6 nl (∼10% of V0) saline injections. Each trace refers to a single experiment. Pre-injection Plymph was very variable among lymphatics, ranging from −6.5 to 5.5 mmHg (average value, 1.5 ± 1.6 mmHg). As observed in previous studies performed with the same experimental model (Negrini & Del Fabbro, 1999; Negrini et al. 2004), the Plymph trace was characterized by regular pressure swings (∼1 mmHg of amplitude) reflecting cardiogenic displacements of the diaphragmatic tissue. As detailed in Fig. 3B, each injection was followed by a sharp pressure increase (ΔPlymph-peak) until attainment of a transient peak (Plymph-peak) value, followed by a much slower decay towards a post-injection plateau. In one lymphatic, upon reaching a value of about 6–7 mmHg during sequential injection, Plymph suddenly dropped to the pre-injection value (Fig. 3C), suggesting the opening of an intraluminal valve undetectable under microscopic observation. In this case, we limited the analysis to the phase prior to the sudden pressure drop. Pooling all data, Plymph decay rate following Plymph-peak attainment in response to a single injection was fitted by an exponential function (mean time constant τ = 3.2 ± 0.4 s; range 2.6–4.3 s, n = 54), which was independent of initial vessel volume, pre-injection Plymph or Plymph-peak.
Figure 3. Intraluminar lymphatic pressure (Plymph) recording during discrete volume changes.
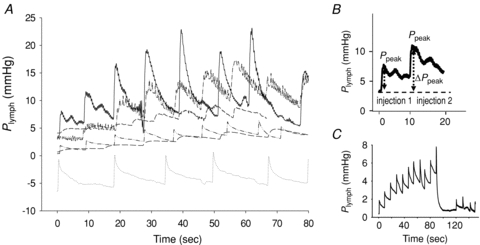
A, time course of Plymph from the pre-injection value at t = 0 and during sequential injections of 4.6 nl of lissamine green saline solution. Each trace refers to a different experiment. B, detail of one of the traces shown in A, highlighting the stepwise Plymph increase (ΔPpeak) induced by the bolus injection, followed by a slower Plymph decay. C, time course of Plymph during sequential injection in one of the vessels. The sudden drop of Plymph to the baseline pre-injection value might suggest the sudden opening of an intraluminar valve.
The compliance of the submesothelial lymphatics (Clymph) was calculated, as in the example of Fig. 4A, as the slope of the relationship obtained by plotting the cumulative injected volume (Vinjected) as a function of the corresponding Plymph-peak. Within each experimental set, only data relative to the first few injections were fitted through a statistically significant linear relationship (Fig. 4A, filled symbols); at larger cumulative injected volumes, Plymph-peak tended to remain unchanged (Fig. 4A, open symbols), or even decreased, suggesting the occurrence of fluid leaks opening in the wall of the over-distended vessel. Therefore, our analysis was limited to the linear phase of the Vinjectedvs. Plymph-peak plots attained at volume increases not larger that ∼50 nl, i.e. at segment volume not greater than 200%V0. Pooled data are presented in Fig. 4B, where Vinjected is plotted as a function of ΔPlymph-peak to account for the physiological variability of individual pre-injection Plymph. Data were distributed in two distinct populations, characterized by a significantly different Clymph (t = 4.0, d.f. = 42, P < 0.001, Fig. 4C) amounting to 6.7 ± 1.6 nl mmHg−1 (high-Clymph population, H-Clymph; Student's t test of the slope, tb = 3.9, n = 18, P < 0.01) and 1.5 ± 0.4 nl mmHg−1 (low-Clymph population, L-Clymph; tb = 4.2, n = 28, P < 0.001), respectively. The two vessel segment populations displayed radii that were not significantly different (rmax-0 H-Clymph: 121 ± 13 μm; rmax-0 L-Clymph: 130 ± 32 μm; P = 0.81), lengths (l0 H-Clymph: 2542 ± 446 μm; l0 L-Clymph: 2219 ± 693 μm; P = 0.72) and volumes (V0 H-Clymph: 44.6 ± 15.6 nl; V0 L-Clymph: 43.7 ± 19.1 nl; P = 0.81).
Figure 4. Pressure–volume behaviour of submesothelial lymphatics.
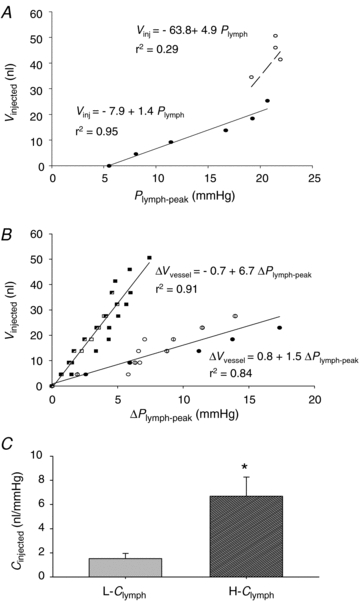
A, example of the relationship between cumulative injected volume (Vinjected) and Plymph-peak attained after each injection in a single experiment. The continuous line identifies the highly significant linear regression through the initial data points (filled symbols). At further injections and larger cumulative injected volumes (open symbols), Plymph-peak was almost unchanged suggesting fluid leakage through vessel discontinuities. B, plots obtained by pooling data from all lymphatic segments (represented by different symbols), where Vinjected is plotted as a function of ΔPlymph-peak to account for the physiological variability of individual pre-injection Plymph. The data points appear distributed in two distinct populations characterized by a significantly (P < 0.005) different Clymph amounting to 6.7 nl mmHg−1 (high compliance, H-Clymph) and 1.5 nl mmHg−1 (low compliance, L-Clymph), respectively. C, comparison between absolute L-Clymph and H-Clymph values, expressed in nl mmHg−1. Bars represent means ± s.e.m. *Significantly different (P < 0.001) from L-Clymph.
When normalizing Vinjected of Fig. 4B by the individual V0 and then plotting the normalized values as a function of Plymph-peak, data still described two distinct populations with Clymph amounting to 0.15 ± 0.04 1 mmHg−1 (H-Clymph; Student's t test of the slope, tb = 3.8, n = 18, P < 0.01) and 0.027 ± 0.009 mmHg−1 (L-Clymph; tb = 3.1, n = 28, P < 0.01), respectively.
The H-Clymph and L-Clymph populations were not distinguishable on the basis of their orientation over the diaphragm; indeed all the investigated vessels were perpendicular to the underlying diaphragmatic muscular fibres.
Diaphragmatic tissue elastic modulus (Et)
A representative stress–relaxation curve following stretch of diaphragmatic tissue strips is shown in Fig. 5A. The stress increased when the strain ramp was applied until attainment of the strain peak; thereafter, the tissue relaxed while the stress decreased to an equilibrium value during the constant strain phase. The average elastic modulus, Et, calculated (eqn (3)) from the curve equilibrium values of the tested diaphragmatic strips (n = 28) significantly increased at 15% and 20% strip elongation (Fig. 5B) compared with the 5% applied strain. In contrast, the average time constant τ1 was not affected by strain (Fig. 5C). Et was similar (Fig. 6A) when stress was applied in the longitudinal (L) rather than in the transverse (T) direction to the axis parallel to the diaphragmatic fibres and in strips excised from the ventral (V) rather than the dorsal (D) diaphragmatic region. Similar indications were provided by the elastic modulus at failure, Et,f (Fig. 6C). The stress–relaxation time constant after 10% strain was significantly higher (P < 0.005) after elongation in the transverse than in the longitudinal fibres direction and in ventral than dorsal diaphragmatic tissue strips (P < 0.01).
Figure 5. Diaphragmatic tissue mechanical parameters.
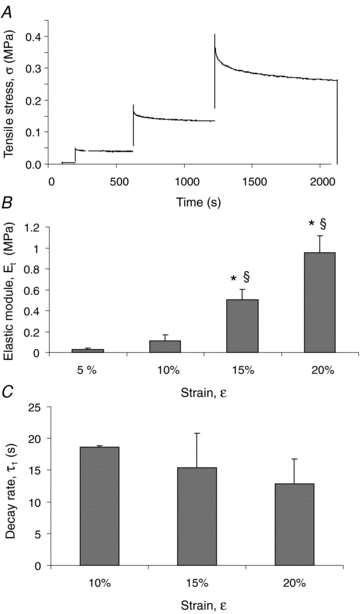
A, typical stress–relaxation curve following stretch of a diaphragmatic strip. The stress (σ) increased when the strain ramp was applied until attainment of the strain peak; thereafter, the tissue relaxed while the stress decreased to an equilibrium value during the constant strain phase. Stress–relaxation data allow calculation of elastic moduli Et and the relaxation time constants (τ) for all of the tested strain levels. B, average values of the elastic modulus (Et) for increasing strain (ɛ) level, expressed as percentage of initial strip length, of all the tested specimens (n = 28). C, average values of the first relaxation (τ1) constant (n = 28). Bars represent means ± s.e.m. *Significantly different (P < 0.01) from values at 5% strain; §significantly different (P < 0.01) from values at 10% strain.
Figure 6. Regional mechanical characterization of diaphragmatic tissue strips.
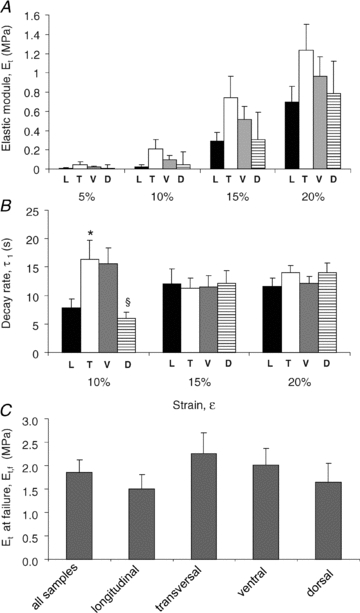
Elastic modulus, Et (A), and relaxation time constant, τ1 (B), for increasing strain (ɛ) levels grouped by direction of fibre orientation and by anatomical location. Black bars: strain applied longitudinally to the fibres axis (L); white bars: strain applied transversally to the fibres axis (T); grey bars: strips excised from the ventral zone (V); striped bars: strips excised from the dorsal zone (D). C, average elastic modulus before failure, Et,f, of all samples grouped by fibre direction or location. Et,f was measured as the slope of the linear portion of the curve before failure, as graphically shown in Fig. 2C. *Significantly different (P < 0.01) from longitudinally elongated fibres; §significantly different (P < 0.01) from ventral fibres.
Computational modelling of the submesothelial lymphatics
Table 1 presents the input parameters used to model three ideal initial lymphatics: (a) a submesothelial superficial lymphatic laying on the muscular/tendineous plane, but delimited almost entirely by the mesothelium; (b) an ‘intermediate’ lymphatic surrounded partly by mesothelium and, over most of the surface, by the muscular/tendineous tissue and, for comparison; (c) an initial lymphatic completely surrounded by muscular/tendineous tissue. The dimension of the superficial and intermediate lymphatic corresponded to the average rmin-0, rmax-0 and l0 values measured in H-Clymph and L-Clymphl vessels in the experiments performed to measure Clymph, while the thickness of the lymphatic covered by mesothelium (hl) and by tissue (ht) was assumed to be 6 μm (Grimaldi et al. 2006) and 40 μm, respectively. A pressure of 10 mmHg, representing the average intraluminar Plymph-peak during the in vivo experiments (Fig. 3A), was applied at the internal model wall and the resulting vessel cross-sectional area was used to calculate the volume increase. The deep lymphatic was modelled as a linear isotropic material with elastic modulus (Elymph) equal to the average Et,f measured in diaphragmatic tissue strips (Fig. 6C, all samples, Et,f = 1.7 ± 0.3 MPa). This assumption is reasonable because the surrounding tissue and the deep lymphatic wall are two in series elements which sum their moduli, and the tissue elastic modulus Et is much higher than that of the mesothelial/endothelial vessel, as indicated by the much lower Elymph value needed to simulate the behaviour of superficial and intermediate lymphatics. Clymph-M for a deep vessel with ellipsoidal cross-sectional shape was 0.07 nl mmHg−1, i.e. ∼100- and ∼20-fold smaller than measured H-Clymph and L-Clymph, respectively (Table 1). When the deep vessel was modelled with a circular cross-sectional shape with equivalent radius obtained by averaging rmin-0 and rmax-0, the same Clymph-M was obtained.
Table 1.
Input parameters used to model three ideal initial lymphatics: a superficial, an intermediate and a deep lymphatic
| Vessel type | Modelling input parameters | Model output | Experimental | |||||
|---|---|---|---|---|---|---|---|---|
| rmax-0 (μm) | rmin-0 (μm) | l0 (μm) | Tl (μm) | Tt (μm) | Elymph (MPa) | Clymph-M (nl mmHg−1) | Clymph (nl mmHg−1) | |
| Elliptical cross-sectional shape | ||||||||
| Superficial | 120 | 40 | 2500 | 6 | 40 | 0.011 | 6.25 | 6.6 |
| Intermediate | 130 | 45 | 2200 | 6 | 40 | 0.08 | 1.54 | 1.5 |
| Deep | 120 | 40 | 2500 | — | 40 | 1.72 | 0.07 | — |
| Equivalent radius (μm) | l0 (μm) | Tt (μm) | Elymph (MPa) | Clymph-M (nl mmHg−1) | ||||
| Circular cross-sectional shape | ||||||||
| Deep | 70 | 2500 | 40 | 1.72 | 0.07 | |||
rmax−0 and rmin−0, radii of the ellipsoid; l0, length of the ellipsoid; Tt and Tl tissue and lymphatic thicknesses. The dimensions of superficial and intermediate ellipsoids were set similar to that measured in H-Clymph and L-Clymph vessels, respectively.
To model the superficial and intermediate vessels by FEM, Elymph was changed (Table 1) until the calculated volume increase was equal to the experimental measured one. As shown in Table 1, Clymph-M values comparable to those measured in H-Clymph and L-Clymph vessels (Fig. 4B and C) can be calculated from eqn (5) and setting Elymph values much lower than those measured in diaphragmatic tissue strips. In addition, the difference between H-Clymph and L-Clymph can be accounted for by a ∼7-fold Elymph difference between superficial and intermediate lymphatics. The distribution of circumferential stresses in the wall of the ideal vessels exposed to an intraluminar Plymph-peak comparable to that used in H-Clymph and L-Clymph vessels by using the parameters of Table 1 is presented in Fig. 7 for superficial (A) and intermediate (B) submesothelial lymphatics and for a deep initial lymphatic with ellipsoid (C) and circular (D) cross-sectional area. The modelling suggested that that: (a) tensile stress (represented by the colour key and legend in Fig. 7) was higher in the more compliant wall of the submesothelial superficial (Fig. 7A) and intermediate (Fig. 7B) lymphatics compared to deeper initial lymphatics (Fig. 7C and D); (b) the highest tensile stress was encountered in intermediate lymphatics (Fig. 7B) at the edges between the complaint wall and the stiff diaphragmatic tissue basement which underwent the greatest deformation; and (c) in deep, stiffer lymphatics (Fig. 7C), in particular with a circular shape (Fig. 7D), wall tension was more homogenously distributed over the entire surface.
Figure 7. Three-dimensional modelling of the lymphatic vessel wall.
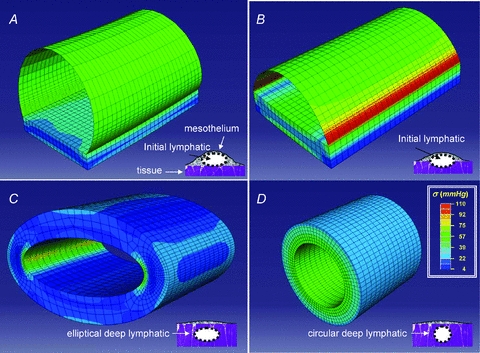
Stress distribution maps obtained through finite element modelling of ideal diaphragmatic initial lymphatics located (as depicted in the schematic drawing at the bottom right of each panel): A, immediately beneath the mesothelium. The ellipsoidal superficial vessel is delimited mostly by a thin wall of lymphatic endothelium plus pleural mesothelium and lays on a diaphragmatic muscular/tendineous support; B, deeper in the submesothelial tissue. This intermediate vessel is only partially delimited by a thin wall, most of the lateral surface being surrounded by the muscular/tendineous tissue; C, among the diaphragmatic muscular/tendineous fibres surrounded by an isotopic tissue and with a ellipsoidal cross-sectional area; D, among the diaphragmatic muscular/tendineous fibres surrounded by an isotopic tissue and with a circular cross-sectional area. Modelling was performed using the geometrical parameters presented in Table 1 and by loading the vessels with an intraluminar distending pressure of 10 mmHg. The circumferential stress distribution was identified by colours (see key) on a scale from blue (low stress) to red (high stress); the thin lines delimit the shell and solid elements used to model the thin mesothelial/endothelial wall and the solid muscular/tendineous tissue, respectively. Superficial vessel tensile stress was higher in submesothelial superficial (A) and intermediate (B) vessels which underwent the greatest deformation. In deeper vessels (C and D) surrounded by stiffer tissue, wall tension was lower and more homogenously distributed over the entire surface, particularly in perfectly circular model (D). According to these models, the mechanical properties and the function of initial lymphatics may depend upon surrounding tissue stiffness: submesothelial lacunae delimited by a complaint wall serve as reservoirs of drained fluid, while deeper vessels running the stiff tissue more efficiently propel fluid along the network.
Discussion
Most of the data available on the passive and active properties of the lymphatic vessels have been collected in isolated collecting ducts or in mesenteric lymphatics (Mawhinney & Roddie, 1973; Zweifach & Prather, 1975; McHale & Roddie, 1976; Hargens & Zweifach, 1977; Ohhashi et al. 1980; Benoit et al. 1989; Zawieja et al. 1993). These methods offer the advantage of a relatively straightforward isolation from surrounding soft tissue, but they provide only information on behaviour of the vessel wall. Vessels belonging to the initial lymphatic microvasculature supplying skeletal muscle or parenchymal organs such as the lung or the heart, cannot usually be excised from the tissue because they are not visible in vivo in the tissue and their walls are integrated with the surrounding extracellular matrix so that they cannot be excised without damage to their wall or to the tissue, impairing any functional study. The lymphatic vasculature of the present study is the large submesothelial lacunae, visible through the transparent diaphragmatic mesothelium. Running beneath the mesothelium and above the muscular plane, they represent a reservoir for the fluid drained from the pleural and peritoneal cavities and the initial part of the lymphatic system supplying the two serous cavities. Submesothelial lymphatics display features common to the initial lymphatics of other tissues, though there are some notable differences. Unlike most other initial lymphatics they form well-defined large vessels, visible through the transparent mesothelium (Fig. 1), with dimensions similar to those of collecting lymphatics. Although a smooth muscle coat is morphologically not commonly described (Grimaldi et al. 2006), one cannot exclude the presence of smooth muscle cells in the wall of the lacunae, as witnessed by the observation of Plymph spontaneous pulsatility in these superficial vessels (Negrini & Fabbro, 1999). On the other hand, in spite of their large diameter and the scanty, if not entirely absent, smooth muscle component, these vessels are not likely to be collecting lymphatics, which are instead present in the central part of the diaphragm (Grimaldi et al. 2006). Based on these considerations and on their specific anatomical position and features, it is likely that the submesothelial lymphatics are initial lymphatics and can serve as a useful experimental model to study the behaviour of initial lymphatics in skeletal muscle and other tissue.
Mechanical properties of diaphragmatic initial lymphatics
The present results identify two populations of initial lymphatics (H-Clymph and L-Clymph) with different mechanical properties. The geometry of the two populations of vessels does not explain these differences; although submesothelial lymphatics may be organized in either long linear vessels or be arranged in complex loops formed at the confluence of shorter vessels (Moriondo et al. 2008), Clymph was measured only in straight vessels of rather homogeneous size oriented perpendicularly to the diaphragmatic muscle fibres (Fig. 1). Therefore, besides the biological variability of the mesothelial/endothelial wall and of the muscular/tendineous tissue pavement, the difference between H-Clymph and L-Clymph might reflect: (a) the compliance of the thin serosal wall formed by the lymphatic endothelium, the pleural mesothelium and the submesothelial interstitium; (b) the stiffness of the muscular or tendineous tissue on which the lymphatic lay; and (c) the percentage of compliant or stiff tissue, respectively, delimiting the lymphatic lumen. The simulation performed through FEM (Table 1) indicates indeed that the lower compliance in L-Clymph compared to H-Clymph lymphatics may be graphically represented and mathematically calculated by deepening the vessel into the stiffer muscular/tendineous pavement (Fig. 7B), restricting the vessel surface area represented by a compliant serosal wall, as depicted in the sketches of Fig. 7A and B. Deepening further into the tissue, Clymph of an ideal initial vessel completely surrounded by muscular/tendineous fibres (Fig. 7C and D) would be ∼2 order of magnitudes lower than Clymph of a superficial lymphatics. In the diaphragm, vessels of this type might be the transverse vessels running perpendicularly to the lacunae through the muscular fibres and the central collectors arranged in the deep interstitium (Grimaldi et al. 2006). Therefore, the proportion of stiff tissue surrounding the vessel may play a significant role in the determination of the mechanical properties of the lymphatic. An independent indication of the potential role of a stiff tissue cuff in defining the vessel mechanical response is the similarity between the time constants of the Plymph decay rate after attainment of post-injection Plymph-peak (Fig. 3) and of the tissue stress–relaxation tests (Fig. 5C).
The combined Clymph and circumferential stress distribution may provide useful information on the role of submesothelial and deeper lymphatics. Since Clymph∝ 1/Elymph and, similarly to what we have for the tissue in eqn (3), Elymph∝Δσ/Δɛ, then Clymph∝Δɛ/Δσ. Thus, although surface stress (Δσ) is comparable in superficial (Fig. 7A) and intermediate (Fig. 7B) lymphatics, enlargement (Δɛ) of discontinuities, such as stomata and or primary unidirectional valves (Trzewik et al. 2001; Grimaldi et al. 2006), would be greater in the most complaint superficial lymphatic. The deep vessels, particularly those with a circular cross-sectional shape, like the large vessels described in the deep interstitial space of the diaphragm (Grimaldi et al. 2006), present a homogeneous wall stress distribution which, combined with the low compliance and with unidirectional valves, provides an efficient structure to promote lymph propulsion. Indeed, in such vessels the external forces arising in the diaphragmatic fibres in relation to the cardiac or respiratory activity would be mostly transmitted to the vessel lumen with only minor distortion of the wall. In addition, one cannot exclude that a physiologically low Clymph, by limiting lymphatic fluid overload, might contribute to definition of maximum lymph flow rate.
Clymph values intermediate between those measured in the two population of diaphragmatic vessels were reported in relaxed isolated mesenteric lymphatics (Zhang et al. 2007). This suggests that in lymphatic networks not surrounded by a muscular/tendineous tissue environment, the well-developed layer of smooth muscle cells in the vessel wall may not only sustain active lymphatic pumping, but also provide a relatively stiff mechanical support. The tension in the wall of the mesenteric lymphatics during smooth muscle cells contraction increases by about 3 times (Zhang et al. 2007) with no apparent change in compliance. Vice versa, since diaphragmatic tissue elastance greatly increases (up to ∼80 MPa) during inspiratory contraction (Boriek et al. 2005), deep diaphragmatic lymphatics might actually become even stiffer than in relaxed diaphragm.
Diaphragmatic mechanical properties and lymphatic function
The present average diaphragmatic tissue elastic modulus (Fig. 6C) compares well with other estimates obtained on relaxed pre-conditioned rat tissue strips (Navajas et al. 1992; Boriek et al. 2001). It is worth noting that physiological end-expiratory and, even more, end-inspiratory tissue stiffness is very probably higher than that measured in this study performed on excised tissue strips. As suggested by data of Fig. 6A and B, Et was mildly higher in ventral compared to dorsal regions of the diaphragm, as expected from the anatomically higher percentage of stiffer tendineous fibres in the ventral than in the dorsal diaphragm (Boriek et al. 2005). These regional differences might be important in terms of lymphatic function. Lymph formation in the pleural diaphragmatic lymphatic network depends upon the difference between pleural fluid pressure (Pliq) and Plymph. While regional end-expiratory and end-inspiratory distribution of Pliq is well documented, no systematic recording of regional diaphragmatic Plymph has been performed yet. At end-expiration, the peripheral diaphragmatic muscular fibres are relaxed and passively stretched by the pulling action of the stiffer central tendon fibres. This condition, coupled with the sub-atmospheric diaphragmatic Pliq, might distend the superficial lymphatics oriented transversally to the muscular fibres (Fig. 1A and B) and reduce Plymph, favouring end-expiratory lymphatic filling. It is worth noting that, given a relaxation time constant greater than 5 s (Fig. 6B), the distending effect is assured during the entire end-expiratory pause lasting in rat about ∼600–700 ms. On inspiration, the muscular fibres contract and shorten and the central tendineous fibres are stretched while diaphragmatic Pliq decreases (Miserocchi et al. 1984), a condition that, by limiting lymph formation, might instead favour deep lymphatics squeezing and lymph progression in the network.
In conclusion, the present study suggests that the mechanical properties of the initial lymphatics may be significantly affected by the stiffness of the surrounding tissue: vessels delimited by a compliant tissue serve as distensible reservoirs of drained interstitial fluid, while those surrounded by stiffer tissue more efficiently propel fluid along the network. Stiffness may be provided by either skeletal and/or smooth muscle cells and may therefore change according to muscle relaxation or contraction. Hence, cyclic contraction and relaxation of either skeletal and/or smooth muscle might support lymph function by: (a) favouring the development of transmural pressure gradients which sustain lymph formation and propulsion along the network, and (b) by modifying the mechanical features of the lymphatic wall, increasing the efficiency of the lymph formation /lymph propulsion phases.
Acknowledgments
This research was funded by the Italian Ministry of the University and of Scientific and Technological Research (MIUR, contract FAR 2008; 2009). We are deeply grateful to Professor Mathew Glucksberg, Biomedical Engineering Department, Northwestern University, Evanston, for his constructive comments and careful revision of the manuscript.
Glossary
Abbreviations
- Clymph
compliance of the lymph wall
- Elymph
elastic modulus of the lymphatic wall
- Plymph
lymph hydraulic pressure
- ΔPtm
transmural pressure gradient
Author contributions
The ‘in vivo’ experiments on anaesthetized rats and the diaphragm excisions were performed in the Laboratory of Physiology of the Department of Experimental and Clinical Biomedical Sciences at the University of Insubria, Varese. The ‘ex vivo’ experiments on excised rat diaphragm were performed in the Laboratory of the Department of Structural Engineering, Politecnico di Milano, 20133 Milano, Italy. Conception and design of the experiments: D.N., A.M., F.Boschetti. Collection of the data: A.M., F.Boschetti, F.Bianchin, C.M., S.L. Analysis and interpretation of the data: A.M., D.N., F.Boschetti, S.L. Drafting the article or revising it critically for important intellectual content: D.N., A.M., F.Boschetti. All authors approved the final version of the manuscript.
References
- Aukland K, Reed R. Interstitial-lymphatic mechanisms in the control of extracellular fluid volume. Physiol Rev. 1993;73:1–78. doi: 10.1152/physrev.1993.73.1.1. [DOI] [PubMed] [Google Scholar]
- Benoit JN, Zawieja DC, Goodman AH, Granger HJ. Characterization of intact mesenteric lymphatic pump and its responsiveness to acute edemagenic stress. Am J Physiol Heart Circ Physiol. 1989;257:H2059–H2069. doi: 10.1152/ajpheart.1989.257.6.H2059. [DOI] [PubMed] [Google Scholar]
- Boriek AM, Hwang W, Trinh L, Rodarte JR. Shape and tension distribution of the active canine diaphragm. Am J Physiol Regul Integr Comp Physiol. 2005;288:R1021–R1027. doi: 10.1152/ajpregu.00499.2003. [DOI] [PubMed] [Google Scholar]
- Boriek AM, Rodarte JR, Reid MB. Shape and tension distribution of the passive rat diaphragm. Am J Physiol Regul Integr Comp Physiol. 2001;280:R33–R41. doi: 10.1152/ajpregu.2001.280.1.R33. [DOI] [PubMed] [Google Scholar]
- Grimaldi A, Moriondo A, Sciacca L, Guidali ML, Tettamanti G, Negrini D. Functional arrangement of rat diaphragmatic initial lymphatic network. Am J Physiol Heart Circ Physiol. 2006;291:H876–H885. doi: 10.1152/ajpheart.01276.2005. [DOI] [PubMed] [Google Scholar]
- Hargens AR, Zweifach BW. Contractile stimuli in collecting lymph vessels. Am J Physiol Heart Circ Physiol. 1977;233:H57–H65. doi: 10.1152/ajpheart.1977.233.1.H57. [DOI] [PubMed] [Google Scholar]
- McHale N, Roddie I. The effect of transmural pressure on pumping activity in isolated bovine mesentheric lymphatic vessels. J Physiol. 1976;261:255–269. doi: 10.1113/jphysiol.1976.sp011557. [DOI] [PMC free article] [PubMed] [Google Scholar]
- Mawhinney HJ, Roddie IC. Spontaneous activity in isolated bovine mesenteric lymphatics. J Physiol. 1973;229:339–348. doi: 10.1113/jphysiol.1973.sp010141. [DOI] [PMC free article] [PubMed] [Google Scholar]
- Miserocchi G, Pistolesi M, Miniati M, Bellina CR, Negrini D, Giuntini C. Pleural liquid pressure and intrapleural distribution of an injected bolus. J Appl Physiol. 1984;56:526–532. doi: 10.1152/jappl.1984.56.2.526. [DOI] [PubMed] [Google Scholar]
- Moriondo A, Bianchin F, Marcozzi C, Negrini D. Kinetics of fluid flux in the rat diaphragmatic submesothelial lymphatic lacunae. Am J Physiol Heart Circ Physiol. 2008;295:H1182–H1190. doi: 10.1152/ajpheart.00369.2008. [DOI] [PubMed] [Google Scholar]
- Navajas D, Mijailovich S, Glass GM, Stamenovic D, Fredberg JJ. Dynamic response of the isolated passive rat diaphragm strip. J Appl Physiol. 1992;73:2681–2692. doi: 10.1152/jappl.1992.73.6.2681. [DOI] [PubMed] [Google Scholar]
- Negrini D, Del Fabbro M. Subatmospheric pressure in the rabbit pleural lymphatic network. J Physiol. 1999;520:761–769. doi: 10.1111/j.1469-7793.1999.00761.x. [DOI] [PMC free article] [PubMed] [Google Scholar]
- Negrini D, Del Fabbro M, Gonano C, Mukenge S, Miserocchi G. Distribution of diaphragmatic lymphatic lacunae. J Appl Physiol. 1992;72:1166–1172. doi: 10.1152/jappl.1992.72.3.1166. [DOI] [PubMed] [Google Scholar]
- Negrini D, Fabbro MD. Subatmospheric pressure in the rabbit pleural lymphatic network. J Physiol. 1999;520:761–769. doi: 10.1111/j.1469-7793.1999.00761.x. [DOI] [PMC free article] [PubMed] [Google Scholar]
- Negrini D, Moriondo A, Mukenge S. Transmural pressure during cardiogenic oscillations in rodent diaphragmatic lymphatic vessels. Lymphat Res Biol. 2004;2:69–81. doi: 10.1089/lrb.2004.2.69. [DOI] [PubMed] [Google Scholar]
- Negrini D, Mukenge S, Del Fabbro M, Gonano C, Miserocchi G. Distribution of diaphragmatic lymphatic stomata. J Appl Physiol. 1991;70:1544–1549. doi: 10.1152/jappl.1991.70.4.1544. [DOI] [PubMed] [Google Scholar]
- Ohhashi T, Azuma T, Sakaguchi M. Active and passive mechanical characteristics of bovine mesenteric lymphatics. Am J Physiol Heart Circ Physiol. 1980;239:H88–H95. doi: 10.1152/ajpheart.1980.239.1.H88. [DOI] [PubMed] [Google Scholar]
- Schmid-Schöenbein G. Microlymphatics and lymph flow. Physiol Rev. 1990;70:987–1019. doi: 10.1152/physrev.1990.70.4.987. [DOI] [PubMed] [Google Scholar]
- Trzewik J, Mallipatty S, Artmann G, Delano F, Schmid-Schöenbein G. Evidence for a second valve system in lymphatic endothelial microvalves. FASEB J. 2001;15:1711–1717. doi: 10.1096/fj.01-0067com. [DOI] [PubMed] [Google Scholar]
- Wang NS. The preformed stomata connecting the pleural cavity and the lymphatics in the parietal pleura. Am Rev Resp Dis. 1975;111:12–20. doi: 10.1164/arrd.1975.111.1.12. [DOI] [PubMed] [Google Scholar]
- Zawieja DC, Davis KI, Schuster R, Hinds WM, Granger HJ. Distribution, propagation and coordination of contractile activity in lymphatics. Am J Physiol Heart Circ Physiol. 1993;264:H1283–H1291. doi: 10.1152/ajpheart.1993.264.4.H1283. [DOI] [PubMed] [Google Scholar]
- Zhang RZ, Gashev AA, Zawieja DC, Davis MJ. Length-tension relationships of small arteries, veins, and lymphatics from the rat mesenteric microcirculation. Am J Physiol Heart Circ Physiol. 2007;292:H1943–H1952. doi: 10.1152/ajpheart.01000.2005. [DOI] [PubMed] [Google Scholar]
- Zweifach BW, Prather JW. Micromanipulation of pressure in terminal lymphatics in the mesentery. Am J Physiol. 1975;228:1326–1335. doi: 10.1152/ajplegacy.1975.228.5.1326. [DOI] [PubMed] [Google Scholar]