

Abstract
This study examined whether elevated intravascular pressure stimulates asynchronous Ca2+ waves in cerebral arterial smooth muscle cells and if their generation contributes to myogenic tone development. The endothelium was removed from rat cerebral arteries, which were then mounted in an arteriograph, pressurized (20–100 mmHg) and examined under a variety of experimental conditions. Diameter and membrane potential (VM) were monitored using conventional techniques; Ca2+ wave generation and myosin light chain (MLC20)/MYPT1 (myosin phosphatase targeting subunit) phosphorylation were assessed by confocal microscopy and Western blot analysis, respectively. Elevating intravascular pressure increased the proportion of smooth muscle cells firing asynchronous Ca2+ waves as well as event frequency. Ca2+ wave augmentation occurred primarily at lower intravascular pressures (<60 mmHg) and ryanodine, a plant alkaloid that depletes the sarcoplasmic reticulum (SR) of Ca2+, eliminated these events. Ca2+ wave generation was voltage insensitive as Ca2+ channel blockade and perturbations in extracellular [K+] had little effect on measured parameters. Ryanodine-induced inhibition of Ca2+ waves attenuated myogenic tone and MLC20 phosphorylation without altering arterial VM. Thapsigargin, an SR Ca2+-ATPase inhibitor also attenuated Ca2+ waves, pressure-induced constriction and MLC20 phosphorylation. The SR-driven component of the myogenic response was proportionally greater at lower intravascular pressures and subsequent MYPT1 phosphorylation measures revealed that SR Ca2+ waves facilitated pressure-induced MLC20 phosphorylation through mechanisms that include myosin light chain phosphatase inhibition. Cumulatively, our findings show that mechanical stimuli augment Ca2+ wave generation in arterial smooth muscle and that these transient events facilitate tone development particularly at lower intravascular pressures by providing a proportion of the Ca2+ required to directly control MLC20 phosphorylation.
Introduction
Cerebral arteries form an integrated vascular network that controls the magnitude and distribution of tissue blood flow (Segal & Duling, 1986; Segal, 2000). Under dynamic conditions, tone within this network is regulated by multiple stimuli including blood flow (Garcia-Roldan & Bevan, 1990; Koller & Kaley, 1991), neuronal activity (Brayden & Bevan, 1985; Si & Lee, 2002), tissue metabolism (Filosa et al. 2006; Harder et al. 1998) and intraluminal pressure (Bayliss, 1902; Knot & Nelson, 1998). It was a century ago when Bayliss first surmised that resistance arteries could respond to a fluctuating change in blood pressure (Bayliss, 1902). The so-called ‘myogenic response’ has been observed in a variety of vascular beds and is particularly prominent in the cerebral vasculature where constant perfusion must be maintained over a range of blood pressures (Welsh et al. 2000, 2002; Hill et al. 2001; Loutzenhiser et al. 2002; Slish et al. 2002). Like all stimuli, intravascular pressure regulates arterial tone by altering myosin light chain (MLC20) phosphorylation via the dynamic regulation of myosin light chain kinase (MLCK) and phosphatase (MLCP) (Knot & Nelson, 1995; Davis et al. 2001; Johnson et al. 2009). While the precise signalling mechanism has not been fully resolved, a rise in cytosolic [Ca2+] is generally thought to be a key mediating step (Knot & Nelson, 1995, 1998; Knot et al. 1998). Given the maintained nature of the myogenic response, it is generally presumed that the Ca2+ elevation is sustained and induced by the depolarization of arterial smooth muscle and the activation of voltage-operated Ca2+ channels (Knot & Nelson, 1995, 1998; Knot et al. 1998; Welsh et al. 2000, 2002).
The sarcoplasmic reticulum (SR) is an internal store which discretely releases Ca2+ when ryanodine- (RyR) or inositol triphosphate- (IP3R) sensitive receptors are activated (Boittin et al. 1999; Jaggar & Nelson, 2000; Perez et al. 2001; Lee et al. 2005). In vascular tissue, SR Ca2+ release takes several forms including that of a ‘Ca2+ spark’ and a ‘Ca2+ wave’. Ca2+ sparks are discrete voltage-dependent events that activate large-conductance Ca2+-activated K+ channels (BK) and elicit spontaneous transient outward currents (STOCs) (Jaggar et al. 1998a, 2000; Perez et al. 2001). In intact arteries, STOCs are electrically transformed through the passive cable properties of vascular cells into a sustained hyperpolarization that feeds back negatively upon constrictor responses (Jaggar et al. 1998b; Knot et al. 1998; Diep et al. 2005). Ca2+ waves are slower temporal events that generally propagate from end to end and which are asynchronous among neighbouring smooth muscle cells (Boittin et al. 1999; Jaggar & Nelson, 2000; Lee et al. 2005). Unlike sparks, Ca2+ waves are thought to facilitate arterial constriction through one of two potential mechanisms. The first centres on the idea that these events deliver a proportion of the Ca2+ that controls the signalling pathways associated with MLCK or MLCP (Kuo et al. 2003; Lee et al. 2005). The second highlights an indirect effect whereby Ca2+ waves activate an inward current to depolarize smooth muscle and subsequently elevate Ca2+ influx through voltage-operated Ca2+ channels (Gonzales et al. 2010). While agonists are known to generate Ca2+ waves, it is less certain whether mechanical stimuli, (i.e. intravascular pressure) initiate a similar response. Indeed, existing studies have presented conflicting findings ranging from no Ca2+ wave generation, to robust production, to a subtler Ca2+ ripple phenomenon (Miriel et al. 1999; Jaggar, 2001; Zacharia et al. 2007).
The purpose of this study was to examine whether elevated intravascular pressure stimulates Ca2+ waves and how their generation might contribute to myogenic tone development in the cerebral circulation. To accomplish this objective, rat cerebral arteries were mounted and pressurized while arterial diameter, Ca2+ waves and membrane potential (VM) were monitored, and myosin light chain (MLC20)/MYPT1 phosphorylation determined. Our findings reveal that elevated intravascular pressure stimulates SR release and induces the generation of Ca2+ waves in a voltage-insensitive manner. This rise in Ca2+ wave generation was particularly evident at intravascular pressures less than 60 mmHg. A range of functional experiments revealed that these asynchronous events facilitate myogenic tone development by enhancing MLC20 phosphorylation. Further measurements of MYPT1 phosphorylation illustrated that SR Ca2+ waves augment MLC20 phosphorylation through mechanisms that include MLCP inhibition. Overall, this investigation provides definitive evidence that the asynchronous and transient nature of pressure-induced Ca2+ waves does not preclude these SR-driven events from directly participating in MLC20 phosphorylation and the long-term maintenance of arterial tone.
Methods
Animal procedures
Animal procedures were approved by the Animal Care and Use Committee at the University of Calgary. Briefly, female Sprague–Dawley rats (10–12 weeks of age) were killed via carbon dioxide asphyxiation. The brain was carefully removed and placed in cold phosphate-buffered (pH 7.4) saline solution containing (in mm): 138 NaCl, 3 KCl, 10 Na2HPO4, 2 NaH2PO4, 5 glucose, 0.1 CaCl2 and 0.1 MgSO4. Middle and posterior cerebral arteries were carefully dissected out of surrounding tissue and cut into 2–3 mm segments.
Vessel myography
Arterial segments were mounted in a customized arteriograph and superfused with warm (37°C) physiological salt solution (PSS; pH 7.4; 21% O2, 5% CO2, balance N2) containing (in mm): 119 NaCl, 4.7 KCl, 20 NaHCO3, 1.1 KH2PO4, 1.2 MgSO4, 1.6 CaCl2 and 10 glucose (Welsh et al. 2000). To limit the endothelium's tonic dilatory influence on myogenic tone development (Kuo et al. 1991; Knot et al. 1999), these cells were removed by passing air bubbles through the vessel lumen (1–2 min); successful removal was confirmed by the loss of bradykinin-induced dilatation. Arteries were equilibrated for 30 min at 15 mmHg and contractile responsiveness assessed by briefly exposing (∼10 s) tissue to 60 mm KCl. Following equilibration, intravascular pressure was increased incrementally from 15 to 100 mmHg and pressure-induced diameter monitored with an automated edge detection system (IonOptix, MA, USA). After collecting these control measures, arteries were returned to 15 mmHg and equilibrated for 5 min with PSS containing: (1) diltiazem (30 μm) ± ryanodine (10 or 50 m) or thapsigargin (200 nm); (2) diltiazem + zero externally added Ca2+; (3) nifedipine (0.1–1 μm) ± ryanodine; or (4) zero externally added Ca2++ 2 mm EGTA (referred to as Ca2+-free PSS). Vasomotor responsiveness to elevated intravascular pressure was then reassessed.
Supplementary experiments were also performed in which cerebral arteries were first pressurized to 80 mmHg and then exposed to 10 μm ryanodine. Following a 5 min period in which vessels actively constricted, arteries were briefly hyperpolarized (5 min) by reducing intravascular pressure (15 mmHg) and superfusing tissues with a ryanodine–PSS in which extracellular [K+] was elevated to 15 mm to augment the activity of inward rectifying K+ channels (Smith et al. 2008). Arteries were then re-pressurized and returned to a standard ryanodine–PSS. In a subgroup of these experiments, investigators modified the elevated K+–ryanodine–PSS by replacing NaCl with LiCl (120 or 60 mm) or NMDG-Cl (60 mm) to diminish Na+/Ca2+ exchanger activity (Raina et al. 2008; Zhao & Majewski, 2008).
Arterial VM was assessed in a small complement of experiments by inserting a glass microelectrode backfilled with 1 m KCl (tip resistance = 120–150 MΩ) into the vessel wall (Knot & Nelson, 1995; Welsh et al. 2000). A control measure was first attained at 80 mmHg; the artery was then returned to 15 mmHg and ryanodine (50 m) added to the PSS. Following 5 min of equilibration, the vessel was returned to 80 mmHg and a second VM measurement was independently attained. The criteria for successful cell impalement included: (1) a sharp negative VM deflection upon entry; (2) a stable recording for at least 1 min following entry; and (3) a sharp return to baseline upon electrode removal.
Ca2+ wave measurements
The endothelium was removed from whole arteries, which were then equilibrated for 20 min in a Hepes buffer (pH 7.4; room temperature) containing (in mm): 134 NaCl, 6 KCl, 1 MgCl2, 2 CaCl2, 10 Hepes and 10 glucose (Jaggar & Nelson, 2000). Following equilibration, arteries were exposed (2 h) to a Hepes buffer containing 10 μm fluo-4 AM and 10 μm pluronic acid. Loaded arteries were washed (30 min) in PSS and then mounted for vessel myography as described above. To visualize Ca2+ waves, fluo-4-loaded arteries were excited at 488 nm using a krypton–argon laser (power, 5–8 mW). Emission spectra (510 nm) were viewed through a 63× water immersion objective (1.2 NA) coupled in series with a dual Nipkow Spinning Disk Confocal head (Solamere Technology Group, UT, USA) and a Mega-10 ICCD camera (Stanford Photonics, CA, USA). Image acquisition was limited to 30 s periods (10–20 frames s−1) to limit laser-induced tissue injury.
Movie file analysis
Movie files were analysed offline using software provided by Stanford Photonics (CA, USA). Briefly, starting with the first visibly loaded smooth muscle cell, a square box (∼1.5 μm × 1.5 μm) was placed on the next 10 successive cells that were in sharp focus. Changes in fluo-4 emission spectra were assessed at these fixed positions and data were normalized to baseline fluorescence (F0). To be classified as a Ca2+ wave, a particular event had to: (1) appear to spread from end to end; (2) demonstrate a peak fluorescence ∼15% above baseline; and (3) last longer than 200 ms. Ca2+ wave generation was quantified in terms of the percentage of cells firing Ca2+ waves and the frequency of these events per firing cell.
Measurement of MLC20 phosphorylation
A 2–3 mm segment of artery with the endothelium removed was cut in two, with each segment being mounted in an arteriograph. One half of each pair was then exposed to: (1) 20 or 80 mmHg intravascular pressure; (2) 80 mmHg intravascular pressure ± diltiazem (30 μm); or (3) 80 mmHg intravascular pressure + diltiazem ± ryanodine (10 or 50 μm) or thapsigargin (200 nm). Note that all agents were first applied to vessels resting at 15 mmHg (5 min) before being pressurized in a step-wise fashion to 20 or 80 mmHg. Arterial protein was subsequently extracted and MLC20 phosphorylation ascertained using a two-step Western blot approach as previously described (Takeya et al. 2008; Johnson et al. 2009). Briefly, cerebral artery extracts were electrophoresed (30 mA) on a Phos-tag SDS-PAGE gel for 1.5 h. Proteins were then transferred overnight to a PVDF membrane (4°C); the next day blotted membranes were initially washed (PBS, 5 min) and then exposed to a 0.5% glutaraldehyde PBS solution (45 min) to cross link and fix proteins. After a second set of washes in Tris-buffered saline (TBS), the membrane was blocked with 1.0% ECL blocking agent (GE Healthcare, Buckinghamshire, UK) in TBS containing 0.02% Tween-20 (TBST) for 1 h. The membrane was then incubated overnight in a TBST (0.1%) solution containing a rabbit anti-MLC20 antibody (1:1000 dilution). The next morning, the membrane was washed (TBST, 0.02%), and incubated in a TBST (0.1%) solution containing HRP–anti-rabbit antibody (1:10,000 dilution). The membrane was then washed for a final time in TBST (0.02%) and HRP detected with the Amersham ECL advance Western blotting detection kit (GE HealthCare). Emitted light was detected with a chemiluminescence image analyser and analysed with Multi Gauge v3.0 software (Fujifilm, ON, CA). MLC20 phosphorylation was expressed as a percentage of the total MLC20 protein pool.
Measurement of MYPT1 phosphorylation
Arterial protein extracts used in the assessment of MYPT1 phosphorylation were collected in a manner identical to the preceding MLC20 assay. In general accordance with Johnson et al. (2009), cerebral artery extracts were electrophoresed (30 mA) down a traditional 10% polyacrylamide gel for 2 h. This gel was then cut below the 70 kDa marker; the bottom and top half were then transferred to PVDF (75 min at 100 V, 4°C) and nitrocellulose (2 h at 100 V, 4°C), respectively. The PVDF membrane was subsequently washed in PBS, exposed to 0.5% gluteraldehdye in PBS (45 min), washed again (PBS) and then blocked (1 h) in a TBST (0.1%) solution containing 1.0% ECL blocking agent. Following a third set of washes (TBST, 0.02%), the PVDF membrane was placed overnight (4°C) in a TBST (0.1%) solution containing a rabbit anti-α smooth muscle actin antibody (1:1000). The next day, the membrane was washed again (TBST, 0.02%) and placed (1 h) in a TBST (0.1%) solution containing a HRP–anti-rabbit antibody (1:10,000). The membrane was then washed for a final time (TBST, 0.02%) and HRP detected by chemiluminescence. In contrast to PVDF, the nitrocellulose membrane was first stained with Ponceau S, washed in distilled water and then dried overnight on filter paper. The next day, the nitrocellulose membrane was blocked (1 h) in TBST (0.02%) containing 0.5% I-block and then transferred to a TBST (0.1%) solution containing a rabbit anti-phospho-MYPT1 antibody (1:1000, 1.5 h) directed against the T687 or the T855 site. The membrane was subsequently washed in TBST (0.02%) and placed in a TBST (0.1%) solution containing an anti-rabbit-IgG biotin conjugate (1:40,000, 1 h). Following this incubation period, the nitrocellulose membrane was washed in TBST (0.02%) and then placed in a TBST (0.1%) solution containing HRP–streptavidin (1:200,000, 30 min). Finally, the membrane was washed 5 more times in TBST (0.02%) and twice in TBS. HRP was subsequently detected by chemiluminescence as described in the preceding section. MYPT1 phosphorylation at the T697 or T855 site was standardized to α-actin and then expressed relative to 20 mmHg, 80 mmHg or 80 mmHg + diltiazem treatment.
Luminal Ca2+ imaging of HEK-293 cells expressing RyR2
To monitor luminal Ca2+ transients in HEK-293 cells, we used the Ca2+-sensitive fluorescence resonance energy transfer (FRET)-based chameleon protein D1ER (Palmer et al. 2004; Jones et al. 2008; Jiang et al. 2005). Briefly, HEK-293 cells which stably express RyR2 were transfected with D1ER cDNA 24 h prior to the induction of RyR2 with tetracycline (1 μg ml−1). After a 15 h stabilization period in cell culture, RyR2-expressing cells were perfused continuously at room temperature with buffer (in mm: 125 NaCl, 5 KCl, 1.2 KH2PO4, 6 glucose, 1.2 MgCl2, 25 Hepes, pH 7.4) containing CaCl2 (0 or 3 mm), ryanodine (50 μm), tetracaine (1 mm) and caffeine (5 mm). Using an inverted microscope equipped with a S-Fluor 20×/0.75 objective and a fluorescence camera, the D1ER protein was excited at 430 nm while emission spectra were captured at 470 and 535 nm using Simple PCI 6 software (Compix Inc., PA, USA) every 0.33 s. FRET was quantified by dividing the emission spectra at 535 nm by that collected at 470 nm. Control experiments were also performed on HEK-293 cells expressing D1ER but not RyR2.
Chemicals, drugs and enzymes
Bradykinin, caffeine, diltiazem, nifedipine, thapsigargin, cyclopiazonic acid, iberiotoxin and buffer reagents were purchased from Sigma-Aldrich (MO, USA). Fluo-4, fura-2 AM and pluronic acid were acquired from Molecular Probes (OR, USA) whereas ryanodine was obtained from Ascent Chemicals (NJ, USA). When required, stock agents were solubilized in DMSO and final solvent concentration did not exceed 0.05%. Primary, secondary and tertiary antibodies/substrates were obtained from the following sources: rabbit anti-MLC20, Santa Cruz Biotechnology (CA, USA); rabbit anti-α-actin, Abcam (MA, USA); rabbit anti-phospho-MYPT1, Millipore (MA, USA); anti-rabbit HRP, Thermo Scientific (ON, CA); anti-rabbit IgG biotin conjugate, Jackson Immuno Research (PA, USA); HRP–streptavidin, Thermo Scientific.
Statistical analysis
Data are expressed as means ± s.e.m., and n indicates the number of vessels or cells. No more than two experiments were performed on vessels from a given animal. Paired t tests were performed to compare the effects of a given condition/treatment on arterial diameter, Ca2+ wave frequency, VM or protein phosphorylation. P values ≤0.05 were considered statistically significant.
Results
Pressure-induced responses in cerebral arteries
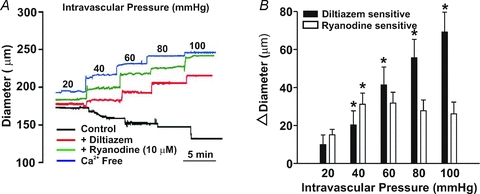
Cerebral arteries (with the endothelium removed) were mounted in an arteriograph, and exposed to intravascular pressures that varied from 20 to 100 mmHg. In the presence of extracellular Ca2+, arterial diameter was actively maintained across this pressure range and responses contrasted sharply with the passive distention observed in Ca2+-free PSS (Fig. 1A and B). The plotted difference between the active and passive response (Fig. 1C) further revealed the robust nature of the myogenic response. The principal Ca2+ event thought to drive myogenic reactivity is a global sustained rise in cytosolic [Ca2+] initiated by a depolarization that activates voltage-operated Ca2+ channels (Knot & Nelson, 1995, 1998; Knot et al. 1998; Welsh et al. 2000, 2002). While important, we hypothesized that elevated intravascular pressure might induce other events such as Ca2+ waves, described as discrete events that spread along the length of a cell and which are asynchronous among neighbouring myocytes (see Supplemental material for movie file). Using a systematic approach, Fig. 2A–C revealed that elevated pressure does indeed stimulate Ca2+ waves. Mean Ca2+ wave velocity at 80 mmHg was 61 ± 12 μm s−1 (n = 7), a value comparable to that of Jaggar (2001). Quantification revealed that the rise in Ca2+ wave generation, denoted by the percentage of cells firing these events and the number of waves per minute per firing cell, occurred primarily as cerebral arteries were modestly pressurized from 20 to 40 mmHg (Fig. 2D and E). Further pressurization to 80 mmHg elicited a modest but significant increase in the percentage of cells firing Ca2+ waves; event frequency also rose although this change was not statistically different.
Figure 1. Elevated intravascular pressure induces myogenic tone in rat cerebral arteries.
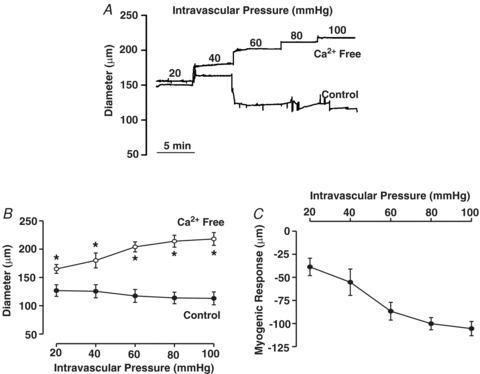
Posterior cerebral arteries were isolated, cannulated and pressurized between 20 and 100 mmHg. Arterial diameter was measured under control conditions and in Ca2+-free superfusate (zero Ca2++ 2 mm EGTA). Representative tracing (A) and summary data (B and C, n = 8 arteries from 8 animals) of the intravascular pressure response. *denotes significant increase from control.
Figure 2. Ca2+ waves in cerebral arteries.
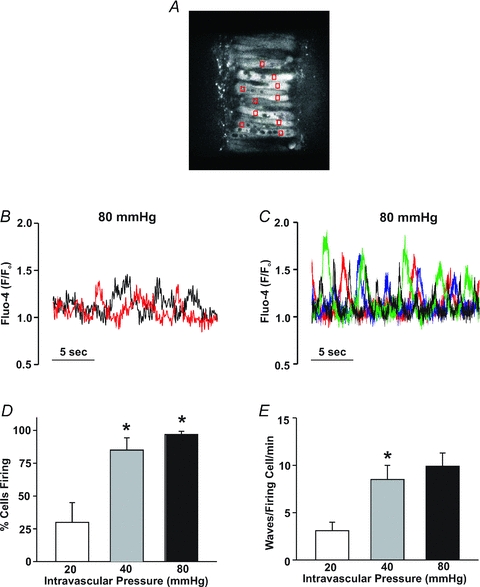
Isolated arteries were loaded with fluo-4, cannulated and pressurized to 20–80 mmHg. A, typical sampling protocol for Ca2+ waves: fluo-4 fluorescence (red boxes) was monitored in 10 successive and visible smooth muscle cells. B, fluo-4 fluorescence, monitored in a single cell but at two separate sites highlights the wave-like nature of the Ca2+ events (i.e. events denoted in the red trace consistently precede events in the black trace). C, fluo-4 fluorescent measured in 4 separate cells illustrates the asynchrony of the Ca2+ waves. D and E, effects of intravascular pressure (n = 8 arteries from 8 animals, 80 cells in total) on the percentage of cells firing Ca2+ waves (D) and on Ca2+ wave frequency (E). *denotes significant increase from the previous pressure step.
Basis of pressure-induced Ca2+ waves
To ascertain the role of the SR in Ca2+ wave generation, this study used micromolar ryanodine to place RyR into a subconductance state and thereby deplete this Ca2+ store (Smith et al. 1988). To illustrate ryanodine's mechanistic effect, two sets of control experiments were conducted. The first deployed HEK-293 cells expressing RyR2, one of the dominant isoforms in vascular smooth muscle (Coussin et al. 2000), and a FRET-based probe to monitor [Ca2+] in the endoplasmic reticulum (ER). As noted in Fig. 3A and B, Ca2+ was periodically released from these cells under control conditions, and ryanodine and tetracaine both eliminated these events albeit through different mechanisms. Consistent with ryanodine functioning as a depleting agent, the loss of the preceding Ca2+ events coincided with an overall reduction in ER [Ca2+]. In contrast, the tetracaine-induced loss of Ca2+ release corresponded with a rise in ER [Ca2+], a finding indicative of true RyR2 blockade. The application of ryanodine (n = 59) or tetracaine (n = 51) to HEK-293 cells expressing D1ER but not RYR2 did not appreciably change the FRET ratio. The depleting action of ryanodine was secondarily confirmed in intact arteries by documenting the inability of caffeine to induce a smooth muscle Ca2+ transient following a 10 min exposure to this plant derivative (Fig. 3C and D). Having confirmed the depleting action of ryanodine, a complete range of Ca2+ wave measurements were subsequently performed on pressurized cerebral arteries to illustrate that the loss of the SR store dramatically reduced the proportion of smooth muscle cells firing Ca2+ waves along with the frequency of these events (Fig. 3E and F).
Figure 3. The effects of ryanodine on internal Ca2+ store.
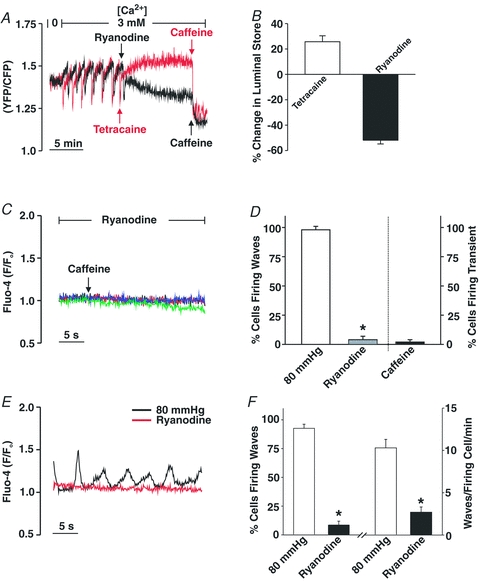
A and B, HEK-293 cells stably expressing RyR2 and the Ca2+-sensitive FRET-based chameleon protein (D1ER) were perfused with Ca2+-containing buffer while spontaneous luminal Ca2+ oscillations were monitored in the absence or presence of ryanodine (50 μm), tetracaine (1 mm) or caffeine (5 mm). Representative traces and summary data (n = 16 cells) are presented in A and B, respectively. The percentage change in the luminal store was calculated as follows: ((maximal luminal Ca2+ in ryanodine/tetracaine – minimal luminal Ca2+ in caffeine) – (peak luminal Ca2+ during Ca2+ oscillations – minimal luminal Ca2+ in caffeine))/(peak luminal Ca2+ during Ca2+ oscillations – minimal luminal Ca2+ in caffeine). C and D, pressurized cerebral arteries (80 mmHg) were loaded with fluo-4 and sampled for Ca2+ waves/transients in the absence and presence of ryanodine (50 μm) and caffeine (5 mm). Four representative traces of fluo-4 fluorescence are presented in C whereas data summarizing the effects of ryanodine and caffeine on the percentage of cells firing Ca2+ waves/transients are found in D (n = 3 arteries from 3 animals, 30 cells in total). *denotes significant decrease from control (80 mmHg). E and F, cerebral arteries loaded with fluo-4 were pressurized to 80 mmHg and sampled for Ca2+ waves in the absence or presence of ryanodine (50 μm). Representative recording of Ca2+ waves is presented in A whereas data summarizing (n = 6 arteries from 6 animals, 60 cells total) the effects of ryanodine on the percentage of cells firing Ca2+ waves and Ca2+ wave frequency can be found in B. *denotes significant decrease from control (80 mmHg).
Previous studies have presented conflicting views as to the importance of voltage in Ca2+ wave generation (Jaggar, 2001; Kuo et al. 2003; Lee et al. 2005; Dai et al. 2006). To address this issue, we first examined the effects of Ca2+ channel blockade on these asynchronous events. Control experiments preceded this examination in which 30 μm diltiazem, a blocker of voltage-operated Ca2+ channels, was shown to eliminate KCl-induced constriction in cerebral arteries pressurized to 20 or 80 mmHg (Fig. 4A and B). Having confirmed blocker efficacy, diltiazem was subsequently added to pressurized arteries loaded with fluo-4 to show that Ca2+ channel inhibition did not affect the percentage of smooth muscle cells firing waves or the number of waves per minute per firing cell (Fig. 4C and D). To further illustrate the voltage insensitivity of Ca2+ wave generation, additional experiments monitored whether these asynchronous events were altered when arterial VM was manipulated through changes in extracellular [K+]. Findings in Fig. 5A, C and D illustrate that elevating [K+] to 15 mm, a challenge that hyperpolarizes and dilates cerebral arteries pressurized to 80 mmHg (Smith et al. 2008), had no measurable effect on the generation of Ca2+ waves. A 30 mm K+ challenge, a perturbation that depolarizes and constricts cerebral arteries pressurized to 20 or 40 mmHg was equally ineffective (Fig. 5B and E–H). Interestingly, ∼50% of the cerebral arteries pressurized to 40 mmHg and exposed to the 15 mm K+ challenge displayed, over time, vasomotion as defined by large-amplitude, spontaneous constrictions (Fig. 6A). When this oscillatory behaviour was present, the Ca2+ events within individual smooth muscle cells displayed considerable synchronicity (Fig. 6B). A quantitative assessment performed on discernable cells (Fig. 6C) revealed that the synchronized Ca2+ events were longer in duration and greater in magnitude than the asynchronous Ca2+ waves observed in arteries that do not display vasomotion.
Figure 4. The effects of diltiazem on KCl-induced constriction and SR Ca2+ wave generation.
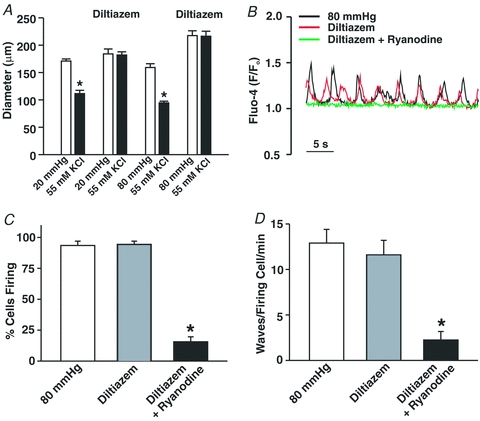
A, cerebral arteries pressurized to 20 or 80 mmHg (n = 6 arteries for 5 animals) were exposed to 55 mm KCl in the presence and absence of diltiazem (30 μm, voltage-operated Ca2+ channel inhibitor). B–D, pressurized cerebral arteries loaded with fluo-4 were sampled for Ca2+ waves in the absence and presence of diltiazem (30 μm) ± ryanodine (50 μm). Representative trace and summary data (n = 8 arteries from 8 animals, 80 cells total) highlighting the effects of diltiazem and ryanodine on the percentage of cells firing Ca2+ waves and wave frequency can be found in C and D, respectively. *denotes significant decrease from control (80 mmHg).
Figure 5. Ca2+ wave generation is voltage independent in cerebral arteries.
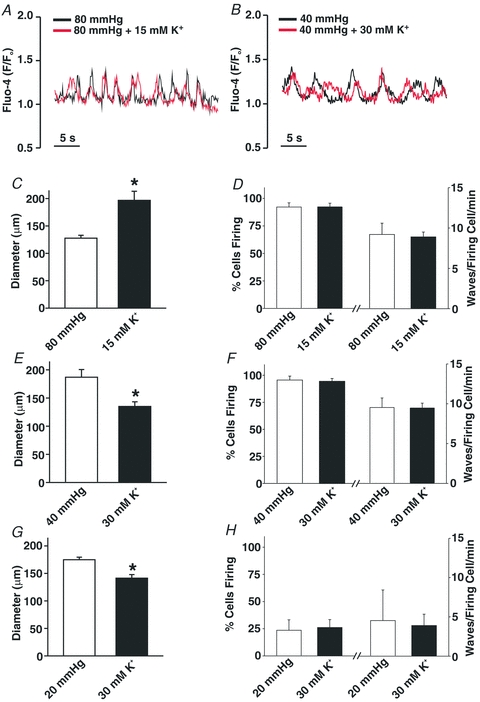
Cerebral arteries were loaded with fluo-4 and pressurized to 40 or 80 mmHg. Vessel diameter and Ca2+ wave generation was assessed under control conditions and in the presence of elevated extracellular [K+] (15 or 30 mm). A, C and D, representative trace (A) and summary data demonstrating the effects of 15 mm extracellular [K+] on resting diameter (C, n = 6 arteries from 5 animals), and on Ca2+ wave generation (D, n = 6 arteries from 6 animals, 60 cells total) as assessed by the percentage of cells firing Ca2+ waves and wave frequency. B, E and F, representative trace (B) and summary data demonstrating the effects of 30 mm extracellular [K+] on resting diameter (E, n = 6 arteries from 6 animals), and on Ca2+ wave generation (F, n = 6 arteries from 6 animals, 60 cells total) as assessed by the percentage of cells firing Ca2+ waves and wave frequency. G and H, summary data demonstrating the effects of 30 mm extracellular [K+] on resting diameter (G, n = 6 arteries from 6 animals) and Ca2+ wave generation (H, n = 5 arteries from 5 animals, 50 cells total) in cerebral arteries pressurized to 20 mmHg. *denotes significant difference from 80, 40 or 20 mmHg.
Figure 6. Elevated extracellular K+ elicits vasomotion and Ca2+ wave synchronization.
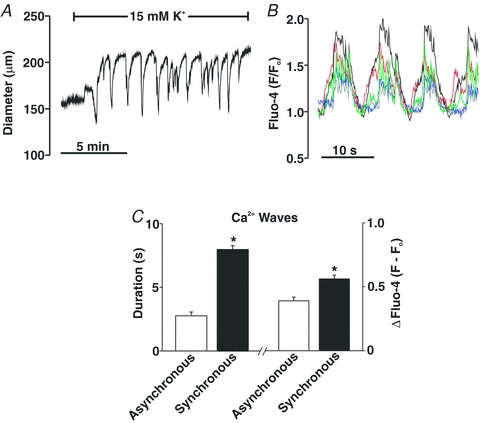
Cerebral arteries were pressurized to 80 mmHg; arterial diameter and Ca2+ waves were sampled under control conditions and with 15 mM [K+] in the superfusate. A, effect of 15 mm[K+] on arterial diameter. B, effects of 15 mm[K+] on Ca2+ wave synchronization; coloured traces represent changes in fluo-4 fluorescence in different smooth muscle cells within the arterial wall. Arterial vasomotion and Ca2+ wave synchronization was observed in ∼50% of arteries exposed to 15 mm[K+]. C, summary data characterizing the duration and magnitude (F – Fo) of Ca2+ waves that are asynchronous (n = 4 arteries from 4 animals, 17 cells in total) and synchronous (n = 4 arteries from 4 animals, 19 cells in total). *denotes significant increase between the two groups.
Pressure-induced Ca2+ waves and arterial constriction
Having ascertained the voltage insensitivity of Ca2+ wave generation, we subsequently assessed whether or by what mechanism these events facilitate myogenic tone development. To accomplish this objective, we first monitored the diameter of pressurized arteries under control conditions and following a 5 min pre-incubation with diltiazem and/or ryanodine. Note that pre-incubation was performed with vessels resting at 15 mmHg. As the representative trace in Fig. 7A illustrates, diltiazem attenuated but did not completely abolish myogenic tone in arteries pressurized between 20 and 100 mmHg. Residual myogenic tone was diminished by a sizable extent by the further addition of 50 μm ryanodine. Interestingly, Fig. 7B revealed that the diltiazem-sensitive component of the myogenic response continuously rose as a function of intravascular pressure whereas the ryanodine-sensitive element peaked at 60 mmHg and was sustained thereafter. Reversing the order of agent application elicited a similar result, reinforcing the importance of Ca2+ wave generation in tone development particularly at low intravascular pressures (Fig. 7C and D). If nifedipine (100 nm) was used in place of diltiazem, myogenic tone was again attenuated and residual tone was markedly diminished by the application of ryanodine (Fig. 7E and F). Note that concentrations as low as 50 nm nifedipine will effectively block L-type Ca2+ currents in rat cerebral arterial smooth muscle cells (Adb El-Rahman et al. 2010). This concentration is in keeping with nifedipine's reported IC50 (10 nm) for the smooth muscle splice variant of the L-type Ca2+ channel. If nifedipine was elevated to 1 μm, a concentration ∼100 times above the reported IC50 for the splice variant (Liao et al. 2007), a similar pattern emerged (Fig. 7G and H). Myogenic tone was suppressed but not abolished and the nifedipine-insensitive component was attenuated by the further addition of ryanodine. At micromolar concentrations, the target specificity of nifedipine is a concern as past studies have noted that this agent can interfere with other Ca2+-permeable pores (Akaike et al. 1989a,b; Copello et al. 2007; Curtis & Scholfield, 2001; Nikitina et al. 2007).
Figure 7. The effects of diltiazem, nifedipine and ryanodine on the myogenic response.
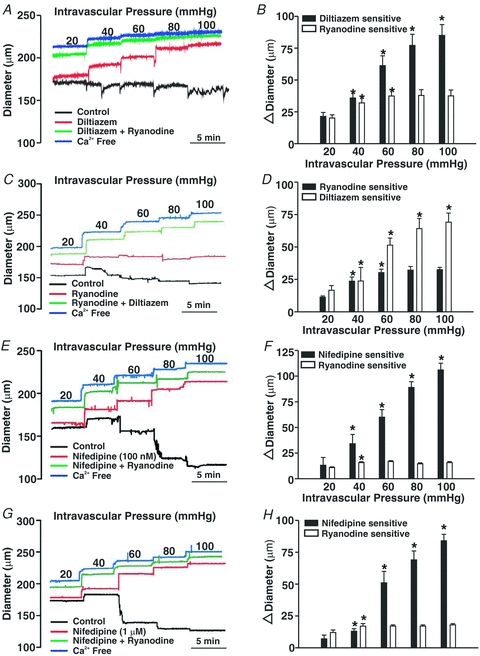
Cerebral arteries were pressurized from 20 to 100 mmHg while arterial diameter was monitored in the absence and presence of diltiazem (30 μm), nifedipine (100 nm or 1 μm) and/or ryanodine (50 μm). Representative traces and summary data are presented in A, C, E and G and B, D, F and H, respectively. *denotes significant increase from the preceding pressure step. In B, resting and maximal diameters (in μm) were as follows (n = 8 arteries in 8 animals): 20 mmHg, 143 ± 4, 186 ± 3; 40 mmHg, 140 ± 6, 205 ± 4; 60 mmHg, 124 ± 6, 211 ± 4; 80 mmHg, 116 ± 7, 213 ± 4; and 100 mmHg, 113 ± 7, 217 ± 4. In D, resting and maximal diameters (in μm) were as follows (n = 5 arteries from 5 animals): 20 mmHg, 156 ± 4, 188 ± 4; 40 mmHg, 154 ± 4, 205 ± 5; 60 mmHg, 139 ± 5, 215 ± 3; 80 mmHg, 131 ± 5, 218 ± 3; and 100 mmHg, 129 ± 6, 221 ± 3. In F, resting and maximal diameters (in μm) were as follows (n = 6 arteries from 5 animals): 20 mmHg, 174 ± 13, 206 ± 12; 40 mmHg, 169 ± 12, 226 ± 12; 60 mmHg, 154 ± 12, 237 ± 14; 80 mmHg, 137 ± 13, 246 ± 14; and 100 mmHg, 129 ± 12, 253 ± 14. In H, resting and maximal diameters (in μm) were as follows (n = 6 arteries from 6 animals): 20 mmHg, 174 ± 6, 204 ± 5; 40 mmHg, 184 ± 6, 224 ± 7; 60 mmHg, 159 ± 9, 236 ± 7; 80 mmHg, 151 ± 8, 244 ± 7; and 100 mmHg, 145 ± 7, 253 ± 7.
The diltiazem/nifedipine-insensitive component highlighted in the preceding paragraph appears, on the surface, to be absent from the original studies of Knot (Knot & Nelson, 1998; Knot et al. 1998). However, a closer examination of this earlier work reveals that EGTA was not included in the zero Ca2+ media, which could lead to an improper assessment of maximal diameter and make it difficult to observe the diltiazem/nifedipine-dependent component. Findings in Fig. 8A and B support this perspective. Analogous to Knot (Knot & Nelson, 1998; Knot et al. 1998), PSS containing diltiazem or diltiazem/zero Ca2+ attenuates myogenic tone to a similar degree. Arterial diameter was not, however, maximal as the 2 mm EGTA/zero Ca2+ PSS elicited further dilatation at intravascular pressures ranging from 20 to 100 mmHg. The functional impact of this oversight becomes clear when diltiazem-sensitive tone is plotted proportionally to the total response range (maximal diameter – resting diameter). When maximal diameter is ascertained in diltiazem/zero Ca2+ PSS, diltiazem appears to block 73–95% of the purported tone (Fig. 8C). This percentage drops to 47–76% when maximal diameter is set in a zero Ca2+/2 mm EGTA PSS.
Figure 8. The effects of diltiazem, zero Ca2+ and zero Ca2+/2 mm EGTA on the myogenic response.
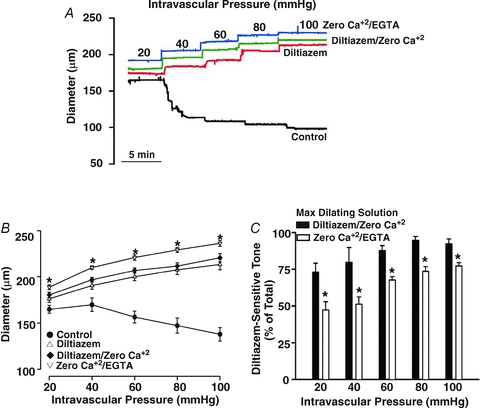
Cerebral arteries were pressurized from 20 to 100 mmHg while arterial diameter was monitored in the absence and presence of PSS containing diltiazem (30 μm), diltiazem ± zero externally added Ca2+ and zero Ca2+/2 mm EGTA. Representative trace and summary data (n = 5 from 4 animals) are presented in A, and B & C, respectively. In C, diltiazem-sensitive tone was calculated at any given pressure as (diltiazem – control)/(ditiazem/zero Ca2+ or zero Ca2+/2 mm EGTA – control). *denotes significant increase from diltiazem/zero Ca2+.
The ability of ryanodine to attenuate myogenic tone in diltiazem-treated vessels suggests that these Ca2+ waves augment MLC20 phosphorylation, not by altering arterial VM and consequently Ca2+ channel activity, but by providing Ca2+ directly for MLCK or perhaps MLCP regulation. Consistent with this perspective, direct biochemical measurements revealed that while diltiazem attenuates the pressure-induced increase in MLC20 phosphorylation, further reductions were achievable with the addition of ryanodine (Fig. 9A and B). Electrical measurements in Fig. 10 subsequently revealed that 50 μm ryanodine has little measurable effect on arterial VM. The ability of ryanodine to attenuate Ca2+ wave generation, myogenic responsiveness and MLC20 phosphorylation could be replicated with other SR-depleting agents. This is illustrated in Fig. 11 where thapsigargin (200 nm), an SR Ca2+-ATPase inhibitor, notably attenuated Ca2+ wave generation, pressure-induced constriction and MLC20 phosphorylation. Like ryanodine, the thapsigargin-sensitive component of the myogenic response peaked at lower intravascular pressures and remained constant above 60 mmHg. Cyclopiazonic acid's (10 μm) effect on myogenic tone parallels those of thapsigargin (n = 6, authors’ unpublished observations).
Figure 9. The effects of diltiazem and ryanodine on MLC20 phosphorylation.
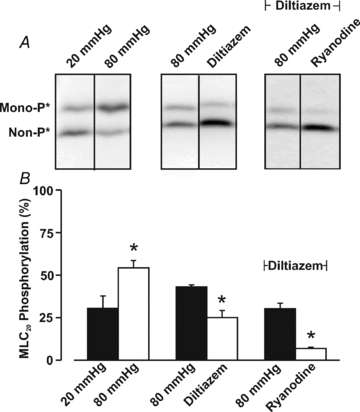
Cerebral arteries were pressurized to 20 or 80 mmHg and then exposed to diltiazem (30 μm) + ryanodine (50 μm). Vessels were subsequently frozen in acetone and processed for MLC20 phosphorylation measurements. Representative Western blots and summary data (n = 5 arterial pairs from 5 animals) are presented in A and B, respectively. The molecular mass of the unphosporylated band runs at ∼20 kDa. *denotes significant difference from 20 or 80 mmHg.
Figure 10. Ryanodine does not alter arterial membrane potential (VM).
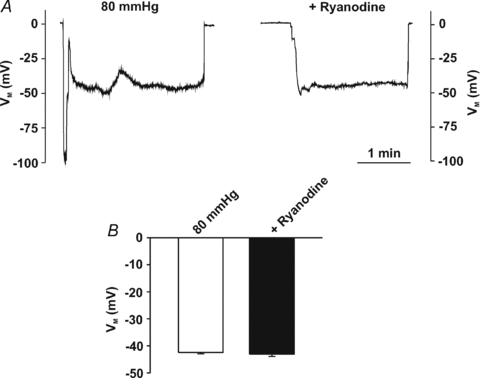
Cerebral arteries were pressurized (80 mmHg) while VM was monitored in the absence and presence of ryanodine (50 μm). Representative traces (A) and summary data (B, n = 7 arteries from 6 animals) of the effects of ryanodine on arterial VM.
Figure 11. The effects of thapsigargin on the development of myogenic tone.
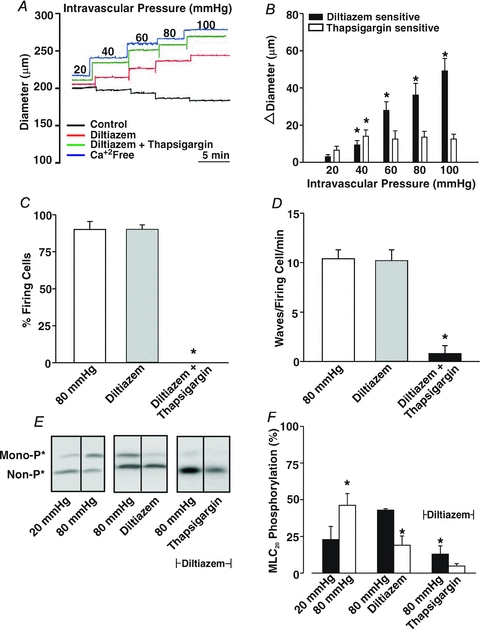
Briefly, cerebral arteries were pressurized between 20 and 100 mmHg while Ca2+ waves, arterial diameter and MLC20 phosphorylation were monitored in the absence and presence of diltiazem (30 μm) and/or thapsigargin (200 nm). Representative illustrations of Ca2+ wave generation, vasomotor responsiveness and MLC20 phosphorylation are presented in A, C and E, respectively. Summary data of vasomotor responsiveness (n = 6 arteries from 6 animals), Ca2+ wave generation (n = 5 arteries from 5 animals, 50 cells in total) and MLC20 phosphorylation (n = 4 arterial pairs from 4 animals) are presented in B, C & D, and F, respectively. *denotes significant difference from diltiazem or ryanodine alone. In A, resting and maximal diameters (in μm) were as follows: 20 mmHg, 160 ± 7, 173 ± 6; 40 mmHg, 162 ± 8, 190 ± 9; 60 mmHg, 158 ± 11, 202 ± 10; 80 mmHg, 148 ± 9, 207 ± 10; and 100 mmHg, 142 ± 10, 215 ± 10.
SR-dependent Ca2+ waves along with Ca2+ influx through voltage-operated Ca2+ channels augment MLC20 phosphorylation by either activating MLCK or inhibiting MLCP. While one cannot directly assess MLCK activity in intact rat cerebral arteries, MLCP activity can be inferred by measuring the phosphorylation state of MYPT1, a targeting/regulatory protein that directs the catalytic subunit of protein phosphatase 1 (PP1c) to myosin (Wooldridge et al. 2004; Wilson et al. 2005; Johnson et al. 2009). Findings in Fig. 12 illustrate that elevated intravascular pressure probably inhibits MLCP as MYPT1 phosphorylation increased at the T855 site. Consistent with Ca2+ influx through voltage-operated Ca2+ channels facilitating MLCP inhibition, diltiazem attenuated but did not completely abolish T855 phosphorylation. In the presence of diltiazem, the addition of 50 μm ryanodine or 200 nm thapsigargin further lowered T855 phosphorylation indicating a role for voltage-insensitive Ca2+ waves in the modulation of phosphatase activity. The phosphorylation state of T697 was unaffected by elevated intravascular pressure or the subsequent addition of diltiazem, ryanodine or thapsigargin.
Figure 12. The effects of diltiazem, ryanodine and thapsigargin on MYPT1 phosphorylation.
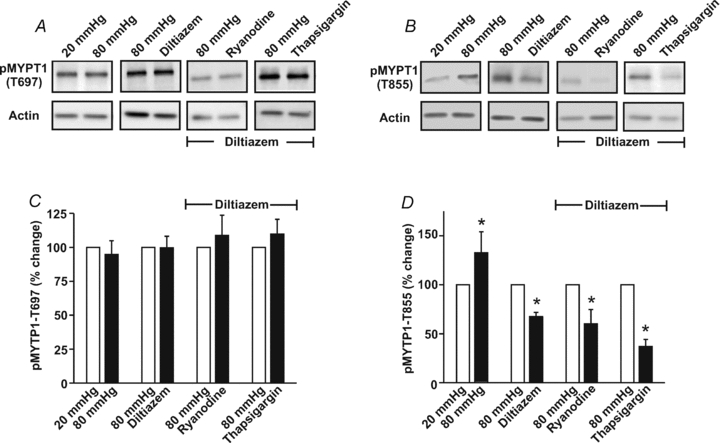
Cerebral arteries were pressurized to 20 or 80 mmHg and then exposed to diltiazem (30 μm), ryanodine (50 μm) or thapsigargin (200 nm). Vessels were subsequently frozen in acetone and processed for the assessment of MYPT1 phosphorylation at the T697 or T855 site. Representative Western blots are presented in A and B, whereas summary data (n = 4 arterial pairs from 4 animals) can be found in C and D, respectively. Phosphorylated MYPT1 was standardized to actin and then expressed relative to 20 mmHg, 80 mmHg or 80 mmHg + diltiazem. *denotes significant difference from 20 mmHg, 80 mmHg or 80 mmHg + diltiazem.
The preceding ryanodine findings appear, on the surface, to contradict previous studies showing that this plant alkaloid elicits arterial constriction (Knot et al. 1998; Yang et al. 2009). This difference in vasomotor responsiveness did not result from the lower ryanodine concentration used in past investigations, as Fig. 13A and B shows that at 10 μm this agent continues to attenuate myogenic tone development. A more likely explanation centres on the vessel's activation state when ryanodine is first applied. For example, Fig. 14A and B highlights that 10 μm ryanodine can indeed elicit a sustained constriction if arteries are pressurized to 80 mmHg. At higher intravascular pressures, ryanodine will probably induce constriction as the contractile apparatus is more sensitized to Ca2+ (Fig. 12) and smooth muscle cells have difficulty extruding SR Ca2+ as their depolarized state impairs forward-mode Na+/Ca2+ exchange activity (Kargacin & Fay, 1991; Raina et al. 2008; Zhao & Majewski, 2008). In support of the Na+/Ca2+ exchange argument, this study noted that the introduction of a brief hyperpolarization period (5 min) to promote forward-mode Na+/Ca2+ exchange activity, attenuated ryanodine-induced constriction at 80 mmHg (Fig. 14C and D). Hyperpolarization was promoted in this experimental protocol by lowering intravascular pressure and elevating extracellular [K+] (15 mm) to augment the activity of inward rectifying K+ channels. Interestingly, if Na+/Ca2+ exchange activity was blocked during the hyperpolarization period with an equilmolar substitution of LiCl (120 or 60 mm) for NaCl, ryanodine-induced constriction at 80 mmHg did not reverse (Fig. 14E and F). Similar results were obtained if NMDG-Cl (60 mm) was used as the ionic replacement for NaCl (Fig. 14G and H). This latter experiment is important in that it confirms that the lack of tone reversal by LiCl is unrelated to its ability, over the long term, to interfere with phosphatidylinositol synthesis (Galeotti et al. 2004).
Figure 13. The effect of 10 μm ryanodine on cerebral arterial tone.
A and B, cerebral arteries were pressurized from 20 to 100 mmHg while arterial diameter was monitored in the absence and presence of diltiazem (30 μm) and/or ryanodine (10 μm). All agents were first introduced to arteries resting at 15 mmHg. *denotes significant increase from the preceding pressure step. In B, resting and maximal diameters (in μm, n = 6 arteries from 6 animals) were as follows: 20 mmHg, 155 ± 9, 176 ± 8; 40 mmHg, 145 ± 11, 191 ± 9; 60 mmHg, 125 ± 11, 200 ± 10; 80 mmHg, 111 ± 10, 207 ± 11; and 100 mmHg, 101 ± 11, 213 ± 12.
Figure 14. The effect of Na+/Ca2+ exchange activity on ryanodine-induced tone.
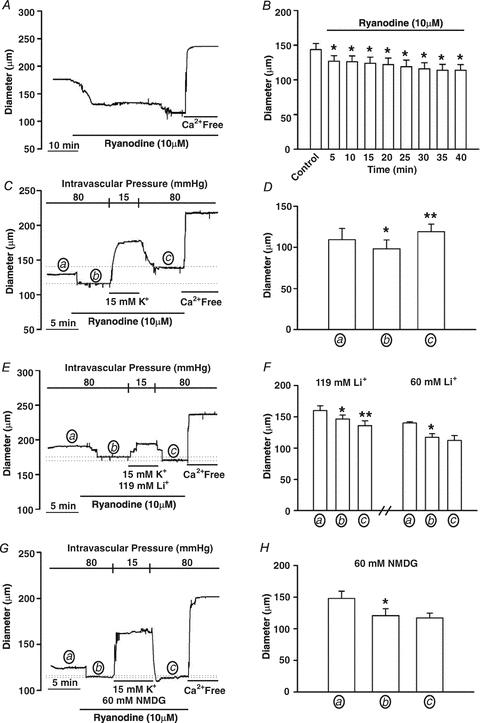
A and B, cerebral arteries pressurized to 80 mmHg were exposed to ryanodine (10 μm) and constrictor responses were monitored for 40 min. *denotes significant difference from control. In B, resting and maximal diameters (in μm) at 80 mmHg were 143 ± 9 and 201 ± 12, respectively. C and D, cerebral arteries pressurized to 80 mmHg and exposed to ryanodine (10 μm, 5 min) were hyperpolarized (5 min) by lowering intravascular pressure and exposing tissues to a ryanodine-PSS containing 15 mm extracellular K+. Vessels were then returned to a ryanodine-PSS and repressurized to 80 mmHg. Arterial diameter was assessed at the end of each 5 min period designated by a, b and c. * and **denote significant difference from a or b, respectively. In D, resting and maximal diameters (in μm, n = 6 arteries from 5 animals) at 80 mmHg were 109 ± 13.6 and 189 ± 10, respectively. E–H, the experimental protocol is identical to C and D except that during 5 min hyperpolarization period, the Na+/Ca2+ exchanger was blocked by substituting 119 mm LiCl (n = 6 arteries from 4 animals), 60 mm LiCl (n = 5 arteries from 4 animals) or 60 mm NMDG-Cl (n = 4 arteries from 4 animals) for NaCl. Arterial diameter was assessed at the end of each 5 min period designated by a, b and c. * and **denotes significant difference from a or b, respectively. In D, F and H, resting and maximal diameters (in μm) at 80 mmHg were as follows: D, 160 ± 7 and 227 ± 10, n = 6 from 4 animals; F, 140 ± 2 and 220 ± 9, n = 4 from 4 animals; and H, 148 ± 13 and 209 ± 4, n = 6 from 4 animals.
Discussion
This study examined whether elevated intravascular pressure stimulates Ca2+ waves and how their generation might contribute to myogenic tone development in the cerebral circulation. We report that elevated intravascular pressure augments the generation of asynchronous Ca2+ waves in cerebral arterial smooth muscle cells. The pressure-induced augmentation of these SR-driven events was particularly pronounced below 60 mmHg and was insensitive to voltage as Ca2+ channel blockade and perturbations in extracellular [K+] had no measurable effect on the percentage of cells firing Ca2+ waves or event frequency. The elimination of SR-dependent Ca2+ waves attenuated myogenic tone, an effect that was proportionally greater at lower intravascular pressures. Subsequent experiments revealed that these asynchronous Ca2+ events facilitate pressure-induced constriction not by initiating a dramatic change in arterial VM but by directly providing a proportion of the Ca2+ needed to drive MLC20 phosphorylation. The ability of Ca2+ waves to augment MLC20 phosphorylation was attributed to this divalent's ability to activate MLCK and to inhibit MLCP as inferred through changes in MYPT1 phosphorylation. In closing, this investigation argues that while SR-driven Ca2+ waves are indeed asynchronous and transient in nature, they are fully capable of modulating MLC20 phosphorylation and directing pressure-induced constriction in the cerebral vasculature.
Basis of pressure-induced Ca2+ waves
Bayliss is acknowledged as first suggesting that arterial tone is regulated by changes in intravascular pressure (Bayliss, 1902). Since his initial observations, the myogenic response has been observed in a variety of vascular beds including the cerebral circulation where it is essential to maintain constant perfusion over a range of blood pressures (Welsh et al. 2000, 2002; Hill et al. 2001; Loutzenhiser et al. 2002; Slish et al. 2002). Like any vasoactive stimulus, intravascular pressure mediates arterial tone by altering MLC20 phosphorylation, a process under the dynamic control of MLCK and MLCP (Knot & Nelson, 1998; Davis et al. 2001; Johnson et al. 2009). Mechanistic studies have strongly emphasized the idea that pressure-induced constriction was intimately linked to a global rise in cytosolic [Ca2+]. They particularly argued that pressure-induced increases in cytosolic [Ca2+] were driven by the depolarization of vascular smooth muscle and a sustained influx of Ca2+ through voltage-operated Ca2+ channels (Knot & Nelson, 1995, 1998; Knot et al. 1998; Welsh et al. 2000, 2002). While this perspective is firmly based on a breadth of observations, it is conceivable that there are additional means for a mechano-stimulus to elevate cytosolic [Ca2+]. In theory, a pressure stimulus could induce asynchronous Ca2+ waves, SR-driven events that most often start and terminate at the ends of vascular smooth muscle cells. Studies of pressure-induced Ca2+ waves have to date been inconclusive. For example, Miriel et al. (1999) noted that fewer than 10% of smooth muscle cells consistently fired Ca2+ waves in pressurized cerebral arteries, a finding that contrasts with Jaggar (2001) who reported that this mechano-stimulus increased the frequency of these events. Mesenteric observations have also added to this lack of consensus by noting that pressurization induces ‘Ca2+ ripples’, a subtle oscillatory event maintained on top of a sustained rise in cytosolic [Ca2+] (Zacharia et al. 2007).
It was within this context that we addressed whether elevated intravascular pressure sustainably induces Ca2+ waves in cerebral arteries. Initial experiments reconfirmed the robust nature of the myogenic response, with its magnitude progressively increasing as pressure was stepped from 20 to 100 mmHg (Fig. 1). Consistent with Jaggar (2001), we observed that elevated pressure augmented Ca2+ wave generation in cerebral arterial smooth muscle cells. This augmentation, quantified as the percentage of cells firing Ca2+ waves and event frequency per firing cell, was particularly pronounced as arteries were initially pressured from 20 to 40 mmHg. Pressure-induced Ca2+ waves were sustainably generated and observable by confocal microscopy as long as vessels were not overloaded with fluo-4 and irradiation time was limited to less than 2 min. When irradiation exceeded this defined period, Ca2+ wave generation dramatically decreased, global fluo-4 fluorescence rose and arteries irreversibly constricted. These changes are indicative of laser-induced tissue damage and perhaps it is this type of injury that prevented Miriel et al. (1999) from observing pressure-induced Ca2+ waves in the cerebral circulation.
Past studies have consistently shown that constrictor agonists augment Ca2+ wave generation through the release of SR Ca2+ (Jaggar & Nelson, 2000; Kuo et al. 2003; Lamont & Wier, 2004; Lee et al. 2005). This perspective grew from an experimental approach which revealed that when Ca2+ release was impaired through the inhibition of IP3 receptors or the reuptake of SR Ca2+, there was a dramatic decline in the generation of these asynchronous events (Kuo et al. 2003; Lamont & Wier, 2004; Lee et al. 2005). The SR dependency of pressure-induced Ca2+ waves was confirmed in the current investigation by superfusing tissues with ryanodine, a plant alkaloid that binds RyR, placing it into a subconductance state that slowly depletes SR Ca2+ (Fig. 3) (Smith et al. 1988). Having clearly ascertained that mechanical stimuli induce SR-driven Ca2+ waves, subsequent experiments focused on whether these events were dependent upon Ca2+ influx through voltage-operated Ca2+ channels. Our interest in this question stems from the work of Jaggar (2001) who argued that without membrane depolarization and the subsequent activation of L-type Ca2+ channels to refill the SR store, it was not possible to maintain these asynchronous Ca2+ events. Contrary to this view, two general sets of observations argue against a close association. First, diltiazem, a blocker of voltage-operated Ca2+ channels, had no appreciable effect on Ca2+ wave generation (Fig. 4). Second, raising extracellular [K+] in a manner that hyperpolarizes or depolarizes pressurized arteries over a range of approximately 20 mV (Knot & Nelson, 1995, 1998; Welsh et al. 2000), did not influence the percentage of cells firing Ca2+ waves or the frequency of these events (Fig. 5). The voltage insensitivity of pressure-induced Ca2+ waves is perhaps unsurprising in that when membrane potential does govern the Ca2+ release process (e.g. myocardium), the SR Ca2+ transients among the neighbouring cells are typically synchronized (Bers, 2008). Interestingly, synchronized Ca2+ events were occasionally observed in pressurized cerebral arteries exposed to 15 mm extracellular [K+] (Fig. 6). While the dramatic changes in arterial diameter often impaired our ability to consistently apply quantitative analysis, the data collected from ∼20 discernible cells revealed that synchronized Ca2+ events displayed temporal and spatial characteristics different from their asynchronous cousins. In particular, this study observed that the overall duration and magnitude of the synchronized Ca2+ events was ∼2- to 3-fold greater than asynchronous Ca2+ waves. Intriguingly, this study also documented evidence of a two-step release process, similar to that of rat Purkinje cells (Stuyvers et al. 2005). Perhaps a concerted biophysical focus on such synchronized events might, in the future, yield new insights into the basis of excitation–contraction coupling in vascular smooth muscle.
Function of pressure-induced Ca2+ waves
In the vascular literature, Ca2+ influx through voltage-operated Ca2+ channels is thought to be responsible for MLCK and/or MLCP modulation, and the induction of myogenic tone (Knot & Nelson, 1995, 1998; Knot et al. 1998; Welsh et al. 2000, 2002). Ca2+ waves have received less attention, and if invoked, they are thought to have a restricted effect on tone development (Jaggar, 2001). To address this, a set of experiments were performed in which the diameter of pressurized cerebral arteries was monitored under conditions in which diltiazem and/or ryanodine were used to block voltage-operated Ca2+ channels and deplete the SR Ca2+ store, respectively. Consistent with past investigations, this study confirmed that Ca2+ influx via voltage-operated Ca2+ channel activation does play a pivotal role in myogenic tone development (Fig. 7) (Knot & Nelson, 1995, 1998; Knot et al. 1998). Interestingly, diltiazem did not completely eliminate myogenic tone, an observation suggestive of an additional source of Ca2+ contributing to tone development. Consistent with SR Ca2+ waves operating as this additional source, ryanodine application reduced the diltiazem-insensitive component of the myogenic response. Interestingly, diltiazem-sensitive tone continuously rose as a function of intravascular pressure whereas the ryanodine-sensitive element peaked at 60 mmHg and was constant thereafter. Reversing the order of agent application produced a quantitatively similar effect as did experiments in which nifedipine was used in place of diltizem to block voltage-operated Ca2+ channels. Caution is required when working with dihydropyridines as there are persistent observations that low micromolar concentrations can have secondary effects on other Ca2+ handling mechanisms (Akaike et al. 1989a; Copello et al. 2007; Curtis & Scholfield, 2001; Kumar et al. 2002; Nikitina et al. 2007). For example, Curtis & Scholfield (2001) reported that at 1 μm, nifedipine interferes with the refilling of the SR through a non-L-type Ca2+ channel. Others have reported that at concentrations commonly used in the vascular field, dihydropyridines can block T-type Ca2+ channels (Akaike et al. 1989a,b; Nikitina et al. 2007). Such findings are not, however, universal (Kuo et al. 2010).
The diltiazem/nifedipine-insensitive component described above appears, on the surface, to vary from the original work of Knot (Knot & Nelson, 1998; Knot et al. 1998) who noted L-type Ca2+ channel blockers elicit a near-complete block of the myogenic response. However, a more detailed analysis of this earlier work reveals that EGTA was not included in the zero Ca2+ media, an omission that would impact on the assessment of maximal diameter and the relative importance of L-type Ca2+ channels. The experiments in Fig. 8 supported this particular view. Like Knot (Knot & Nelson, 1998; Knot et al. 1998), PSS containing diltiazem or diltiazem/zero Ca2+ attenuated myogenic tone to a similar degree. Arterial diameter was not, however, maximal as a 2 mm EGTA/zero Ca2+ PSS further dilated cerebral arteries at all intravascular pressures. The functional impact of oversight is evident in Fig. 8C when one plots diltiazem-sensitive tone proportionally to the total response range (maximal diameter – resting diameter). Note the variant picture that emerges depending on whether maximal diameter is ascertained in a diltiazem/zero Ca2+ or 2 mm EGTA/zero Ca2+ PSS. In the former, diltiazem blocks 73–95% of the available tone whereas in the latter, this Ca2+ channel blocker only attenuates 47–76%.
Overall, the findings in Figs 2–8 indicate that Ca2+ waves probably provide a proportion of the Ca2+ required to activate MLCK and/or inhibit MLCP. In support of this interpretation, our Western blotting data showed that while diltiazem attenuated pressure-induced MLC20 phosphorylation, one could further diminish phospho-protein content with the further application of ryanodine (Fig. 9). These particular results raise interesting questions with respect to the presumed role of the SR in regulating contractile function. One theory is that the principal function of SR Ca2+ release is to control the electrical state of vascular smooth muscle through the regulation of Ca2+-sensitive ion channels. This perspective initially developed from electrophysiological observations showing that discrete SR events called ‘Ca2+ sparks’ activate BK channels and elicit spontaneous transient outward currents (Jaggar et al. 1998b; Perez et al. 1999, 2001). It has been further fostered by findings attempting to link Ca2+ wave generation to the activation of transient receptor potential channels (Gonzales et al. 2010). While an interesting perspective, this study did not observe a substantive relationship between SR Ca2+ release and ion channel activity as ryanodine application failed to alter arterial VM under conditions in which Ca2+ spark and Ca2+ wave activity should be optimal (Fig. 10). While no measurable changes were observed, caution is warranted in extending the interpretation. In theory, Ca2+ sparks may indeed be activating BK channels but their contribution to arterial VM might be more modest than previously noted (Knot et al. 1998) and below our resolution limit (∼3 mV). This perspective to some degree is consistent with computational results which show that near-maximal values of STOC frequency and amplitude can at best elicit a 5 mV change in arterial VM (Diep et al. 2005). Alternatively, it could be argued that as a SR-depleting agent, ryanodine would not only eliminate the hyperpolarizing influence of Ca2+ spark generation, but the depolarizing influence stemming from Ca2+ wave production and the activation of TRPM4 channels (Gonzales et al. 2010).
Ryanodine has several perceived advantages over other agents used to deplete the SR Ca2+ store. First, ryanodine retains a high target selectivity and its mechanism of action is well documented in the cardiovascular literature (Dibb et al. 2007; Gyorke & Terentyev, 2008). It is also less likely to mobilize endothelial Ca2+ stores as this cell type does not normally express RyR (Ledoux et al. 2008). Despite these advantages, it is important to employ other SR-depleting agents such as thapsigargin. Figure 11 shows that this Ca2+-ATPase inhibitor compromises Ca2+ wave generation, myogenic tone development and MLC20 phosphorylation in a manner similar to ryanodine. Thus, our observations consistently show that Ca2+ liberated from the SR store plays a direct role in mediating pressure-induced constriction. In theory, Ca2+ waves could facilitate MLC20 phosphorylation by directly regulating MLCK via divalent binding to low-affinity sites on calmodulin (Walsh et al. 1995). Alternatively, Ca2+ waves could facilitate MLCP inhibition through an undetermined effect on Rho-kinase (Sward et al. 2000) or a PKC-mediated event involving CPI-17, a phospho-regulatory protein (Dimopoulos et al. 2007; Kitazawa et al. 2009). While MLCK cannot be dynamically assayed in rat cerebral arteries, MLCP activity can be inferred by measuring MYPT1 phosphorylation. MYPT1 is a targeting/regulatory protein that directs the catalytic subunit of PP1c to myosin (Wooldridge et al. 2004; Wilson et al. 2005; Johnson et al. 2009). When phosphorylated at T697 or T855, PP1c activity will decrease, an event that will precipitate MLC20 phosphorylation (Wooldridge et al. 2004; Wilson et al. 2005; Johnson et al. 2009). Consistent with past investigations (Johnson et al. 2009), this study documented the ability of elevated intravascular pressure to enhance MYPT1 T855 phosphorylation (Fig. 12). Indicative of SR Ca2+ waves driving MLC20 phosphorylation partially through MLCP inhibition, ryanodine and thapsigargin application both reduced T855 phosphorylation in diltiazem-treated arteries.
In presenting the preceding observations, it is important to acknowledge past investigations which have shown that instead of attenuating arterial tone, SR-depleting agents like ryanodine promote vessel constriction (Knot et al. 1998; Yang et al. 2009). Control experiments confirmed that this dichotomy was unrelated to subtle differences in ryanodine concentration (Fig. 13A and B) but was probably the predictable consequence of applying this plant alkaloid to vessels residing at different activation states. To elaborate, past studies have typically applied ryanodine to arteries exposed to intravascular pressures more than 60 mmHg (Knot et al. 1998; Yang et al. 2009). At higher pressure, ryanodine will probably induce arterial constriction as the contractile apparatus is more sensitized to Ca2+ (Fig. 12) and smooth muscle cells have greater difficulty extruding SR Ca2+ as their depolarized state impairs forward operation of the Na+/Ca2+ exchanger (Kargacin & Fay, 1991; Raina et al. 2008; Zhao & Majewski, 2008; Johnson et al. 2009). In contrast to previous work, this study introduced ryanodine to cerebral arteries resting at low intravascular pressure (15 mmHg). In this less stimulated state, Ca2+ sensitization is reduced and the hyperpolarized state of vascular smooth muscle will facilitate SR Ca2+ removal by promoting forward-mode Na+/Ca2+ exchanger activity. This study presents three key findings to support this general perspective (Fig. 14). First, we report that ryanodine induces arterial constriction if this agent is introduced to vessels pressurized to 80 mmHg. Second, we show that ryanodine-induced constriction can be partly reversed if tissues are briefly hyperpolarized to promote forward-mode Na+/Ca2+ exchanger activity. Lastly, if the Na+/Ca2+ exchanger is blocked during the hyperpolarization period, by an equilmolar substitution of LiCl/NMDG-Cl for NaCl, the preceding reversal of ryanodine-induced constriction is eliminated. While caution is warranted with ion substitution experiments, as a reduction in Na+ could affect other Na+-dependent transporters, these experiments help to rationalize ryanodine's dichotomous ability to influence arterial tone. These findings also raise significant questions as to the best methods of applying SR-depleting agents to probe the functional role of this internal store in resistance arteries. As most investigations aspire to compromise SR Ca2+ dynamics without dramatically influencing cytosolic [Ca2+], best practice would appear to dictate that SR-depleting agents should be applied to unstimulated arteries, residing in a hyperpolarized state.
Summary
In the past, studies of the myogenic response have argued that pressure-induced constriction fundamentally arises from the activation of a mechano-sensitive inward current which depolarizes vascular smooth muscle and induces a sustained influx of extracellular Ca2+ via the voltage-operated Ca2+ channels (Knot & Nelson, 1995, 1998; Welsh et al. 2000, 2002). While important, the present study introduces the idea that the internal SR store also provides a proportion of Ca2+, in the form of an asynchronous and voltage-insensitive wave, needed to sustain this physiological response. It also highlights that such events, along with Ca2+ influx through voltage-operated Ca2+ channels, retain an ability not only to activate MLCK but to inhibit MLCP (Fig. 15). Overall, our findings raise an important philosophical question centred on why two different Ca2+ responses are needed to initiate and maintain myogenic tone. In theory, the temporal characteristics of the two Ca2+ responses could enable smooth muscle to variably activate different Ca2+-dependent processes involved in MLC20 phosphorylation and cellular contraction (Walsh et al. 1995; Sward et al. 2000; Dimopoulos et al. 2007). Alternatively, it could be the voltage dependency/independency of the two events and not their temporal characteristics that are functionally important. For example, by decoupling Ca2+ wave generation from voltage, tissues are ensured that a Ca2+ source is always available to maintain some arterial tone even at hyperpolarized potentials where the overall activity of voltage-operated Ca2+ channels, albeit L- or the newly defined T-type, is more limited (Knot & Nelson, 1995; Kuo et al. 2010). This perspective is congruent with the fact that Ca2+ wave generation and its contribution to tone development was proportionally greater at lower intravascular pressures.
Figure 15. Illustrative diagram highlighting the mechanism by which elevated intravascular pressure initiates cerebral arterial constriction.
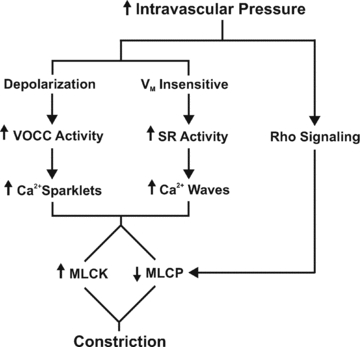
VOCC, voltage-operated Ca2+ channels; SR, sarcoplasmic reticulum; MLCK, myosin light chain kinase; and MLCP, myosin light chain phosphatase.
Further work is required to resolve which ion channels enable mechanical stimuli to generate SR-dependent Ca2+ waves. Given that phospholipase C inhibition limits myogenic tone development, it is logical to assume a role for IP3 receptors in asynchronous wave generation (Osol et al. 1993). It would be imprudent, however, to completely exclude RyR. As to a triggering event, some form of a Ca2+-induced Ca2+ release may underlie the overall process. Smooth muscle is notable for the expression of several Ca2+-permeable channels and if properly positioned, localized Ca2+ influx could induce the described SR-driven event (Knot & Nelson 1998; Nikitina et al. 2007; Earley & Brayden, 2010). Channels that operate independent of voltage would be of particular interest although one cannot exclude, a priori, T-type Ca2+ channels. In theory, if T-type Ca2+ channels were clustered, like the L-type, they might be able to generate a sparklet-like event without displaying normal voltage-dependent properties (Navedo et al. 2006).
Acknowledgments
This work was principally supported by an operating grant from the Canadian Institute of Health Research (CIHR) and the Natural Science and Engineering Research Council of Canada to DGW. Supplemental funding for Fig. 12 was also provided from CIHR operating grant to W.C.C. D.G.W. is a senior scholar with the Alberta Heritage Foundation for Medical Research (AHFMR) and holds a Canada Research Chair; W.S.W.C. is a scientist with AHFMR; W.C.C. is the Andrew Family Professor in Cardiovascular Research. R.E.M., A.E.-Y. and P.P.J. receive stipend support from the Saudi Arabian Cultural Ministry, AHFMR & CIHR, and AHFMR & Heart/Stroke Foundation of Canada, respectively.
Glossary
Abbreviations
- MLC
myosin light chain
- MLCK
myosin light chain kinase
- MLCP
myosin light chain phosphatase
- MYPT1
myosin phosphatase targeting subunit
- PP1c
protein phosphatase 1
- SR
sarcoplasmic reticulum
- STOC
spontaneous transient outward current
Author contributions
R.E.M.: Conception, design, analysis and interpretation of all functional and biochemistry based experiments. Contributed to the intellectual content and final draft of the published manuscript. S.E.B.: Conception, design, analysis and interpretation of the Calcium wave experiments. Contributed to the editing of draft manuscripts. C.H.T.T.: Conception, design, analysis and interpretation of the membrane potential experiments. R.A.E.R., Y.A., A.E.Y. and W.C.C.: Aided in the implementation and design of the biochemistry and membrane potential experiments. Contributed to the editing of draft manuscripts. P.P.J. & W.S.W.C.: Design, analysis and interpretation of all HEK293 expression experiments. Contributed to the editing of draft manuscripts. D.G.W.: Conception and design of experiments, analysis and interpretation of data, drafting the article and revising it critically for important intellectual content, and final approval of the version to be published. All authors have approved the final draft of the manuscript.
Supplemental material
References
- Adb El-Rahman R, Turner R, Welsh DG. T- and L-type Ca2+ channels contribute to myogenic tone in cerebral arteries. FASEB J. 2010;24:1033. [Google Scholar]
- Akaike N, Kanaide H, Kuga T, Nakamura M, Sadoshima J, Tomoike H. Low-voltage-activated calcium current in rat aorta smooth muscle cells in primary culture. J Physiol. 1989a;416:141–160. doi: 10.1113/jphysiol.1989.sp017754. [DOI] [PMC free article] [PubMed] [Google Scholar]
- Akaike N, Kostyuk PG, Osipchuk YV. Dihydropyridine-sensitive low-threshold calcium channels in isolated rat hypothalamic neurones. J Physiol. 1989b;412:181–195. doi: 10.1113/jphysiol.1989.sp017610. [DOI] [PMC free article] [PubMed] [Google Scholar]
- Bayliss WM. On the local reactions of the arterial wall to changes in internal pressure. J Physiol. 1902;28:220–231. doi: 10.1113/jphysiol.1902.sp000911. [DOI] [PMC free article] [PubMed] [Google Scholar]
- Bers DM. Calcium cycling and signaling in cardiac myocytes. Annu Rev Physiol. 2008;70:23–49. doi: 10.1146/annurev.physiol.70.113006.100455. [DOI] [PubMed] [Google Scholar]
- Boittin FX, MaCrez N, Halet G, Mironneau J. Norepinephrine-induced Ca2+ waves depend on InsP3 and ryanodine receptor activation in vascular myocytes. Am J Physiol. 1999;277:C139–C151. doi: 10.1152/ajpcell.1999.277.1.C139. [DOI] [PubMed] [Google Scholar]
- Brayden JE, Bevan JA. Neurogenic muscarinic vasodilation in the cat. An example of endothelial cell-independent cholinergic relaxation. Circ Res. 1985;56:205–211. doi: 10.1161/01.res.56.2.205. [DOI] [PubMed] [Google Scholar]
- Copello JA, Zima AV, az-Sylvester PL, Fill M, Blatter LA. Ca2+ entry-independent effects of L-type Ca2+ channel modulators on Ca2+ sparks in ventricular myocytes. Am J Physiol Cell Physiol. 2007;292:C2129–C2140. doi: 10.1152/ajpcell.00437.2006. [DOI] [PMC free article] [PubMed] [Google Scholar]
- Coussin F, MaCrez N, Morel JL, Mironneau J. Requirement of ryanodine receptor subtypes 1 and 2 for Ca2+-induced Ca2+ release in vascular myocytes. J Biol Chem. 2000;275:9596–9603. doi: 10.1074/jbc.275.13.9596. [DOI] [PubMed] [Google Scholar]
- Curtis TM, Scholfield CN. Nifedipine blocks Ca2+ store refilling through a pathway not involving L-type Ca2+ channels in rabbit arteriolar smooth muscle. J Physiol. 2001;532:609–623. doi: 10.1111/j.1469-7793.2001.0609e.x. [DOI] [PMC free article] [PubMed] [Google Scholar]
- Dai JM, Kuo KH, Leo JM, van Breeman C, Lee CH. Mechanism of ACh-induced asynchronous calcium waves and tonic contraction in porcine tracheal muscle bundle. Am J Physiol Lung Cell Mol Physiol. 2006;290:L459–L469. doi: 10.1152/ajplung.00092.2005. [DOI] [PubMed] [Google Scholar]
- Davis MJ, Wu X, Nurkiewicz TR, Kawasaki J, Davis GE, Hill MA, Meininger GA. Integrins and mechanotransduction of the vascular myogenic response. Am J Physiol Heart Circ Physiol. 2001;280:H1427–H1433. doi: 10.1152/ajpheart.2001.280.4.H1427. [DOI] [PubMed] [Google Scholar]
- Dibb KM, Graham HK, Venetucci LA, Eisner DA, Trafford AW. Analysis of cellular calcium fluxes in cardiac muscle to understand calcium homeostasis in the heart. Cell Calcium. 2007;42:503–512. doi: 10.1016/j.ceca.2007.04.002. [DOI] [PubMed] [Google Scholar]
- Diep HK, Vigmond EJ, Segal SS, Welsh DG. Defining electrical communication in skeletal muscle resistance arteries: a computational approach. J Physiol. 2005;568:267–281. doi: 10.1113/jphysiol.2005.090233. [DOI] [PMC free article] [PubMed] [Google Scholar]
- Dimopoulos GJ, Semba S, Kitazawa K, Eto M, Kitazawa T. Ca2+-dependent rapid Ca2+ sensitization of contraction in arterial smooth muscle. Circ Res. 2007;100:121–129. doi: 10.1161/01.RES.0000253902.90489.df. [DOI] [PMC free article] [PubMed] [Google Scholar]
- Earley S, Brayden JE. Transient receptor potential channels and vascular function. Clin Sci. 2010;119:19–36. doi: 10.1042/CS20090641. [DOI] [PubMed] [Google Scholar]
- Filosa JA, Bonev AD, Straub SV, Meredith AL, Wilkerson MK, Aldrich RW, Nelson MT. Local potassium signaling couples neuronal activity to vasodilation in the brain. Nat Neurosci. 2006;9:1397–1403. doi: 10.1038/nn1779. [DOI] [PubMed] [Google Scholar]
- Garcia-Roldan JL, Bevan JA. Flow-induced constriction and dilation of cerebral resistance arteries. Circ Res. 1990;66:1445–1448. doi: 10.1161/01.res.66.5.1445. [DOI] [PubMed] [Google Scholar]
- Galeotti N, Bartolini A, Calvani M, Nicolai R, Ghelardini C. Acetyl-L-carnitine requires phospholipase C-IP3 pathway activation to induce antinociception. Neuropharmacology. 2004;47:286–294. doi: 10.1016/j.neuropharm.2004.03.016. [DOI] [PubMed] [Google Scholar]
- Gonzales AL, Amberg GC, Earley S. Ca2+ release from the sarcoplasmic reticulum is required for sustained TRPM4 activity in cerebral artery smooth muscle cells. Am J Physiol Cell Physiol. 2010;299:C279–C288. doi: 10.1152/ajpcell.00550.2009. [DOI] [PMC free article] [PubMed] [Google Scholar]
- Gyorke S, Terentyev D. Modulation of ryanodine receptor by luminal calcium and accessory proteins in health and cardiac disease. Cardiovasc Res. 2008;77:245–255. doi: 10.1093/cvr/cvm038. [DOI] [PubMed] [Google Scholar]
- Harder DR, Alkayed NJ, Lange AR, Gebremedhin D, Roman RJ. Functional hyperemia in the brain: hypothesis for astrocyte-derived vasodilator metabolites. Stroke. 1998;29:229–234. doi: 10.1161/01.str.29.1.229. [DOI] [PubMed] [Google Scholar]
- Hill MA, Zou H, Potocnik SJ, Meininger GA, Davis MJ. Arteriolar smooth muscle mechanotransduction: Ca2+ signaling pathways underlying myogenic reactivity. J Appl Physiol. 2001;91:973–983. doi: 10.1152/jappl.2001.91.2.973. [DOI] [PubMed] [Google Scholar]
- Jaggar JH. Intravascular pressure regulates local and global Ca2+ signaling in cerebral artery smooth muscle cells. Am J Physiol Cell Physiol. 2001;281:C439–C448. doi: 10.1152/ajpcell.2001.281.2.C439. [DOI] [PubMed] [Google Scholar]
- Jaggar JH, Nelson MT. Differential regulation of Ca2+ sparks and Ca2+ waves by UTP in rat cerbral artery smooth muscle cells. Am J Physiol Cell Physiol. 2000;279:C1528–C1529. doi: 10.1152/ajpcell.2000.279.5.C1528. [DOI] [PubMed] [Google Scholar]
- Jaggar JH, Porter VA, Lederer WJ, Nelson MT. Calcium sparks in smooth muscle. Am J Physiol Cell Physiol. 2000;278:C235–C256. doi: 10.1152/ajpcell.2000.278.2.C235. [DOI] [PubMed] [Google Scholar]
- Jaggar JH, Stevenson AS, Nelson MT. Voltage dependence of Ca2+ sparks in intact cerebral arteries. Am J Physiol Cell Physiol. 1998a;274:C1755–C1761. doi: 10.1152/ajpcell.1998.274.6.C1755. [DOI] [PubMed] [Google Scholar]
- Jaggar JH, Wellman GC, Heppner TJ, Porter VA, Perez GJ, Gollasch M. Ca2+ channels, ryanodine receptors and Ca2+-activated K+ channels: a functional unit for regulating arterial tone. Acta Physiol Scand. 1998b;164:577–587. doi: 10.1046/j.1365-201X.1998.00462.x. [DOI] [PubMed] [Google Scholar]
- Jiang D, Wang R, Xiao B, Kong H, Hunt DJ, Choi P, Zhang L, Chen SR. Enhanced store overload-induced Ca2+ release and channel sensitivity to luminal Ca2+ activation are common defects of RyR2 mutations linked to ventricular tachycardia and sudden death. Circ Res. 2005;97:1173–1181. doi: 10.1161/01.RES.0000192146.85173.4b. [DOI] [PubMed] [Google Scholar]
- Johnson RP, El-Yazbi AF, Takeya K, Walsh EJ, Walsh MP, Cole WC. Ca2+ sensitization via phosphorylation of myosin phosphatase targeting subunit at threonine-855 by Rho kinase contributes to the arterial myogenic response. J Physiol. 2009;587:2537–2553. doi: 10.1113/jphysiol.2008.168252. [DOI] [PMC free article] [PubMed] [Google Scholar]
- Jones PP, Jiang D, Bolstad J, Hunt DJ, Zhang L, Demaurex N, Chen SR. Endoplasmic reticulum Ca2+ measurements reveal that the cardiac ryanodine receptor mutations linked to cardiac arrhythmia and sudden death alter the threshold for store-overload-induced Ca2+ release. Biochem J. 2008;412:171–178. doi: 10.1042/BJ20071287. [DOI] [PubMed] [Google Scholar]
- Kargacin G, Fay FS. Ca2+ movement in smooth muscle cells studied with one- and two-dimensional diffusion models. Biophys J. 1991;60:1088–1100. doi: 10.1016/S0006-3495(91)82145-2. [DOI] [PMC free article] [PubMed] [Google Scholar]
- Kitazawa T, Semba S, Huh YH, Kitazawa K, Eto M. Nitric oxide-induced biphasic mechanism of vascular relaxation via dephosphorylation of CPI-17 and MYPT1. J Physiol. 2009;587:3587–3603. doi: 10.1113/jphysiol.2009.172189. [DOI] [PMC free article] [PubMed] [Google Scholar]
- Knot HJ, Lounsbury KM, Brayden JE, Nelson MT. Gender differences in coronary artery diameter reflect changes in both endothelial Ca2+ and ecNOS activity. Am J Physiol Heart Circ Physiol. 1999;276:H961–H969. doi: 10.1152/ajpheart.1999.276.3.H961. [DOI] [PubMed] [Google Scholar]
- Knot HJ, Nelson MT. Regulation of membrane potential and diameter by voltage-dependent K+ channels in rabbit myogenic cerebral arteries. Am J Physiol Heart Circ Physiol. 1995;269:H348–H355. doi: 10.1152/ajpheart.1995.269.1.H348. [DOI] [PubMed] [Google Scholar]
- Knot HJ, Nelson MT. Regulation of arterial diameter and wall [Ca2+] in cerebral arteries of rat by membrane potential and intravascular pressure. J Physiol. 1998;508:199–209. doi: 10.1111/j.1469-7793.1998.199br.x. [DOI] [PMC free article] [PubMed] [Google Scholar]
- Knot HJ, Standen NB, Nelson MT. Ryanodine receptors regulate arterial diameter and wall [Ca2+] in cerebral arteries of rat via Ca2+-dependent K+ channels. J Physiol. 1998;508:211–221. doi: 10.1111/j.1469-7793.1998.211br.x. [DOI] [PMC free article] [PubMed] [Google Scholar]
- Koller A, Kaley G. Endothelial regulation of wall shear stress and blood flow in skeletal muscle microcirculation. Am J Physiol Heart Circ Physiol. 1991;260:H862–H868. doi: 10.1152/ajpheart.1991.260.3.H862. [DOI] [PubMed] [Google Scholar]
- Kuo L, Chilian WM, Davis MJ. Interactions of pressure and flow-induced responses in porcine coronary resistance vessels. Am J Physiol Heart Circ Physiol. 1991;261:H1706–H1715. doi: 10.1152/ajpheart.1991.261.6.H1706. [DOI] [PubMed] [Google Scholar]
- Kuo KH, Dai J, Seow CY, Lee CH, van Breeman C. Relationship between asynchronous Ca2+ waves and force development in intact smooth muscle bundles of the porcine trachea. Am J Physiol Lung Cell Mol Physiol. 2003;285:L1345–L1353. doi: 10.1152/ajplung.00043.2003. [DOI] [PubMed] [Google Scholar]
- Kuo IY, Ellis A, Seymour VA, Sandow SL, Hill CE. Dihydropyridine-insensitive calcium currents contribute to function of small cerebral arteries. J Cereb Blood Flow Metab. 2010;30:1226–1239. doi: 10.1038/jcbfm.2010.11. [DOI] [PMC free article] [PubMed] [Google Scholar]
- Kumar PP, Stotz SC, Paramashivappa R, Beedle AM, Zamponi GW, Rao AS. Synthesis and evaluation of a new class of nifedipine analogs with T-type calcium channel blocking activity. Mol Pharmacol. 2002;61:649–658. doi: 10.1124/mol.61.3.649. [DOI] [PubMed] [Google Scholar]
- Lamont C, Wier WG. Different roles of ryanodine receptors and inositol (1,4,5)-trisphosphate receptors in adrenergically stimulated contractions of small arteries. Am J Physiol Heart Circ Physiol. 2004;287:H617–H625. doi: 10.1152/ajpheart.00708.2003. [DOI] [PubMed] [Google Scholar]
- Ledoux J, Taylor MS, Bonev AD, Hannah RM, Solodushko V, Shui B, Tallini Y, Kotlikoff MI, Nelson MT. Functional architecture of inositol 1,4,5-trisphosphate signaling in restricted spaces of myoendothelial projections. Proc Natl Acad Sci U S A. 2008;105:9627–9632. doi: 10.1073/pnas.0801963105. [DOI] [PMC free article] [PubMed] [Google Scholar]
- Lee CH, Kuo KH, Dai J, van Breeman C. Asynchronous calcium waves in smooth muscle cells. Can J Physiol Pharmacol. 2005;83:733–741. doi: 10.1139/y05-083. [DOI] [PubMed] [Google Scholar]
- Liao P, Yu D, Li G, Yong TF, Soon JL, Chua YL, Soong TW. A smooth muscle Cav1.2 Ca2+ channel splice variant underlies hyperpolarized window current and enhanced state-dependent inhibition by nifefipine. J Biol Chem. 2007;282:35133–35142. doi: 10.1074/jbc.M705478200. [DOI] [PubMed] [Google Scholar]
- Loutzenhiser R, Bidani A, Chilton L. Renal myogenic response: kinetic attributes and physiological role. Circ Res. 2002;90:1316–1324. doi: 10.1161/01.res.0000024262.11534.18. [DOI] [PubMed] [Google Scholar]
- Miriel VA, Mauban JR, Blaustein MP, Wier WG. Local and cellular Ca2+ transients in smooth muscle of pressurized rat resistance arteries during myogenic and agonist stimulation. J Physiol. 1999;518:815–824. doi: 10.1111/j.1469-7793.1999.0815p.x. [DOI] [PMC free article] [PubMed] [Google Scholar]
- Navedo MF, Amberg GC, Nieves M, Molkentin JD, Santana LF. Mechanisms underlying heterogeneous Ca2+ sparklet activity in arterial smooth muscle. J Gen Physiol. 2006;127:611–622. doi: 10.1085/jgp.200609519. [DOI] [PMC free article] [PubMed] [Google Scholar]
- Nikitina E, Zhang Z, Kawashima A, Jahromi BS, Bouryi VA, Takahashi M, Xie A, Macdonald RL. Voltage-dependent Ca2+ channels in dog basilar artery. J Physiol. 2007;580:523–541. doi: 10.1113/jphysiol.2006.126128. [DOI] [PMC free article] [PubMed] [Google Scholar]
- Osol G, Laher I, Kelley M. Myogenic tone is coupled to phospholipase C and G protein activation in small cerebral arteries. Am J Physiol Heart Circ Physiol. 1993;265:H415–H420. doi: 10.1152/ajpheart.1993.265.1.H415. [DOI] [PubMed] [Google Scholar]
- Palmer AE, Jin C, Reed JC, Tsien RY. Bcl-2-mediated alterations in endoplasmic reticulum Ca2+ analyzed with an improved genetically encoded fluorescent sensor. Proc Natl Acad Sci U S A. 2004;101:17404–17409. doi: 10.1073/pnas.0408030101. [DOI] [PMC free article] [PubMed] [Google Scholar]
- Perez GJ, Bonev AD, Nelson MT. Micromolar Ca2+ from sparks activates Ca2+-sensitive K+ channels in rat cerebral artery smooth muscle. Am J Physiol Cell Physiol. 2001;281:C1769–C1775. doi: 10.1152/ajpcell.2001.281.6.C1769. [DOI] [PubMed] [Google Scholar]
- Perez GJ, Bonev AD, Patlak JB, Nelson MT. Functional coupling of ryanodine receptors to KCa channels in smooth muscle cells from rat cerebral arteries. J Gen Physiol. 1999;113:229–238. doi: 10.1085/jgp.113.2.229. [DOI] [PMC free article] [PubMed] [Google Scholar]
- Raina H, Ella SR, Hill MA. Decreased activity of the smooth muscle Na+/Ca2+ exchanger impairs arteriolar myogenic reactivity. J Physiol. 2008;586:1669–1681. doi: 10.1113/jphysiol.2007.150268. [DOI] [PMC free article] [PubMed] [Google Scholar]
- Segal SS. Integration of blood flow control to skeletal muscle: key role of feed arteries. Acta Physiol Scand. 2000;168:511–518. doi: 10.1046/j.1365-201x.2000.00703.x. [DOI] [PubMed] [Google Scholar]
- Segal SS, Duling BR. Communication between feed arteries and microvessels in hamster striated muscle: segmental vascular responses are functionally coordinated. Circ Res. 1986;59:283–290. doi: 10.1161/01.res.59.3.283. [DOI] [PubMed] [Google Scholar]
- Si ML, Lee TJ. α7-Nicotinic acetylcholine receptors on cerebral perivascular sympathetic nerves mediate choline-induced nitrergic neurogenic vasodilation. Circ Res. 2002;91:62–69. doi: 10.1161/01.res.0000024417.79275.23. [DOI] [PubMed] [Google Scholar]
- Slish DF, Welsh DG, Brayden JE. Diacylglycerol and protein kinase C activate cation channels involved in myogenic tone. Am J Physiol Heart Circ Physiol. 2002;283:H2196–H2201. doi: 10.1152/ajpheart.00605.2002. [DOI] [PubMed] [Google Scholar]
- Smith JS, Imagawa T, Ma J, Fill M, Campbell KP, Coronado R. Purified ryanodine receptor from rabbit skeletal muscle is the calcium-release channel of sarcoplasmic reticulum. J Gen Physiol. 1988;92:1–26. doi: 10.1085/jgp.92.1.1. [DOI] [PMC free article] [PubMed] [Google Scholar]
- Smith PD, Brett SE, Luykenaar KD, Sandow SL, Marrelli SP, Vigmond EJ, Welsh DG. KIR channels function as electrical amplifiers in rat vascular smooth muscle. J Physiol. 2008;586:1147–1160. doi: 10.1113/jphysiol.2007.145474. [DOI] [PMC free article] [PubMed] [Google Scholar]
- Stuyvers BD, Dun W, Matkovich S, Sorrentino V, Boyden PA, ter Keurs HE. Ca2+ sparks and waves in canine purkinje cells: a triple layered system of Ca2+ activation. Circ Res. 2005;97:35–43. doi: 10.1161/01.RES.0000173375.26489.fe. [DOI] [PMC free article] [PubMed] [Google Scholar]
- Sward K, Dreja K, Susnjar M, Hellstrand P, Hartshorne DJ, Walsh MP. Inhibition of Rho-associated kinase blocks agonist-induced Ca2+ sensitization of myosin phosphorylation and force in guinea-pig ileum. J Physiol. 2000;522:33–49. doi: 10.1111/j.1469-7793.2000.0033m.x. [DOI] [PMC free article] [PubMed] [Google Scholar]
- Takeya K, Loutzenhiser K, Shiraishi M, Loutzenhiser R, Walsh MP. A highly sensitive technique to measure myosin regulatory light chain phosphorylation: the first quantification in renal arterioles. Am J Physiol Renal Physiol. 2008;294:F1487–F1492. doi: 10.1152/ajprenal.00060.2008. [DOI] [PubMed] [Google Scholar]
- Walsh MP, Kargacin GJ, Kendrick-Jones J, Lincoln TM. Intracellular mechanisms involved in the regulation of vascular smooth muscle tone. Can J Physiol Pharmacol. 1995;73:565–573. doi: 10.1139/y95-072. [DOI] [PubMed] [Google Scholar]
- Welsh DG, Morielli AD, Nelson MT, Brayden JE. Transient receptor potential channels regulate myogenic tone of resistance arteries. Circ Res. 2002;90:248–250. doi: 10.1161/hh0302.105662. [DOI] [PubMed] [Google Scholar]
- Welsh DG, Nelson MT, Eckman DM, Brayden JE. Swelling-activated cation channels mediate depolarization of rat cerebrovascular smooth muscle by hyposmolarity and intravascular pressure. J Physiol. 2000;527:139–148. doi: 10.1111/j.1469-7793.2000.t01-1-00139.x. [DOI] [PMC free article] [PubMed] [Google Scholar]
- Wilson DP, Susnjar M, Kiss E, Sutherland C, Walsh MP. Thromboxane A2-induced contraction of rat caudal arterial smooth muscle involves activation of Ca2+ entry and Ca2+ sensitization: Rho-associated kinase-mediated phosphorylation of MYPT1 at Thr-855, but not Thr-697. Biochem J. 2005;389:763–774. doi: 10.1042/BJ20050237. [DOI] [PMC free article] [PubMed] [Google Scholar]
- Wooldridge AA, MacDonald JA, Erdodi F, Ma C, Borman MA, Hartshorne DJ, Haystead TA. Smooth muscle phosphatase is regulated in vivo by exclusion of phosphorylation of threonine 696 of MYPT1 by phosphorylation of Serine 695 in response to cyclic nucleotides. J Biol Chem. 2004;279:34496–34504. doi: 10.1074/jbc.M405957200. [DOI] [PubMed] [Google Scholar]
- Yang Y, Murphy TV, Ella SR, Grayson TH, Haddock R, Hwang YT. Heterogeneity in function of small artery smooth muscle BKCa: involvement of the β1-subunit. J Physiol. 2009;587:3025–3044. doi: 10.1113/jphysiol.2009.169920. [DOI] [PMC free article] [PubMed] [Google Scholar]
- Zacharia J, Zhang J, Wier WG. Ca2+ signaling in mouse mesenteric small arteries: myogenic tone and adrenergic vasoconstriction. Am J Physiol Heart Circ Physiol. 2007;292:H1523–H1532. doi: 10.1152/ajpheart.00670.2006. [DOI] [PubMed] [Google Scholar]
- Zhao J, Majewski H. Endothelial nitric oxide attenuates Na+/Ca2+ exchanger-mediated vasoconstriction in rat aorta. Br J Pharmacol. 2008;154:982–990. doi: 10.1038/bjp.2008.178. [DOI] [PMC free article] [PubMed] [Google Scholar]
Associated Data
This section collects any data citations, data availability statements, or supplementary materials included in this article.