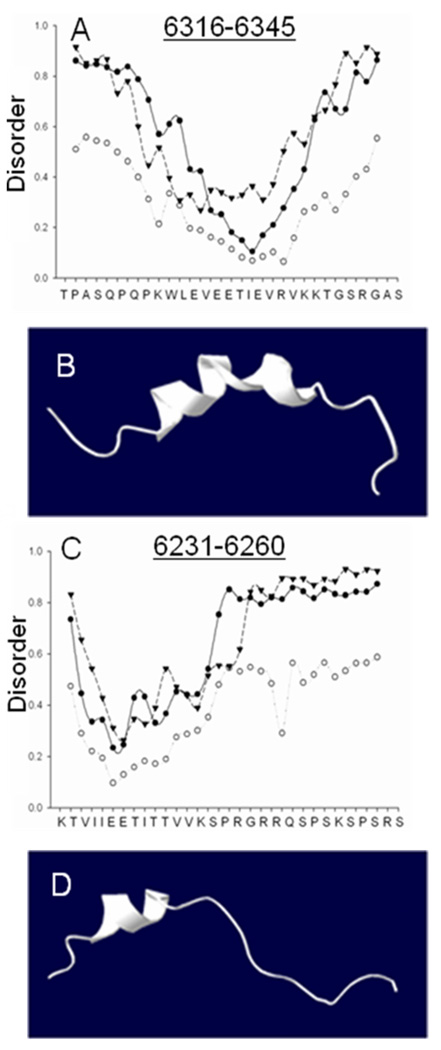
Fig. 7. Disorder plots and structural models of Obsc6231–6260 and Obsc6316–6345.
(A, C) Disorder plots: circles represent the predicted mobility of α-carbons in the oligopeptide sequences of obscurin at 1000 K; triangles represent regions for which similar short oligopeptide sequences have never been experimentally solved; closed circles represent predicted random coiled domains, a necessary but not sufficient condition for disorder. (B, D) Homology model for Obsc6316–6345 (based on RelA) and a representation of Obsc6231–6260, based on relative alpha helicity and overall similarity to known ankyrin binding motifs such as CDK4, both in good agreement with CD data (Fig. 6) disorder plots (this figure) and secondary structure prediction algorithms (not shown).

