

Abstract
Mutations in DJ-1, PINK1 (PTEN-induced putative kinase 1) and parkin all cause recessive parkinsonism in humans, but the relationships between these genes are not clearly defined. One event associated with loss of any of these genes is altered mitochondrial function. Recent evidence suggests that turnover of damaged mitochondria by autophagy might be central to the process of recessive parkinsonism. Here, we show that loss of DJ-1 leads to loss of mitochondrial polarization, fragmentation of mitochondria and accumulation of markers of autophagy (LC3 punctae and lipidation) around mitochondria in human dopaminergic cells. These effects are due to endogenous oxidative stress, as antioxidants will reverse all of them. Similar to PINK1 and parkin, DJ-1 also limits mitochondrial fragmentation in response to the mitochondrial toxin rotenone. Furthermore, overexpressed parkin will protect against loss of DJ-1 and, although DJ-1 does not alter PINK1 mitochondrial phenotypes, DJ-1 is still active against rotenone-induced damage in the absence of PINK1. None of the three proteins complex together using size exclusion chromatography. These data suggest that DJ-1 works in parallel to the PINK1/parkin pathway to maintain mitochondrial function in the presence of an oxidative environment.
INTRODUCTION
Although the mechanism of neurodegeneration in Parkinson's disease (PD) is not well understood, mitochondria have been proposed to play a role in the disorder. For example, toxins 1-methyl-4-phenyl-1,2,3,6-tetrahydropyridine (MPTP) and rotenone, which target complex I of mitochondria, can recapitulate the nigral dopamine neuron loss characteristic of PD (1).
A genetic component of PD is increasingly recognized (2). Three genes parkin, DJ-1 and PINK1(PTEN-induced putative kinase 1) cause early-onset recessive parkinsonism and all three proteins associate with mitochondria, at least in some circumstances. PINK1 is a mitochondrial serine/threonine kinase the kinase domain of which faces the cytoplasm on the outer mitochondrial membrane (3). Parkin is an E3 ubiquitin ligase that is recruited to mitochondria after loss of polarization of the mitochondrial membrane (4). DJ-1 is relocalized to mitochondria under conditions of oxidative stress (5). All three genes also functionally impact mitochondria. PINK1 (6,7), DJ-1 (5,8–10) and parkin (11,12) influence the sensitivity of dopamine neurons to toxins such as rotenone or MPTP. Loss of dopaminergic neurons does not occur in knockout mice, but there is evidence of altered mitochondrial function (13,14).
As well as this convergent impact on organelle function, PINK1 and parkin are in the same genetic pathway. Parkin- and PINK1-deficient flies have similar mitochondrial phenotypes and although parkin overexpression can rescue PINK1 deficiency, the reverse is not true, indicating that PINK1 is genetically upstream of parkin (15–18). Studies in mammalian cells confirm that PINK1 acts upstream of parkin (19). PINK1 is required for the recruitment of parkin to depolarize mitochondria prior to selective clearance of the functionally inactive organelles by autophagy (20–23). DJ-1 cannot rescue phenotypes resulting from lack of PINK1 or parkin (16,19), suggesting that DJ-1 works upstream of PINK1/parkin or in an independent pathway but the exact relationship has not been resolved.
Here, we have explored the mitochondrial phenotypes of human neuroblastoma cell lines deficient in DJ-1. We find that although loss of either DJ-1 or PINK1 produces similar phenotypes in cells, the three genes likely work in independent parallel pathways.
RESULTS
Multiple mitochondrial phenotypes are found in DJ-1-deficient cells
M17 human dopaminergic neuroblastoma cell lines stably expressing short hairpin RNA (shRNA) against DJ-1 (24) and nonsense shRNA controls selected and cloned in parallel were used to characterize the effects of loss of DJ-1 on mitochondrial function. After confirming DJ-1 protein was lowered (Fig. 1A), we used two different experimental approaches to estimate mitochondrial membrane potential (Δψm) in a clone that we confirmed had lower DJ-1 protein (Fig. 1A). Using flow cytometry, the proportion of cells with low tetramethylrhodamine ethyl ester (TMRE) staining was greater in DJ-1-deficient cells than in controls (Fig. 1B). This was confirmed using live cell confocal microscopy, revealing that DJ-1-deficient cells had lower TMRE staining in mitochondria than control cells (Fig. 1C and D). Collectively, these results show that loss of DJ-1 results in lower Δψm.
Figure 1.

Loss of DJ-1 results in multiple mitochondrial abnormalities. (A) M17 human dopaminergic neuroblastoma cells were stably transduced with control shRNA (lane 1) or DJ-1 shRNA (lane 2) and cell lysates blotted for DJ-1 (arrow). Markers on the right of the blot are in kilodaltons. (B) Δψm estimated in living cells using flow cytometry. Control cells (upper panel) or DJ-1 shRNA (lower panel) cell lines were stained with TMRE (x-axis) and DAPI for nuclei (y-axis). Flow cytometry was performed, and intensity of each signal for 10 000 cells was plotted and proportions of cells in each quadrant were calculated. (C) Δψm was estimated using live cell confocal imaging. After staining for TMRE, live cells were imaged and fluorescence pseudocolored to show differences in intensity. (D) Quantification of fluorescence in arbitrary units (a.u.) shows that DJ-1-deficient cells have significantly lower TMRE signal (P < 0.001 by t-test with Welsh's correction for unequal variances, n = 43–50 measurements per line). (E) Mitochondrial morphology was imaged in living cells transfected with mito-YFP plasmid. Mitochondria were elongated in control shRNA cells (upper panels) and at higher power (inset and right) showed a connected morphology. In DJ-1-deficient cells (lower panels), there were many small, disconnected mito-YFP-positive structures (inset and right). Scale bar is 2 μm. (F) Recovery of fluorescence was measured over a 12 s period after photobleaching a small region of mitochondria. Fluorescence recovery over time is plotted after normalization to both background fluorescence and non-photobleached mitochondrial fluorescence for 30 cells, showing decreased recovery of DJ-1-deficient cells (red symbols) compared with control lines (black symbols). Error bars show the SEM. (G) Mobile fraction of mito-YFP was lower in DJ-1-deficient mitochondria compared with controls. DJ-1-deficient cells had significantly lower FRAP for mito-YFP (P < 0.05 by t-test, n = 60 cells from duplicate experiments). (H) Control shRNA cells (upper panels) or DJ-1 shRNA cells (lower panels) either without treatment (left panels) or after treatment with 10 μm CCCP for 3 h (right panels) were transfected with LC3-GFP (green) and stained for the mitochondrial marker TOM20 (red). Arrows show the accumulation of LC3-GFP-positive punctatae near mitochondria in the cells. Scale bar is 10 μm. (I) Counts of LC3-GFP-positive punctatae per cell in n > 50 cells in three independent experiments showing the proportion of cells with less than 6 (open bars), between 6 and 15 (stippled bars), between 16 and 30 (striped bars) or more than 30 (filled bars) punctatae per cell, with error bars showing the SEM between experiments. Proportions of cells in each category were different by χ2-test comparing control and DJ-1 shRNA cells in each condition, untreated or with CCCP; ***P < 0.001; ns, not significant.
Decrease in Δψm can result in changes in mitochondrial morphology. Using live cell confocal microscopy of yellow fluorescent protein (YFP)-labeled mitochondria, DJ-1-deficient cells had subtle morphological differences with an accumulation of fragmented mitochondria (Fig. 1E). To investigate this phenomenon, we used fluorescence recovery after photobleaching (FRAP), to quantify mitochondrial connectivity (Fig. 1F). Summarizing the FRAP curves by calculating the mobile fraction of mitochondrially directed YFP (mito-YFP) demonstrates that mitochondria in DJ-1-deficient cell lines have significantly lower functional connectivity (Fig. 1G), which is similar to observations of PINK1-deficient cells (7).
Previous studies have shown that stable knockdown of PINK1 also results in mitochondrial defects (7,19,25) and the accumulation of markers of autophagy (25), a process by which depolarized mitochondria are selectively removed from the cell (26). MAP-LC3 (microtubule-associated protein 1 light chain 3, denoted as LC3 in the remainder of the text) is a major constituent of the autophagosome, which sequesters the target for degradation by fusing with lysosomes. To date, LC3 is the only reliable marker of autophagosomes. We used accumulation of LC3-GFP as a marker of autophagy and found that DJ-1-deficient cells had higher numbers of LC3-GFP-positive punctatae than controls, which were often near or adjacent to mitochondria (Fig. 1H and I). Fully depolarizing mitochondria with carbonyl cyanide 3-chlorophenylhydrazone (CCCP) caused further increase in the number of LC3-GFP-positive structures to a similar extent in both control and DJ-1-deficient cell lines (Fig. 1H and I), suggesting that the accumulation of this autophagic marker is a consequence of loss of Δψm.
To be certain that these phenotypes were due to loss of DJ-1, we performed a series of control experiments. First, we confirmed that the phenotypes of lower connectivity, Δψm, and accumulation of markers of autophagy were seen in an independent DJ-1 shRNA clone (Supplementary Material, Fig. S1). Second, expressing mouse DJ-1, which is highly conserved but resistant to the human DJ-1 shRNA, reversed both the FRAP defects and accumulation of autophagic markers (Fig. 2). Finally, mouse embryonic fibroblast (MEF) lines from wild-type and DJ-1-/- animals also had lower Δψm and decreased mito-YFP FRAP (Figs 4 and 7B). Collectively, these results demonstrate that DJ-1 deficiency is associated with mitochondrial dysfunction in two independently generated cell models.
Figure 2.

Mouse DJ-1 rescues effects of human DJ-1 deficiency. (A) Control (lanes 1–6) or DJ-1-deficient cells (lanes 7–12) were either untransfected (lanes 1–3 and 7–9) or transfected with HA-tagged mouse DJ-1 (lanes 4–6 and 10–12). Protein extracts blotted with antibodies to HA for the tagged mouse DJ-1 construct (filled arrowhead, upper panel) endogenous human DJ-1 (arrow, middle panel) and β-actin as a loading control (open arrowhead, lower panel). Because mouse DJ-1 has a different cDNA sequence from human DJ-1, the construct is resistant to the shRNA. Markers on the right of the blots are in kilodaltons. (B) FRAP for mito-YFP was used to measure mitochondrial connectivity in control shRNA (white) or DJ-1 shRNA lines (red) alone or after transfection with mouse DJ-1 (striped bars). Each bar shows the mean mobile fraction from n = 60 individual cells measured over two independent experiments and error bars indicate the SEM. Statistical significance was calculated using one-way ANOVA with Newman–Keuls post hoc test; *P < 0.05; **P < 0.01; ns, not significant. (C) Autophagy was monitored using LC3-GFP transfection, counting the proportion of cells with varying numbers of LC3 punctatae per cell as indicated in the legend and comparing control and DJ-1-deficient cells with or without mouse DJ-1 transfection. Each bar is the counts from n = 50 cells from two to four experiments per cell line and the error bars indicate SEM between experiments.
Figure 4.

Endogenous oxidative stress contributes to mitochondrial phenotypes in DJ-1-deficient MEFs. (A) ROS were measured in living cells using the fluorescent dye DFFDA. Under basal conditions, DJ-1 knockout MEFs (red boxes) had higher DFFDA signals than wild-type lines (black boxes). DFFDA signals were lower, and differences between the lines were not seen when the cells were pretreated for 24 h with 100 μm GSH-EE prior to imaging. Two-way ANOVA was used to compare cell lines and treatments as separate factors and then Bonferroni post hoc tests were used to compare cell lines for each treatment; ***P < 0.001; ns, not significant. (B) TMRE and DAPI were used to estimate mitochondrial membrane potential and nuclear integrity in knockout MEFs (lower panels). Treatment with GSH-EE (right pair of panels) increased the proportion of DJ-1 knockout MEFs with higher TMRE staining compared with controls. (C) Cells were treated with GSH-EE and mitochondrial membrane potential imaged using TMRE. DJ-1 knockout cells (red) bars had lower TMRE signals compared with wild-type lines (open bars) and this difference was diminished after treatment with GSH-EE. Two-way ANOVA was used to compare cell lines and treatments as separate factors and then Bonferroni post hoc tests were used to compare cell lines for each treatment; ***P < 0.001; ns, not significant.
Figure 7.
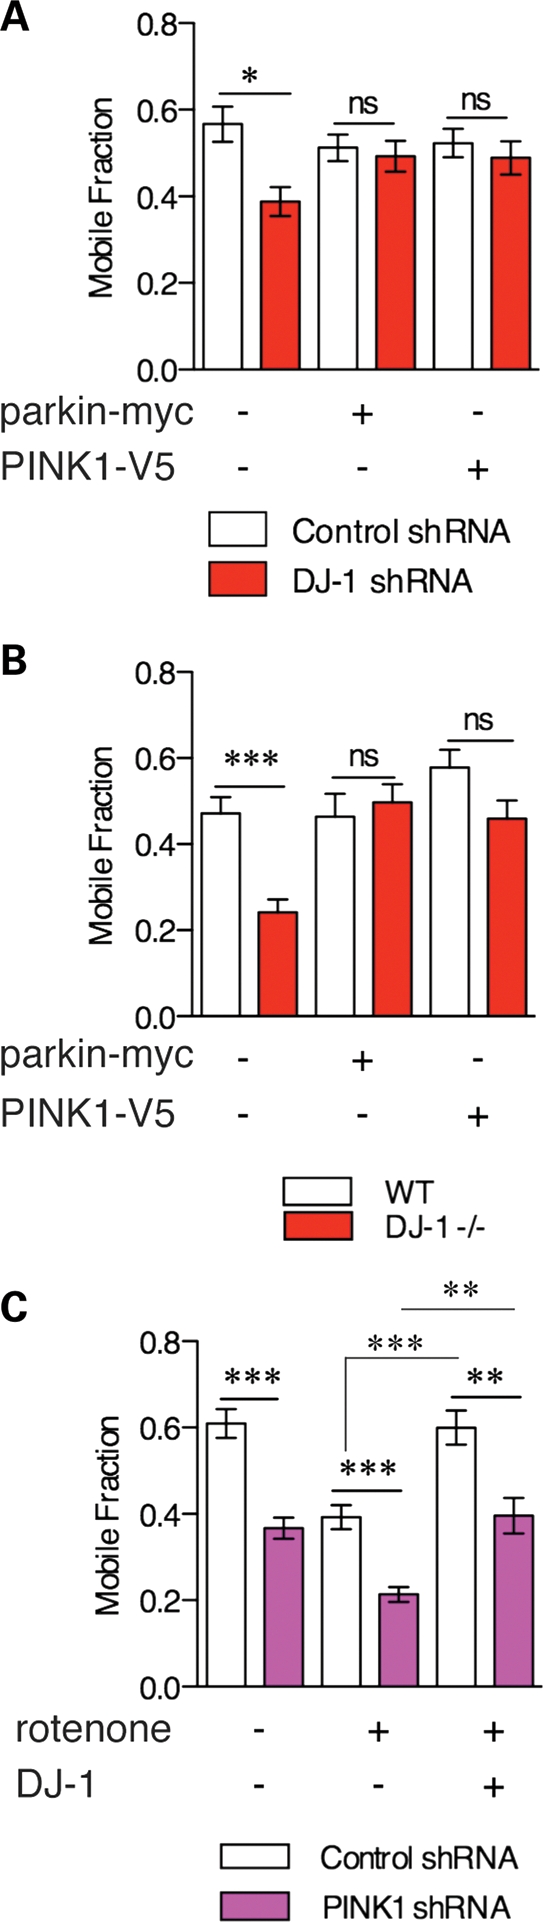
The PINK1/parkin pathway rescues mitochondrial defects in DJ-1-deficient cells. (A) Mobile fraction from FRAP experiments shows rescue of loss of mitochondrial connectivity by parkin or PINK1 in DJ-1-deficient cells (red bars) or control shRNA cells (open bars). Statistical significance was calculated using one-way ANOVA with Newman–Keuls post hoc test; *P < 0.05, n = 30 cells per condition, representative of duplicate experiments. (B) Similar experiment in DJ-1 wild-type (open bars) or knockout (red bars) MEFs. Statistical significance was calculated using one-way ANOVA with Newman–Keuls post hoc test; ***P < 0.001, n = 30 cells per condition, representative of duplicate experiment. (C) Control (open bars) or PINK1-deficient (purple bars) M17 cells were transfected with DJ-1 and treated with 100 nm rotenone for 24 h as indicated. Statistical significance was calculated using one-way ANOVA with Newman–Keuls post hoc test; ***P < 0.001; **P < 0.01, n = 30 cells per condition, representative of duplicate experiments.
Oxidative stress contributes to altered mitochondria in DJ-1-deficient cells
DJ-1-deficient cells have increased levels of oxidative stress (27–29). DJ-1 binds RNA for glutathione metabolism genes (24) and glutathione status is influenced by DJ-1 expression (30). Therefore, we examined the role of oxidative stress in this model, specifically focusing on glutathione. We confirmed that DJ-1-deficient cells showed increased oxidative stress using DFFDA (5-(and-6)-carboxy-2′,7′-difluorodihydrofluorescein diacetate) fluorescence which could be rescued by glutathione ethyl ester (GSH-EE; Fig. 3A), a cell-permeable precursor of glutathione. We next addressed whether GSH-EE would recover the mitochondrial phenotypes seen in the same cells. Using both flow cytometry (Fig. 3B) and live cell imaging (Fig. 3C) of TMRE staining, GSH-EE fully recovered the Δψm in DJ-1-deficient cells to the level measured in control cells. Additionally, adding GSH-EE improved mitochondrial morphology (Fig. 3D) and increased mobile fraction in FRAP experiments (Fig. 3E) in DJ-1-deficient cells but had no effect in control cell lines. Finally, the increased LC3 punctae in DJ-1 shRNA lines were also reversed by the addition of GSH-EE (Fig. 3F). The enhanced oxidative stress (Fig. 4A) and rescue of TMRE staining were confirmed in DJ-1-/- MEF lines (Fig. 4B and C). Together, these data suggest that endogenous oxidative stress induced by lack of DJ-1 accounts for mitochondrial phenotypes.
Figure 3.

Endogenous oxidative stress contributes to mitochondrial phenotypes in DJ-1-deficient M17 human neuroblastoma cells. (A) ROS were measured in living cells using the fluorescent dye DFFDA. Under basal conditions, DJ-1-deficient cells (red boxes) had higher DFFDA signal than control lines (black boxes). DFFDA signals were lower, and differences between the lines were not seen when the cells were pretreated for 24 h with 100 μm GSH-EE prior to imaging. Two-way ANOVA was used to compare cell lines and treatments as separate factors and then Bonferroni post hoc tests were used to compare cell lines for each treatment; ***P < 0.001; ns, not significant. (B) TMRE and DAPI were used to estimate Δψm and nuclear integrity, respectively, and measured using flow cytometry. Controls (upper panels) had higher TMRE staining than DJ-1-deficient cells (lower panels). Treatment with GSH-EE (right pair of panels) increased the proportion of DJ-1-deficient cells with higher TMRE staining. (C) Cells were treated with GSH-EE and Δψm estimated by imaging of live cells using TMRE. DJ-1 shRNA lines (red) bars had lower TMRE signals compared with control lines (open bars) and this difference was diminished after treatment with GSH-EE. Two-way ANOVA was used to compare cell lines and treatments as separate factors and then Bonferroni post hoc tests were used to compare cell lines for each treatment; ***P < 0.001; ns, not significant. (D) Mitochondrial morphology in controls (upper panels) or DJ-1-deficient cells (lower panels) was imaged after transfection with plasmids encoding mitochondrially targeted YFP. Addition of GSH-EE caused a change in the morphology of mitochondria in DJ-1-deficient cells toward a more elongated, connected phenotype. Scale bar is 2 μm. (E) Quantitation of mitochondrial connectivity using FRAP shows a recovery of signal in the DJ-1-deficient cells (red boxes) after treatment with the glutathione precursor. Statistical significance was calculated using two-way ANOVA with Bonferroni post hoc tests to compare cell lines; ***P < 0.001; ns, not significant (n = 60 cells per condition from duplicate experiments). (F) Counts of LC3-GFP-positive punctatae as a marker of autophagy show that the difference between controls and DJ-1 shRNA lines is diminished after GSH-EE treatment. ***P < 0.001; ns, not significant by χ2-test, n = 3 experiments with >50 cells counted per experiment.
Loss of DJ-1 causes a deficit in mitochondrial fusion
We were interested to understand whether loss of DJ-1 was related to mitochondrial dynamics, which are reported to be sensitive to oxidative stress. We used mitochondrially directed photoactivatable green fluorescent protein (GFP) to monitor fusion rates, which are proportional to loss of signal over time (Fig. 5A). Quantification showed that DJ-1-deficient cells had lower mitochondrial fusion (Fig. 5B). This predicts that increasing rates of fusion or limiting fission should reverse mitochondrial phenotypes in the DJ-1-deficient cells. We overexpressed the fusion proteins Opa1 and Mfn1 or a dominant negative mutant of the fission GTPase Drp1 (Drp1 K38A) in control or DJ-1-deficient cells and confirmed expression by western blots (Supplementary Material, Fig. S3A). These constructs, especially Drp1 K38A, resulted in mitochondrial fusion (Fig. 5C). Either increasing fusion or blocking fission reversed the loss of mitochondrial connectivity in DJ-1-deficient cells (Fig. 5D). These results suggest that the observed lack of mitochondrial fusion underlies the morphological phenotypes in DJ-1-deficient cells. We also found that DJ-1-deficient cells had lower phosphorylated Drp1 (Supplementary Material, Fig. S3B and C), and therefore may have an increased tendency for mitochondrial fission as Drp1 is known to be regulated by phosphorylation (7,31,32).
Figure 5.

DJ-1-deficient cells have a defect in mitochondrial fusion. (A) Control shRNA (upper panels) or DJ-1 shRNA (lower panels) cells were transfected with a mitochondrially directed, photoactivatable GFP which was then photoactivated within a small region of interest. Sequential images of the single cells (0, 15, 30, 45 and 60 min as indicated above the images) after photoactivation are shown. Note that the fluorescence intensity is equal across the cell in the control line in the upper panel by 30 min, whereas the DJ-1-deficient cell retains areas of higher intensity. Scale bar is 5 μm. (B) Quantification of experiments as in (A) (three experiments, with n = 9–10 cells measured per time point per experiment; error bars indicate SEM) shows the loss of fluorescence over time for control cells (black) and DJ-1 shRNA (red) cell lines. The difference between cell lines was significant by two-way ANOVA (***P < 0.001). (C) Mito-YFP plasmid was co-transfected into DJ-1 and control shRNA cell lines with plasmids containing Opa1, Mfn1 or myc-tagged K38A Drp1. Scale bar is 2 μm. (D) Co-transfecting fusion proteins resulted in rescue of DJ-1 shRNA mitochondrial connectivity back to control levels and a dominant negative Drp1 K38A resulted in mobile fraction values higher than basal control cells. Statistical significance (n = 60 cells from duplicate experiments) was calculated using one-way ANOVA with Newman–Kuels post hoc test; ***P < 0.001.
Previous work has shown that mitochondrial dynamics can influence the autophagic pathway and catabolism of mitochondria (33), so we examined whether fusion defects affected autophagy markers in the same cells. Expression of Drp1 K38A in control cells produced an increase in the number of LC3-GFP-positive structures per cell. However, the opposite effect was seen in DJ-1-deficient cells (Supplementary Material, Fig. S4). These results suggest that some of the effects seen with markers of autophagy may be downstream of alterations in fusion.
We also examined whether autophagy might contribute to the loss of mitochondrial connectivity in these cells. We exposed cells to the bafilomycin A1, which inhibits vacuolar H+-ATPase and thus blocks lysosomal acidification and prevents removal of autophagosomes by fusion with lysosomes. We counted LC3-GFP punctatae, which increased as expected when degradation of autophagosomes was blocked (Supplementary Material, Fig. S5A and B). The same treatment decreased mobile fraction values for mito-YFP (Supplementary Material, Fig. S5C). Therefore, mitochondrial turnover by autophagy is required to maintain mitochondrial connectivity.
To further examine the progression of autophagy (autophagic flux), we monitored the conversion of LC3-I to LC3-II by immunoblotting for LC3. The amount of LC3-II correlates with the number of autophagosomes, and the characteristic conversion of LC3 can be used to examine autophagic activity in the presence or absence of lysosomal activity (34). To verify the increase in LC3-GFP-positive punctatae that was observed with the loss of DJ-1, we transiently transfected LC3-GFP in control and DJ-1 shRNA cells and immunoblotted for LC3. In comparison to the control shRNA cells, DJ-1 silencing promotes more LC3 lipidation under basal and CCCP conditions (Supplementary Material, Fig. S2A) which is indicative of increased autophagy (34). It was determined that lysosomal inhibition increased the number of LC3 punctatae (Supplementary Material, Fig. S5A and B) and LC3-II protein (Supplementary Material, Fig. S2B), which shows efficient autophagy in control cells. Moreover, the amount of LC3-II protein increased in the presence of bafilomycin in DJ-1-deficient cells (Supplementary Material, Fig. S2B) which also suggests an increase in autophagy.
DJ-1, PINK1 and parkin protect against oxidant-induced mitochondrial fragmentation
The above results show that endogenous DJ-1 provides protection against oxidative stress and that one of the outputs of loss of DJ-1 is impaired mitochondrial function. To test this further, we increased DJ-1 expression by transient transfection and then exposed cells to oxidative stress by adding rotenone to the cells. Rotenone caused loss of Δψm as estimated by TMRE staining (Supplementary Material, Fig. S6A). We also found that this loss of Δψm was associated with increased numbers of LC3-GFP-positive punctatae in cells, again near mitochondria, as was seen for CCCP (Supplementary Material, Fig. S6B and C). These results show that rotenone produces loss of Δψm and activates the autophagy machinery.
Exposure to rotenone resulted in shortened, disconnected mitochondria but this was minimized if DJ-1 was added (Fig. 6A). FRAP of mito-YFP showed decreased mitochondrial connectivity in cells with vector alone after rotenone exposure but no loss of FRAP signal after rotenone exposure in cells overexpressing DJ-1 (Fig. 6B and C). These results confirm the ability of DJ-1 to protect against oxidative damage.
Figure 6.

DJ-1, PINK1 and parkin each protect against mitochondrial fragmentation induced by mitochondrial complex I inhibition. (A) M17 cells were transfected with mito-YFP without (left panels) or with (right panels) wild-type human DJ-1. Cells were either left untreated (upper panels) or exposed to 100 nm rotenone for 24 h (lower panels) and mitochondria imaged. For each image, high-power views of mitochondria are shown on the right. Rotenone induces mitochondrial fragmentation that is prevented by co-expression of DJ-1. (B) To quantify this, we measured recovery of fluorescence over time for vector (black) or DJ-1 transfected (red) cells either in the absence (open symbols) or presence (closed symbols) of rotenone. Each data point is the average of 60 cells from two replicate experiments and error bars indicate the SEM. (C) Mobile fraction values were calculated from each cell and averages plotted (error bars indicate SEM) for vector and DJ-1 expressing cells in the absence (open bars) or presence (filled bars) of rotenone. Two-way ANOVA was used to compare cell lines and treatments as separate factors and then Bonferroni post hoc tests were used to compare cell lines for each treatment; ***P < 0.001; ns, not significant. Experiment similar to (C) using transient transfection with wild-type human PINK1 (D) or wild-type human parkin (E) in the absence (open bars) or presence (filled bars) of rotenone. Statistical tests were as above; ***P < 0.001; ns, not significant.
We have previously reported that stable expression of PINK1 in human cells also protects against loss of FRAP signal after exposure to rotenone and that loss of endogenous PINK1 has the opposite effect (7). We confirmed the same effect in a transiently overexpressed PINK1 system. Transient transfection of human wild-type PINK1 did indeed limit mitochondrial fragmentation after exposure to rotenone (Fig. 6D) and, furthermore, parkin shared this ability (Fig. 6E). These results confirm that DJ-1 (35) and PINK1 (7) protect mitochondria against rotenone-induced fragmentation and extend this to all three known genes for autosomal-recessive parkinsonism.
Given the shared and similar effects of DJ-1, PINK1 and parkin, we evaluated the relationships between their respective contributions to mitochondrial protection. We transiently transfected control or DJ-1-deficient M17 cells with myc-tagged parkin or V5-tagged PINK1. DJ-1-deficient cells had lower mitochondrial connectivity, but increased expression of PINK1 or parkin was able to fully rescue this phenotype (Fig. 7A). We confirmed these results in DJ-1-/- MEF lines (Fig. 7B), showing that in two independent contexts, the pink1/parkin pathway can protect against DJ-1 deficiency.
This places PINK1/parkin either downstream of DJ-1 or in a parallel pathway. We next examined PINK1-deficient cells that, as previously demonstrated (7), have lower mitochondrial connectivity (Fig. 7C). Mitochondrial connectivity was further decreased after exposure to rotenone but rescued by DJ-1 in either control or PINK1-deficient cells. This shows that DJ-1 is active against rotenone-induced damage irrespective of PINK1 expression. Therefore, DJ-1 is not upstream of PINK1/parkin but works in parallel to this pathway.
It has been suggested that DJ-1, PINK1 and parkin form a complex with E3 ligase activity (36). We used size exclusion chromatography to distinguish native complexes of endogenous DJ-1 with overexpressed PINK1 and YFP-tagged parkin. Under these conditions, PINK1, YFP-parkin and DJ-1 were separated into distinct complexes (Fig. 8A and C). The peak of DJ-1 was similar to the molecular weight of a dimer (45–50 kDa) as previously reported (37) irrespective of whether PINK1 and parkin were co-expressed or not. Parkin was found in a peak of ∼110 kDa, similar to results reported elsewhere (38). PINK1 was found in a much higher molecular weight complex distinct from parkin or DJ-1. As mitochondrial depolarization promotes parkin relocalization to mitochondria (4,20–22), we repeated these experiments in the presence of CCCP. We confirmed by microscopy that YFP-parkin relocalized to mitochondria in these cell lines in the same experiments, prior to extracting proteins for size exclusion chromatography (data not shown). The three proteins retained their distinct migration patterns and remained separated (Fig. 8B and D), suggesting that the similar effects of DJ-1, PINK1 and parkin are not mediated through a co-complex.
Figure 8.

Lack of formation of co-complexes of DJ-1 and PINK1/parkin. (A and B) Size exclusion chromatography was performed on cell lysates from M17 lines stably transduced with V5-tagged PINK1 and transfected with myc-parkin either without (A) or after treatment with CCCP (B). Fractions (0.25 ml) were taken and run on SDS–PAGE gels then blotted for V5 for PINK1 (upper blots), myc-parkin (middle blots) or DJ-1 (lower blots). Markers on the right indicate sizes on SDS–PAGE in kilodaltons. (C and D) Quantification of proteins in distinct native complexes for blots as in (A) and (B) for the preprotein of PINK1 (purple), the mature PINK1 protein (green), parkin (blue) or DJ-1 (black). For each protein, the immunoreactivity in each fraction is plotted as a percentage of the total protein immunoreactivity in all fractions against fraction number. Error bars indicate SEM from n = 3 experiments from independent transfections on different occasions.
DISCUSSION
We have shown that lack of the recessive parkinsonism protein DJ-1 causes several defects in mitochondria related to oxidative stress. Specifically, mitochondria in DJ-1-deficient cells are depolarized and have an increased tendency to fragment, which agrees with other studies (39,40). Furthermore, we defined a common phenotype and relationship between DJ-1 and two other genes for recessive parkinsonism, PINK1 and parkin.
Numerous reports demonstrate that the lack of DJ-1 increases sensitivity to reactive oxygen species (ROS) and mitochondrial complex I inhibitors (5,9,41). In response to oxidative stress, DJ-1 can upregulate glutathione synthesis (30), which may be related to the ability of DJ-1 to interact with mRNA transcripts related to glutathione metabolism (24). Supporting the concept that ROS metabolism is important in mediating loss of DJ-1 phenotypes, increasing intracellular glutathione fully rescued the mitochondrial phenotypes. We have previously shown that the ability of DJ-1 protein to respond to oxidative stress is critical for maintenance of mitochondrial morphology (35). These results suggest that DJ-1 influences mitochondrial function and morphology through an oxidative stress pathway.
The two principal mitochondrial phenotypes seen in these DJ-1-deficient cells, namely loss of membrane potential and an increased tendency to fragment, are similar to observations made for PINK1 knockdown (7,25,42). For both PINK1 and DJ-1, the morphological effects can be rescued by blocking mitochondrial fission. However, the fusion effects may be secondary to other mechanisms. For example, in PINK1-deficient cells, calcineurin inhibitors can block the tendency for mitochondrial fragmentation, whereas loss of Δψm cannot (7), and thus fragmentation is a secondary event.
In a previous report in mammalian cells, PINK1 deficiency triggers increased fragmentation of mitochondria, which can be rescued by parkin but not by DJ-1 (19). Because parkin also rescues the DJ-1 deficiency phenotype in this study, we might conclude that DJ-1 is upstream of PINK1/parkin. However, because we see that DJ-1 is still active at preventing loss of mitochondrial connectivity induced by rotenone in the absence of PINK1, we suggest instead that DJ-1 and PINK1/parkin are parallel pathways. We do not find evidence for a native co-complex of the three proteins (36), which indirectly supports a parallel relationship.
DJ-1 now shares an additional similarity to PINK1 and parkin, an association with autophagy. Autophagy has been extensively addressed in the field of recessive parkinsonism. Reductions in mitochondrial membrane potential initiate parkin-mediated autophagy (4,25), which is inhibited in PINK1-deficient cells (21,22,43,44). However, our study does not find a complex, whereby PINK1 and parkin physically interact before or after mitochondrial depolarization despite other reports showing such evidence (45).
The association of DJ-1 with autophagy is varied. DJ-1 silencing has resulted in the upregulation (39,46,47) and downregulation (40,48) of autophagy. Our results suggest that the loss of DJ-1 promotes an increase in autophagy, as an increase in LC3-GFP-positive punctatae and LC3-II protein levels are seen. These data indicate that DJ-1 function may either contribute to the regulation of autophagy or mitigate the downstream effects of ROS, as studies have shown that ROS can upregulate autophagy (49–53).
Future studies should address the role of autophagy in mediating damage caused by ROS. It has been suggested that ERK1/2 regulates lysosomal degradation and more specifically, ERK2 kinase activation is necessary for autophagy (25). Recently, decreased ERK2 phosphorylation was noted in the mitochondrial fraction of DJ-1-deficient cells (40) and it was inferred that DJ-1-mediated ERK2 phosphorylation could putatively control autophagic and lysosomal functions. Our data differ from those of that study as we used affinity chromatography to separate phosphorylated proteins from the unphosphorylated whole cellular fraction. Although we did not observe a change in ERK1/2 phosphorylation in DJ-1-deficient cells, it would be worthwhile to examine the phosphorylation status of the mitochondrial pool of ERK1/2.
Additional studies are needed to identify the underlying molecular mechanisms relating PINK1/parkin and DJ-1. We suggest that oxidative stress is a likely common factor as it is important here for DJ-1 function, triggers phenotypes associated with loss of PINK1 (25) and is sufficient to activate parkin (4). If correct, this suggests that mitochondrial function under oxidative conditions is a determinant of neuronal survival in recessive parkinsonism.
MATERIALS AND METHODS
Cell culture and plasmids
Clonal M17 cell lines stably expressing DJ-1 shRNA constructs were grown and cultured as previously described (24). Expression plasmids for parkin (54) and PINK1 (55) have been described previously. The following plasmids were obtained from Dr Richard Youle (NINDS, Bethesda, MD) and were transfected into cells using Lipofectamine 2000 (Invitrogen): mito-YFP, pA-mito-GFP, Drp1-K38A-myc, Opa1-myc, Mfn1-FLAG (7) and LC3-GFP (56).
Cellular imaging and flow cytometry
For Δψm measurements, cells were cultured in chambered coverglass (Nunc), washed once with phosphate-buffered saline and stained for 30 min at 37°C with 100 nm TMRE (Invitrogen). Images were captured using an inverted confocal microscope (LSM510, Zeiss) with a rhodamine filter (λexcitation 554 nm, λemission 576 nm). Exposure to 10 μm CCCP (Sigma) for 1 h was used as a control for mitochondrial depolarization.
For ROS measurements, cells were stained with 10 mm DFFDA (Invitrogen) and DAPI (4',6-diamidino-2-phenylindolez) for 40 min at 37°C. Images were captured using an inverted confocal microscope and a FITC filter set λexcitation 492–495 nm and λemission 517–527 nm. Exposure to 100 μm H2O2 for 1 h was used as a positive control for ROS production.
For flow cytometry, cells were trypsinized and collected by centrifugation prior to TMRE (100 nm) and DAPI (1 μg/ml, Invitrogen) staining for 30 min at 37°C. Analysis was performed using the FACSVantage SE (Becton-Dickinson) flow cytometer, and the results were analyzed using CellQuest software. Gating was determined empirically in one experiment and then applied in the same way to all subsequent experiments.
Mitochondrial connectivity and fusion assays were performed as described previously (7). Autophagosome formation was monitored by transfecting cells with LC3-GFP and counting the number of distinct punctatae per cell. Cells were fixed (4% paraformaldehyde, Sigma) and co-stained for TOM20 (Santa Cruz; 1:1000) and, in the case of co-transfection with Drp1-K38A, monoclonal anti-c-myc (Roche 1:200) with appropriate secondary antibodies.
Western blotting
General methods for western blotting for PINK1 expression using total sodium dodecyl sulfate (SDS) cell lysates have been described previously (55). Phosphoprotein enrichment was performed and validated as in previous studies (7,57). Size exclusion chromatography was also performed and calibrated as detailed (58). The following antibodies were used at given dilutions: monoclonal anti-β-actin (Sigma), 1:5000; monoclonal anti-Drp1 (BD Translabs), 1:1000; monoclonal anti-Opa1 (BD Translabs), 1:500; monoclonal anti-DJ-1 (Stressgen), 1:3000; polyclonal anti-LC3B (Novus), 1:1000; polyclonal anti-ERK1/2 (Cell Signal), 1:1000; monoclonal anti-FLAG M2 (Sigma), 1:1000; monoclonal anti-c-myc (Roche), 1:1000; polyclonal anti-Fis1 (Biovision), 1:1000.
SUPPLEMENTARY MATERIAL
FUNDING
This research was supported by the Intramural Research Program of the National Institute on Aging, National Institutes of Health (Project Z01-AG000953). This study was also supported by grants from the Parkinsonfonden, Stohnes foundation, Gamla Tjänarinnor Foundation, NHR foundation and Riksbanken Jubileumfonden, Sweden, The K&A Wallenberg Foundation and the Swedish Brain Power Initiative.
Supplementary Material
ACKNOWLEDGEMENTS
We thank Dr Richard Youle and Megan Cleland for helpful discussions and indicated plasmid constructs.
Conflict of Interest statement: The authors declare that there are no conflicts of interest.
REFERENCES
- 1.Greenamyre J.T., Hastings T.G. Biomedicine: Parkinson's—divergent causes, convergent mechanisms. Science. 2004;304:1120–1122. doi: 10.1126/science.1098966. [DOI] [PubMed] [Google Scholar]
- 2.Gasser T. Molecular pathogenesis of Parkinson disease: insights from genetic studies. Expert Rev. Mol. Med. 2009;11:e22. doi: 10.1017/S1462399409001148. [DOI] [PubMed] [Google Scholar]
- 3.Zhou C., Huang Y., Shao Y., May J., Prou D., Perier C., Dauer W., Schon E.A., Przedborski S. The kinase domain of mitochondrial PINK1 faces the cytoplasm. Proc. Natl Acad. Sci. USA. 2008;105:12022–12027. doi: 10.1073/pnas.0802814105. [DOI] [PMC free article] [PubMed] [Google Scholar]
- 4.Narendra D., Tanaka A., Suen D.F., Youle R.J. Parkin is recruited selectively to impaired mitochondria and promotes their autophagy. J. Cell Biol. 2008;183:795–803. doi: 10.1083/jcb.200809125. [DOI] [PMC free article] [PubMed] [Google Scholar]
- 5.Canet-Avilés R.M., Wilson M.A., Miller D.W., Ahmad R., McLendon C., Bandyopadhyay S., Baptista M.J., Ringe D., Petsko G.A., Cookson M.R. The Parkinson's disease protein DJ-1 is neuroprotective due to cysteine-sulfinic acid-driven mitochondrial localization. Proc. Natl Acad. Sci. USA. 2004;101:9103–9108. doi: 10.1073/pnas.0402959101. [DOI] [PMC free article] [PubMed] [Google Scholar]
- 6.Haque M.E., Thomas K.J., D'Souza C., Callaghan S., Kitada T., Slack R.S., Fraser P., Cookson M.R., Tandon A., Park D.S. Cytoplasmic Pink1 activity protects neurons from dopaminergic neurotoxin MPTP. Proc. Natl Acad. Sci. USA. 2008;105:1716–1721. doi: 10.1073/pnas.0705363105. [DOI] [PMC free article] [PubMed] [Google Scholar]
- 7.Sandebring A., Thomas K.J., Beilina A., van der Brug M., Cleland M.M., Ahmad R., Miller D.W., Zambrano I., Cowburn R.F., Behbahani H., et al. Mitochondrial alterations in PINK1 deficient cells are influenced by calcineurin-dependent dephosphorylation of dynamin-related protein 1. PloS ONE. 2009;4:e5701. doi: 10.1371/journal.pone.0005701. [DOI] [PMC free article] [PubMed] [Google Scholar]
- 8.Kim R.H., Smith P.D., Aleyasin H., Hayley S., Mount M.P., Pownall S., Wakeham A., You-Ten A.J., Kalia S.K., Horne P., et al. Hypersensitivity of DJ-1-deficient mice to 1-methyl-4-phenyl-1,2,3,6-tetrahydropyrindine (MPTP) and oxidative stress. Proc. Natl Acad. Sci. USA. 2005;102:5215–5220. doi: 10.1073/pnas.0501282102. [DOI] [PMC free article] [PubMed] [Google Scholar]
- 9.Ved R., Saha S., Westlund B., Perier C., Burnam L., Sluder A., Hoener M., Rodrigues C.M., Alfonso A., Steer C., et al. Similar patterns of mitochondrial vulnerability and rescue induced by genetic modification of alpha-synuclein, parkin, and DJ-1 in Caenorhabditis elegans. J. Biol. Chem. 2005;280:42655–42668. doi: 10.1074/jbc.M505910200. [DOI] [PMC free article] [PubMed] [Google Scholar]
- 10.Zhang L., Shimoji M., Thomas B., Moore D.J., Yu S.W., Marupudi N.I., Torp R., Torgner I.A., Ottersen O.P., Dawson T.M., et al. Mitochondrial localization of the Parkinson's disease related protein DJ-1: implications for pathogenesis. Hum. Mol. Genet. 2005;14:2063–2073. doi: 10.1093/hmg/ddi211. [DOI] [PubMed] [Google Scholar]
- 11.Casarejos M.J., Menendez J., Solano R.M., Rodriguez-Navarro J.A., Garcia de Yebenes J., Mena M.A. Susceptibility to rotenone is increased in neurons from parkin null mice and is reduced by minocycline. J. Neurochem. 2006;97:934–946. doi: 10.1111/j.1471-4159.2006.03777.x. [DOI] [PubMed] [Google Scholar]
- 12.Paterna J.C., Leng A., Weber E., Feldon J., Büeler H. DJ-1 and Parkin modulate dopamine-dependent behavior and inhibit MPTP-induced nigral dopamine neuron loss in mice. Mol. Ther. 2007;15:698–704. doi: 10.1038/sj.mt.6300067. [DOI] [PubMed] [Google Scholar]
- 13.Gautier C.A., Kitada T., Shen J. Loss of PINK1 causes mitochondrial functional defects and increased sensitivity to oxidative stress. Proc. Natl Acad. Sci. USA. 2008;105:11364–11369. doi: 10.1073/pnas.0802076105. [DOI] [PMC free article] [PubMed] [Google Scholar]
- 14.Palacino J.J., Sagi D., Goldberg M.S., Krauss S., Motz C., Wacker M., Klose J., Shen J. Mitochondrial dysfunction and oxidative damage in parkin-deficient mice. J. Biol. Chem. 2004;279:18614–18622. doi: 10.1074/jbc.M401135200. [DOI] [PubMed] [Google Scholar]
- 15.Clark I.E., Dodson M.W., Jiang C., Cao J.H., Huh J.R., Seol J.H., Yoo S.J., Hay B.A., Guo M. Drosophila pink1 is required for mitochondrial function and interacts genetically with parkin. Nature. 2006;441:1162–1166. doi: 10.1038/nature04779. [DOI] [PubMed] [Google Scholar]
- 16.Dodson M.W., Guo M. Pink1, Parkin, DJ-1 and mitochondrial dysfunction in Parkinson's disease. Curr. Opin. Neurobiol. 2007;17:331–337. doi: 10.1016/j.conb.2007.04.010. [DOI] [PubMed] [Google Scholar]
- 17.Park J., Lee S.B., Lee S., Kim Y., Song S., Kim S., Bae E., Kim J., Shong M., Kim J.M., et al. Mitochondrial dysfunction in Drosophila PINK1 mutants is complemented by parkin. Nature. 2006;441:1157–1161. doi: 10.1038/nature04788. [DOI] [PubMed] [Google Scholar]
- 18.Yang Y., Gehrke S., Imai Y., Huang Z., Ouyang Y., Wang J.W., Yang L., Beal M.F., Vogel H., Lu B. Mitochondrial pathology and muscle and dopaminergic neuron degeneration caused by inactivation of Drosophila Pink1 is rescued by Parkin. Proc. Natl Acad. Sci. USA. 2006;103:10793–10798. doi: 10.1073/pnas.0602493103. [DOI] [PMC free article] [PubMed] [Google Scholar]
- 19.Exner N., Treske B., Paquet D., Holmström K., Schiesling C., Gispert S., Carballo-Carbajal I., Berg D., Hoepken H.H., Gasser T., et al. Loss-of-function of human PINK1 results in mitochondrial pathology and can be rescued by parkin. J. Neurosci. 2007;27:12413–12418. doi: 10.1523/JNEUROSCI.0719-07.2007. [DOI] [PMC free article] [PubMed] [Google Scholar]
- 20.Geisler S., Holmstrom K.M., Skujat D., Fiesel F.C., Rothfuss O.C., Kahle P.J., Springer W. PINK1/Parkin-mediated mitophagy is dependent on VDAC1 and p62/SQSTM1. Nat. Cell Biol. 2010;12:119–131. doi: 10.1038/ncb2012. [DOI] [PubMed] [Google Scholar]
- 21.Narendra D.P., Jin S.M., Tanaka A., Suen D.F., Gautier C.A., Shen J., Cookson M.R., Youle R.J. PINK1 is selectively stabilized on impaired mitochondria to activate Parkin. PLoS Biol. 2010;8:e1000298. doi: 10.1371/journal.pbio.1000298. [DOI] [PMC free article] [PubMed] [Google Scholar]
- 22.Vives-Bauza C., Zhou C., Huang Y., Cui M., de Vries R.L., Kim J., May J., Tocilescu M.A., Liu W., Ko H.S., et al. PINK1-dependent recruitment of Parkin to mitochondria in mitophagy. Proc. Natl Acad. Sci. USA. 2009;107:378–383. doi: 10.1073/pnas.0911187107. [DOI] [PMC free article] [PubMed] [Google Scholar]
- 23.Ziviani E., Tao R.N., Whitworth A.J. Drosophila Parkin requires PINK1 for mitochondrial translocation and ubiquitinates Mitofusin. Proc. Natl Acad. Sci. USA. 2010;107:5018–5023. doi: 10.1073/pnas.0913485107. [DOI] [PMC free article] [PubMed] [Google Scholar]
- 24.van der Brug M.P., Blackinton J., Chandran J., Hao L.Y., Lal A., Mazan-Mamczarz K., Martindale J., Xie C., Ahmad R., Thomas K.J., et al. RNA binding activity of the recessive parkinsonism protein DJ-1 supports involvement in multiple cellular pathways. Proc. Natl Acad. Sci. USA. 2008;105:10244–10249. doi: 10.1073/pnas.0708518105. [DOI] [PMC free article] [PubMed] [Google Scholar]
- 25.Dagda R.K., Cherra S.J., III, Kulich S.M., Tandon A., Park D., Chu C.T. Loss of PINK1 function promotes mitophagy through effects on oxidative stress and mitochondrial fission. J. Biol. Chem. 2009;284:13843–13855. doi: 10.1074/jbc.M808515200. [DOI] [PMC free article] [PubMed] [Google Scholar]
- 26.Tolkovsky A.M. Mitophagy. Biochim. Biophys. Acta. 2009;1793:1508–1515. doi: 10.1016/j.bbamcr.2009.03.002. [DOI] [PubMed] [Google Scholar]
- 27.Andres-Mateos E., Perier C., Zhang L., Blanchard-Fillion B., Greco T.M., Thomas B., Ko H.S., Sasaki M., Ischiropoulos H., Przedborski S., et al. DJ-1 gene deletion reveals that DJ-1 is an atypical peroxiredoxin-like peroxidase. Proc. Natl Acad. Sci. USA. 2007;104:14807–14812. doi: 10.1073/pnas.0703219104. [DOI] [PMC free article] [PubMed] [Google Scholar]
- 28.Taira T., Saito Y., Niki T., Iguchi-Ariga S.M., Takahashi K., Ariga H. DJ-1 has a role in antioxidative stress to prevent cell death. EMBO Rep. 2004;5:213–218. doi: 10.1038/sj.embor.7400074. [DOI] [PMC free article] [PubMed] [Google Scholar]
- 29.Takahashi-Niki K., Niki T., Taira T., Iguchi-Ariga S.M., Ariga H. Reduced anti-oxidative stress activities of DJ-1 mutants found in Parkinson's disease patients. Biochem. Biophys. Res. Commun. 2004;320:389–397. doi: 10.1016/j.bbrc.2004.05.187. [DOI] [PubMed] [Google Scholar]
- 30.Zhou W., Freed C.R. DJ-1 up-regulates glutathione synthesis during oxidative stress and inhibits A53T alpha-synuclein toxicity. J. Biol. Chem. 2005;280:43150–43158. doi: 10.1074/jbc.M507124200. [DOI] [PubMed] [Google Scholar]
- 31.Chang C.R., Blackstone C. Cyclic AMP-dependent protein kinase phosphorylation of Drp1 regulates its GTPase activity and mitochondrial morphology. J. Biol. Chem. 2007;282:21583–21587. doi: 10.1074/jbc.C700083200. [DOI] [PubMed] [Google Scholar]
- 32.Cribbs J.T., Strack S. Reversible phosphorylation of Drp1 by cyclic AMP-dependent protein kinase and calcineurin regulates mitochondrial fission and cell death. EMBO Rep. 2007;8:939–944. doi: 10.1038/sj.embor.7401062. [DOI] [PMC free article] [PubMed] [Google Scholar]
- 33.Twig G., Elorza A., Molina A.J., Mohamed H., Wikstrom J.D., Walzer G., Stiles L., Haigh S.E., Katz S., Las G., et al. Fission and selective fusion govern mitochondrial segregation and elimination by autophagy. EMBO J. 2008;27:433–446. doi: 10.1038/sj.emboj.7601963. [DOI] [PMC free article] [PubMed] [Google Scholar]
- 34.Klionsky D.J., Abeliovich H., Agostinis P., Agrawal D.K., Aliev G., Askew D.S., Baba M., Baehrecke E.H., Bahr B.A., Ballabio A., et al. Guidelines for the use and interpretation of assays for monitoring autophagy in higher eukaryotes. Autophagy. 2008;4:151–175. doi: 10.4161/auto.5338. [DOI] [PMC free article] [PubMed] [Google Scholar]
- 35.Blackinton J., Lakshminarasimhan M., Thomas K.J., Ahmad R., Greggio E., Raza A.S., Cookson M.R., Wilson M.A. Formation of a stabilized cysteine sulfinic acid is critical for the mitochondrial function of the parkinsonism protein DJ-1. J. Biol. Chem. 2009;284:6476–6485. doi: 10.1074/jbc.M806599200. [DOI] [PMC free article] [PubMed] [Google Scholar]
- 36.Xiong H., Wang D., Chen L., Choo Y.S., Ma H., Tang C., Xia K., Jiang W., Ronai Z., Zhuang X., et al. Parkin, PINK1, and DJ-1 form a ubiquitin E3 ligase complex promoting unfolded protein degradation. J. Clin. Invest. 2009;119:650–660. doi: 10.1172/JCI37617. [DOI] [PMC free article] [PubMed] [Google Scholar]
- 37.Miller D.W., Ahmad R., Hague S., Baptista M.J., Canet-Aviles R., McLendon C., Carter D.M., Zhu P.P., Stadler J., Chandran J., et al. L166P mutant DJ-1, causative for recessive Parkinson's disease, is degraded through the ubiquitin-proteasome system. J. Biol. Chem. 2003;278:36588–36595. doi: 10.1074/jbc.M304272200. [DOI] [PubMed] [Google Scholar]
- 38.Van Humbeeck C., Waelkens E., Corti O., Brice A., Vandenberghe W. Parkin occurs in a stable, non-covalent, approximately 110-kDa complex in brain. Eur. J. Neurosci. 2008;27:284–293. doi: 10.1111/j.1460-9568.2007.06000.x. [DOI] [PMC free article] [PubMed] [Google Scholar]
- 39.Irrcher I., Aleyasin H., Seifert E.L., Hewitt S.J., Chhabra S., Phillips M., Lutz A.K., Rousseaux M.W., Bevilacqua L., Jahani-Asl A., et al. Loss of the Parkinson's disease-linked gene DJ-1 perturbs mitochondrial dynamics. Hum. Mol. Genet. 2010;19:3734–3746. doi: 10.1093/hmg/ddq288. [DOI] [PubMed] [Google Scholar]
- 40.Krebiehl G., Ruckerbauer S., Burbulla L.F., Kieper N., Maurer B., Waak J., Wolburg H., Gizatullina Z., Gellerich F.N., Woitalla D., et al. Reduced basal autophagy and impaired mitochondrial dynamics due to loss of Parkinson's disease-associated protein DJ-1. PloS ONE. 2010;5:e9367. doi: 10.1371/journal.pone.0009367. [DOI] [PMC free article] [PubMed] [Google Scholar]
- 41.Meulener M.C., Xu K., Thomson L., Thompson L., Ischiropoulos H., Bonini N.M. Mutational analysis of DJ-1 in Drosophila implicates functional inactivation by oxidative damage and aging. Proc. Natl Acad. Sci. USA. 2006;103:12517–12522. doi: 10.1073/pnas.0601891103. [DOI] [PMC free article] [PubMed] [Google Scholar]
- 42.Lutz A.K., Exner N., Fett M.E., Schlehe J.S., Kloos K., Lammermann K., Brunner B., Kurz-Drexler A., Vogel F., Reichert A.S., et al. Loss of parkin or PINK1 function increases Drp1-dependent mitochondrial fragmentation. J. Biol. Chem. 2009;284:22938–22951. doi: 10.1074/jbc.M109.035774. [DOI] [PMC free article] [PubMed] [Google Scholar]
- 43.Kawajiri S., Saiki S., Sato S., Sato F., Hatano T., Eguchi H., Hattori N. PINK1 is recruited to mitochondria with parkin and associates with LC3 in mitophagy. FEBS Lett. 2010;584:1073–1079. doi: 10.1016/j.febslet.2010.02.016. [DOI] [PubMed] [Google Scholar]
- 44.Matsuda N., Sato S., Shiba K., Okatsu K., Saisho K., Gautier C.A., Sou Y.S., Saiki S., Kawajiri S., Sato F., et al. PINK1 stabilized by mitochondrial depolarization recruits Parkin to damaged mitochondria and activates latent Parkin for mitophagy. J. Cell Biol. 2010;189:211–221. doi: 10.1083/jcb.200910140. [DOI] [PMC free article] [PubMed] [Google Scholar]
- 45.Shiba K., Arai T., Sato S., Kubo S., Ohba Y., Mizuno Y., Hattori N. Parkin stabilizes PINK1 through direct interaction. Biochem. Biophys. Res. Commun. 2009;383:331–335. doi: 10.1016/j.bbrc.2009.04.006. [DOI] [PubMed] [Google Scholar]
- 46.Ren H., Fu K., Mu C., Li B., Wang D., Wang G. DJ-1, a cancer and Parkinson's disease associated protein, regulates autophagy through JNK pathway in cancer cells. Cancer Lett. 2010;297:101–108. doi: 10.1016/j.canlet.2010.05.001. [DOI] [PubMed] [Google Scholar]
- 47.Vasseur S., Afzal S., Tardivel-Lacombe J., Park D.S., Iovanna J.L., Mak T.W. DJ-1/PARK7 is an important mediator of hypoxia-induced cellular responses. Proc. Natl Acad. Sci. USA. 2009;106:1111–1116. doi: 10.1073/pnas.0812745106. [DOI] [PMC free article] [PubMed] [Google Scholar]
- 48.Gonzalez-Polo R., Niso-Santano M., Moran J.M., Ortiz-Ortiz M.A., Bravo-San Pedro J.M., Soler G., Fuentes J.M. Silencing DJ-1 reveals its contribution in paraquat-induced autophagy. J. Neurochem. 2009;109:889–898. doi: 10.1111/j.1471-4159.2009.06020.x. [DOI] [PubMed] [Google Scholar]
- 49.Azad M.B., Chen Y., Gibson S.B. Regulation of autophagy by reactive oxygen species (ROS): implications for cancer progression and treatment. Antioxid. Redox Signal. 2009;11:777–790. doi: 10.1089/ars.2008.2270. [DOI] [PubMed] [Google Scholar]
- 50.Chen Y., McMillan-Ward E., Kong J., Israels S.J., Gibson S.B. Mitochondrial electron-transport-chain inhibitors of complexes I and II induce autophagic cell death mediated by reactive oxygen species. J. Cell Sci. 2007;120:4155–4166. doi: 10.1242/jcs.011163. [DOI] [PubMed] [Google Scholar]
- 51.Filomeni G., Desideri E., Cardaci S., Rotilio G., Ciriolo M.R. Under the ROS … Thiol network is the principal suspect for autophagy commitment. Autophagy. 2010;6:999–1005. doi: 10.4161/auto.6.7.12754. [DOI] [PubMed] [Google Scholar]
- 52.Mammucari C., Rizzuto R. Signaling pathways in mitochondrial dysfunction and aging. Mech. Ageing Dev. 2010;131:536–543. doi: 10.1016/j.mad.2010.07.003. [DOI] [PMC free article] [PubMed] [Google Scholar]
- 53.Thomas K.J., Cookson M.R. The role of PTEN-induced kinase 1 in mitochondrial dysfunction and dynamics. Int. J. Biochem. Cell Biol. 2009;41:2025–2035. doi: 10.1016/j.biocel.2009.02.018. [DOI] [PMC free article] [PubMed] [Google Scholar]
- 54.Cookson M.R., Lockhart P.J., McLendon C., O'Farrell C., Schlossmacher M., Farrer M.J. RING finger 1 mutations in Parkin produce altered localization of the protein. Hum. Mol. Genet. 2003;12:2957–2965. doi: 10.1093/hmg/ddg328. [DOI] [PubMed] [Google Scholar]
- 55.Beilina A., Van Der Brug M., Ahmad R., Kesavapany S., Miller D.W., Petsko G.A., Cookson M.R. Mutations in PTEN-induced putative kinase 1 associated with recessive parkinsonism have differential effects on protein stability. Proc. Natl Acad. Sci. USA. 2005;102:5703–5708. doi: 10.1073/pnas.0500617102. [DOI] [PMC free article] [PubMed] [Google Scholar]
- 56.Jackson W.T., Giddings T.H., Jr, Taylor M.P., Mulinyawe S., Rabinovitch M., Kopito R.R., Kirkegaard K. Subversion of cellular autophagosomal machinery by RNA viruses. PLoS Biol. 2005;3:e156. doi: 10.1371/journal.pbio.0030156. [DOI] [PMC free article] [PubMed] [Google Scholar]
- 57.Greggio E., Lewis P.A., van der Brug M.P., Ahmad R., Kaganovich A., Ding J., Beilina A., Baker A.K., Cookson M.R. Mutations in LRRK2/dardarin associated with Parkinson disease are more toxic than equivalent mutations in the homologous kinase LRRK1. J. Neurochem. 2007;102:93–102. doi: 10.1111/j.1471-4159.2007.04523.x. [DOI] [PubMed] [Google Scholar]
- 58.Greggio E., Zambrano I., Kaganovich A., Beilina A., Taymans J.M., Daniels V., Lewis P., Jain S., Ding J., Syed A., et al. The Parkinson disease-associated leucine-rich repeat kinase 2 (LRRK2) is a dimer that undergoes intramolecular autophosphorylation. J. Biol. Chem. 2008;283:16906–16914. doi: 10.1074/jbc.M708718200. [DOI] [PMC free article] [PubMed] [Google Scholar]
Associated Data
This section collects any data citations, data availability statements, or supplementary materials included in this article.