

Abstract
Taste and oral sensations vary in humans. Some of this variation has a genetic basis, and two commonly measured phenotypes are the bitterness of propylthiouracil (PROP) and the number of fungiform papillae on the anterior tongue. While the genetic control of fungiform papilla is unclear, PROP bitterness associates with allelic variation in the taste receptor gene, TAS2R38. The two common alleles are AVI and PAV (proline, alanine, valine, and isoleucine); AVI/AVI homozygotes taste PROP as less bitter than heterozygous or homozygous PAV carriers. In this laboratory-based study, we determined whether taste of a bitter probe (quinine) and vegetable intake varied by taste phenotypes and TAS2R38 genotype in healthy adults (mean age=26 years). Vegetable intake was assessed via two validated, complementary methods: food records (Food Pyramid servings standardized to energy intake) and food frequency questionnaire (general intake question and composite vegetable groups). Quinine bitterness varied with phenotypes but not TAS2R38; quinine was more bitter to those who tasted PROP as more bitter or had more papillae. Nontasters by phenotype or genotype reported greater consumption of vegetables, regardless of type (i.e., the effect generalized to all vegetables and was not restricted to those typically thought of as being bitter). Furthermore, nontasters with more papillae reported greater vegetable consumption than nontasters with fewer papillae, suggesting that when bitterness does not predominate, more papillae enhance vegetable liking. These findings suggest that genetic variation in taste, measured by multiple phenotypes or TAS2R38 genotype, can explain differences in overall consumption of vegetables, and this was not restricted to vegetables that are predominantly bitter.
Keywords: Taste, Genetics, Food preferences, Vegetables, Propylthiouracil, Fungiform papillae
Introduction
National health surveillance data in the USA indicate that consumption of vegetables falls well below established recommendations (Lock et al. 2005; Steinmetz and Potter 1996). According to data from the 2005 US Behavioral Risk Factor Surveillance System, just over one in four adults consumed three servings or more of vegetables per day (CDC 2007); previous surveillance studies have shown that the majority of vegetables consumed are starchy vegetables, specifically white potatoes (USDA 1998). The 2010 Dietary Guidelines for Americans advise daily consumption of vegetables, based on energy needs, which translates, for example, from 2.5 to 3 cups of vegetables per day for energy intakes of 1800 to 2400 calories (USDA 2010). Individuals are encouraged to eat a variety of vegetables including dark green, orange, starchy, and other vegetables (USDA 2010).
Vegetables are perceptually complex stimuli that can elicit taste, textural, chemesthestic (e.g., irritation, astringency), and olfactory sensations. These sensations may alter an individuals’ willingness to consume vegetables, especially those that are rich in putatively beneficial phytonutrients. Those who taste PROP as more bitter also taste a broad range of compounds and foods/beverages as more bitter as illustrated with quinine hydrochloride (QHCl) (Hayes et al. 2008a), naringin (Drewnowski et al. 1997), grapefruit juice (Lanier et al. 2005), coffee (Lanier et al. 2005), green tea (Gayathri et al. 1997), alcoholic beverages (Intranuovo and Powers 1998; Lanier et al. 2005), and vegetables (Dinehart et al. 2006; Kaminski et al. 2000; Keller et al. 2002; Turnbull and Matisoo-Smith 2002). Individuals who perceive more bitterness report less liking for vegetables, whether assessed via preference checklists (Bajec and Pickering 2010; Drewnowski et al. 1999, 2000) or by tasting vegetables (Dinehart et al. 2006; Kaminski et al. 2000). Finally, those who perceive more bitterness also consume fewer vegetables, in both short access tests (Bell and Tepper 2006) and dietary self-report outside the laboratory (Basson et al. 2005; Dinehart et al. 2006). When using structural equation modeling to identify spurious correlations, it appears that the observed effects of orosensory variation on vegetable intake are entirely mediated via liking (Dinehart et al. 2006). Phenols, flavonoids, isoflavones, terpenes, and glucosinolates are some of the compounds responsible for vegetable bitterness, pungency, and/or astringency reviewed by Drewnowski and Gomez-Carneros (2000). In contrast, those who taste less bitterness from sampled vegetables (brussels sprouts, kale, and asparagus) also taste more natural sweetness, which translates to greater liking of these vegetables and generalizes to greater reported intake of all vegetables (Dinehart et al. 2006). In cruciferous vegetables, sweetness has been shown to decline in proportion to an increase in bitter glucosinolates (Schonhof et al. 2004).
Taste response to phenylthiocarbamide (PTC) and pro-pylthiouracil (PROP) are well-studied markers of genetic variation in taste. In 1931, Fox (1931) made the accidental discovery of blindness to PTC bitterness, which was quickly shown to be a genetic trait (Blakeslee 1932). Today, PROP is preferred over PTC in human studies, as it produces less sulfur odor and has known toxicity data due to its use as a medication (Barnicot et al. 1951; Lawless 1980). Subject classification based on threshold methods can differentiate nontasters (low sensitivity) from tasters (higher sensitivity). Assessing suprathreshold perception separates supertasters from medium tasters among the PROP tasters (Hayes et al. 2008a). Polymorphisms of the TAS2R38 gene explain the majority of variability in PTC and PROP threshold (Kim et al. 2003), yet they do not explain supertasting (Hayes et al. 2008a). Current thinking suggests that supertasting exists as a phenomenon beyond operational definitions based strictly on PROP (Hayes et al. 2008a; Bajec and Pickering 2008; Reed 2008).
Regarding TAS2R38, the ability to taste PROP/PTC at low concentrations associates with the proline–alanine–valine (PAV) haplotype while the alanine–valine–isoleucine (AVI) haplotype appears to encode a less functional receptor (Bufe et al. 2005; Duffy et al. 2004b), resulting in three common genotypes across the population—PAV homozygotes, heterozygotes, and AVI homozygotes. Sandall and Breslin (2006) found that AVI homozygotes perceived less bitterness from glucosinolate-producing vegetables than heterozygotes, who in turn found them less bitter than did PAV homozygotes; in contrast, no genotypic differences were observed for vegetables lacking glucosinolates. Regarding consumption, data from the Italian branch of European Prospective Investigation into Cancer and Nutrition (634 healthy subjects) trial showed that AVI homozygotes consumed more cruciferous vegetables per day than did PAV carriers (homozygotes and PAV heterozygotes) across four geographic regions within Italy (Sacerdote et al. 2007). In contrast, the British Women’s Heart and Health Study cohort (4,286 women aged 60 to 79 years) did not find a significant association between TAS2R38 genotype and vegetable intake among elderly females; this may be due to difficulties in seeing genotype–phenotype associations in the elderly or the debittering of vegetables in British food preparation techniques (Timpson et al. 2005). Previously, Dick and colleagues (2001) demonstrated that the environment strongly moderates genetic effects, which may account for this discrepancy. Here, we provide data from a laboratory cohort of young adults in the USA confirming the putative link between TAS2R38 genotype and vegetable intake.
Fungiform papillae are innervated by taste and trigeminal fibers (Whitehead et al. 1985) and thus provide a proxy of innervation density. By recording videoimages of a blue-stained anterior tongue under magnification, a sampling of number of fungiform papillae can be determined, which may associate with intensity of prototypical tastes (reviewed by Prutkin et al. 2000), non-taste oral sensations (Prescott et al. 2004), tactile acuity (Essick et al. 2003), food preferences (Hayes and Duffy 2008), and, at least indirectly, intake (Hayes et al. 2010). Fungiform papilla number has an influence on PROP bitterness that is independent on TAS2R38 genotype and may have differential effects for heightened bitterness across genotype (Hayes et al. 2008a). The genetic basis for fungiform papilla density is presently unknown. The number of these papillae is probably stable across aging since the number declines only with severe nerve damage, such as damage to chorda tympani and lingual nerves (Zuniga et al. 1994). Taste and oral sensations can change relative to fungiform papillae density because of exposure to environmental factors that alter the balance of taste and trigeminal input. For example, damage to taste nerves can release tonic inhibition of trigeminal input, resulting in heightened response to tactile sensations from fats and irritants, and at the extreme to produce phantom pain sensations in absence of oral stimulation (Bartoshuk et al. 2005b). Regarding dietary behavior, fungiform papillae number can provide contributions independent of PROP phenotype to explain variability in intake, as with variability in sodium intake via liking for high-sodium foods (Hayes et al. 2010).
The present study aimed to build on previous literature by examining the relationships between genetic variability in orosensation and vegetable intake using a diverse battery of phenotypic measures (PROP bitterness, fungiform papillae number), TAS2R38 genotype, and vegetable intake measures. This study employs state of the science psychophysical methodology, which allow for valid comparisons across nontasters, medium tasters, and supertasters (Bartoshuk et al. 2005a; Hayes et al. 2008a). This study also uses two separate but complementary methods of dietary assessment to quantify intake: multiday non-consecutive food records and an interviewed food frequency questionnaire (FFQ). Multiday food records are the gold standard in dietary assessment (de Castro 1994), but they can induce assessment reactivity (Macdiarmid and Blundell 1998) and may fail to capture usual intake due to limited timepoints or seasonal fluctuations in diet. In contrast, FFQs capture typical intake over time, but are inherently less quantitative (Subar et al. 2001). By using both here, we present a more complete view of an individual’s vegetable intake. Additionally, since avoidance of many types of vegetables has previously been attributed to their bitterness, the study also examined the ability of PROP phenotype and TAS2R38 genotype to predict the bitterness of another bitter tastant, QHCl.
Participants and Methods
Participants
Men and women were recruited from a university community to obtain diversity in phenotypic measures of chemosensory genetics and to minimize confounding factors that would affect the study of taste genetics and dietary behaviors. Potential participants were not invited into the study if, during telephone screening, they reported a history of severe head trauma and/or ear infections, which hinder classification of genetic variation in taste (Bartoshuk et al. 1996). As dietary restraint influences accuracy of dietary assessment (Bathalon et al. 2000) and the study of taste genetics and diet (Tepper and Ullrich 2002), subjects with high dietary restraint were excluded by telephone screening with the “Concern for Dieting” subscale of the Restrained Eating Scale (Herman and Polivy 1975, 1980) and by the “Cognitive Restraint of Eating” (Gorman and Allison 1995) subscale of the Three Factor Eating Questionnaire (Stunkard and Messick 1985) administered at the first study session. The first study session assured sampling diversity in PROP tasting as reported previously (Duffy et al. 2004c) by screening for nontasters via a PROP threshold and supertasters via perceived bitterness of 0.32 mM PROP, a moderately concentrated solution to avoid context effects imposed by the concentrated PROP solution (3.2 mM PROP) (Bartoshuk 2000).
The study sample consisted of 59 reportedly healthy individuals (28 females, 31 males; mean=26.14±0.55 SEM) for whom blood samples were available for genotyping the TAS2R38 gene (Entrez GeneID 5726). The number of subjects provided a sufficient ratio of cases to independent variables for testing the study aim. For multiple regression analyses with the phenotype, 55 cases were required at alpha=0.05 and 80% power with two predictors to detect a medium-sized (f2=0.15) effect (Faul et al. 2007). For analysis of variance using genotype, a minimum of 20 subjects per group at alpha=0.05 and 80% power is sufficient to detect a large (f2=0.45) effect. The sample was primarily of European ancestry, with self-reported ethnicity as follows: 45 Caucasians, one African American, seven Asians, five Hispanic, and one Asian-Indian. Most (n=40) had normal body mass indexes (BMI<25); 16 subjects were overweight (BMI>25 and <30) and three were obese (BMI>30). In this sample, PROP bitterness did not associate significantly with obesity (body mass index) or central adiposity (waist circumference). Participants reported to the lab for three sessions approximately 1 week apart. Procedures were approved by the Institutional Review Board; subjects provided written consent and were paid for their participation.
Intensity Ratings
Subjects used the general Labeled Magnitude Scale (gLMS) to rate the bitterness of QHCl and PROP (Bartoshuk et al. 2005a). The gLMS is a generalization of the Labeled Magnitude Scale (Green et al. 1996) devised to apply to sensations from all domains. For intensity, the scale was labeled 0 at the bottom for “no sensation” and 100 at the top for “strongest imaginable sensation of any kind,” with intermediate labels located at “barely detectable” (1.4), “weak” (6), “moderate” (17), “strong” (35), and “very strong” (53). The intensity labels were not confined to the context of oral sensation as in the original LMS (Green et al. 1996). Since intensity labels like “very strong” denote different absolute perceived intensities to groups of individuals whose prior oral sensory experiences vary due to biological differences, restricting the rating context to “oral sensations” would systematically bias the data and potentially obfuscate real effects (Bartoshuk et al. 2005a; Snyder et al. 2006). After an orientation with imagined or remembered sensations, participants pointed and clicked with a computer mouse to indicate the location on the gLMS that represented the intensity of the sensation from the sampled item. A basic program (Microsoft Basic, Version 2.43) converted the response into a whole number visible to the subject (Duffy et al. 2004c). The experimenter provided the samples and recorded the intensity ratings manually.
Measures of Taste Phenotype and Bitterness of QHCL
PROP bitterness and threshold were assessed as described previously (Duffy et al. 2004c). A PROP threshold test was administered on the first day of testing using a modified up-down procedure (McBurney and Collings 1977) with room temperature solutions ranging in quarter-log steps from 0.001 to 3.2 mM reagent grade 6-n-propylthiouracil dissolved in deionized water (Hydro Picotech System, >18 MΩ/mL). Threshold was the geometric mean of the final six reversals in the up-down procedure. On day 1, subjects also rated the intensity of 0.32 mM QHCl. At the end of the session on day 3, adults reported the perceived bitterness of five PROP solutions presented in half-log steps (from 0.032 to 3.2 mM). Perceived bitterness of 3.2 mM PROP, reported as raw data derived from the gLMS, was used to predict QHCl bitterness and vegetable intake. Videomicroscopy of the tongue tip was used to assess density of fungiform papilla in a 6-mm-diameter circular template on the right and left tongue tips following a procedure similar to that of Miller and Reedy (1990) and reported previously (Duffy et al. 2004c). The mean number of papillae on the right and left sides of the anterior tongue was used to predict bitterness ratings and vegetable intake.
Determination of TAS2R38 Genotype
Using standard methods and following manufacturer’s instructions (Gentra), DNA was extracted from whole blood samples, which had been stored at subzero (−70 °C) freezer temperatures. Purified DNA samples were stored at 4 °C until being analyzed with the 5′ exonuclease reaction (TaqMan). Genotypes were determined using vendor supplied assays from Applied Biosystems (hCV8876467, hCV9506827, and hCV9506826); 384-well plates were read on an ABI Prism 7900 HT. Samples that failed to give a clean genotype were repeated once. Individuals had only three patterns on genotyping for the three polymorphic sites: only P, A, and V present; only A, V, and I present; and both alleles present at all three sites. Given extensive population data (Bamshad et al. 2004; Kidd et al. 2004), these correspond to PAV homozygotes, AVI homozygotes, and PAV/AVI heterozygotes, respectively, with probabilities >99%. Of the 59 individuals genotyped for TAS2R38, four had uncommon haplotypes and were removed from the genotype analyses.
Measures of Vegetable Intake
Vegetable intake was assessed using two complementary but distinct methods: (a) five 1-day, non-consecutive food records, which were analyzed for Pyramid vegetable group servings (Cook and Friday 2000a) and (b) validated food frequency questionnaire to estimate general intake of vegetables and two groups of vegetables eaten over the preceding year. A registered dietitian (RD) provided instruction on how to maintain food records, reviewed one or two records submitted each session with the participant, and analyzed the records with the Food Processor Program (v7.5), which provided servings of the Pyramid vegetable group and total energy intake.
During session 2, the RD interviewed participants with the Block food questionnaire (Version 98.1) (Berkley Nutrition Services 2003) on the number of servings of vegetables generally eaten (minus salad and potatoes) according to nine frequency categories (less than once per week to 4+ per day) and specific vegetables according to nine frequency categories (never to daily) and the amount consumed (pictures of serving sizes were used). Each was converted to number of servings eaten on an annual basis (e.g., 1/day=365). Two groups were formed conceptually, “all vegetables group” and the “vitamin A&C-rich vegetables” (Table 1). The former group tested the ability of phenotype and genotype to associate with intake of all vegetables, while the latter was comprised primarily of vegetables with bitter or acidic sensations that have been shown to associate with genetic variation in taste. Vegetables consumed less than once per month (greens, cole slaw/cabbage, chili, split pea/bean/lentil soup, and vegetable stew) were not included in the groups. The groups had reasonable internal reliability (Table 1). The potential for systematic differences in reported frequency of food intake across groups was examined by taking an overall reported frequency of all foods and beverages and comparing that frequency with the taste genetic measures and sex. Neither the phenotypes, genotypes, nor sex varied significantly with this reporting frequency across all foods on the food frequency questionnaire.
Table 1.
Subject characteristics and energy and vegetable intake
| Women (n=28) | Men (n=31) | |
|---|---|---|
| Agea (years) | 24.6±0.7 (20–32) | 27.5±0.8 (21–39) |
| Height (cm) | 165.87±1.41 (147.32–182.88) | 176.14±1.37 (165.1–193.04) |
| Weight (kg) | 60.38±1.82 (37.73–76.36) | 78.18±2.18 (61.36–116.36) |
| BMI (kg/m2)b | 21.86±0.50 (17.38–28.05) | 25.18±0.60 (20.13–34.79) |
| Waist circumference (cm)b | 70.4±1.2 (59.6–83.8) | 86.0±2.4 (62.2–119.4) |
| Restraint scorec | 6.4±0.7 (1–12) | 5.2±0.6 (0–12) |
| Energy (kJ) | 7,470.14±288.54 (4,301.24–10,549.65) | 10,152.01±432.57 (6,506.54–15,424.27) |
| Pyramid vegetable servingsa,d | 2.61±0.23 (0.54–5.52) | 3.79±0.33 (0.78–7.88) |
| Overall vegetable frequencye | 626.0±69.6 (75–1,460) | 602.9±64.7 (182–1,460) |
| All vegetables groupe | 658.8±71.5 (81–1,576) | 592.0±60.53 (72–1,578) |
| A&C-rich vegetables groupe | 550.8±68.1 (69–1,488) | 467.0±58.2 (12–1,444) |
Mean±SEM; range in parentheses
Indicate variables that differed by sex at 0.05
Indicate variables that differed by sex at 0.001
Obtained from five, non-consecutive food records
Number of vegetable servings over preceding year from the food frequency instrument (Berkley Nutrition Services 2003). A&C-rich vegetables included tomatoes, juice, or V-8; broccoli; carrots or mixed dishes with carrots; spinach; sweet potatoes/yams; green salad; other vegetables; vegetable soup (α=0.65). The all vegetables group included the previous listing plus corn; green beans or peas; refried beans or bean burritos; baked beans or dried beans (α=0.62)
Statistical Methods
Statistica (version 4.1, StatSoft, Tulsa, OK, USA) was used to complete the statistical analyses, and the criterion for significance was p≤0.05. Standard regression analyses predicted quinine bitterness and vegetable intake variables from both measures of taste phenotype, 3.2 mM PROP bitterness and fungiform papilla number. Although we previously found that PROP phenotype captures additional variance in sensory response even after controlling for TAS2R38 genotype (Hayes et al. 2008a), we did not include genotype in the multiple regression model here because of multicollinearity with PROP bitterness, which would inflate the p values for the collinear terms (Tabachnick and Fidell 2000). The two common approaches to reduce multi-collinearity are to increase sample size or to drop one of the collinear variables. The present study was not powered with a large sample size to partition out the unique effects of PROP bitterness on intake of vegetables beyond the influence of TAS2R38. Sex was also not added into the multiple regression models because men and women did not vary significantly with regard to quinine bitterness or vegetable intake standardized to energy intake (see “Results” below), and sex did not contribute significantly in the final models. For the analysis, variables were transformed for normality and multivariate outliers, which unduly influenced the regression line identified via standardized residual and Mahalanobis distance criteria (critical chi-square at p<0.001 with df=independent variables; Tabachnick and Fidell 2000) were removed. For most models, there were no outliers; in any more analysis, no more than two outliers were removed. The semipartial correlation coefficient (sr—unique variance explained by each independent variable) is presented.
A two-way ANOVA and planned comparisons with t tests (error term generated by the ANOVA) (Keppel 1991) was used to analyze the genotype and concentration effects on PROP bitterness. Genotype influences on quinine bitterness and vegetable intake variables were tested for mean differences using t tests.
Results
Participants and Vegetable Intake
The characteristics of the participants are summarized in Table 1. Men were significantly older (p<0.05) and had higher BMIs and waist circumferences (p<0.001) than the women; the level of dietary restraint did not differ across sex.
From food record analysis, the mean (±SEM) daily energy intake (kJ) of women and men was lower than that reported for NHANES 1999–2000 (Wright et al. 2003): women (7,470.1±288.5 vs. 8,485.2±170.7) and men (10,152.0±432.6 vs. 11,819.8±246.4). The lower intakes of energy may have occurred as the present sample had proportionally fewer overweight and obese individuals than NHANES 1999 (27.12% vs. 64.5% for overweight; 5.08% vs. 30.9% for obese) as energy intakes are dependent on level of adiposity (National Academy of Sciences 2002).
Also from food records, Food Pyramid vegetable group servings averaged 3.23±0.22 (range 0.54 to 7.88) per day across the sample and were significantly greater in men than in women (Table 1, t=−2.56, p=0.01). The average servings for our cohort were approximately 0.2 servings below those reported from the USDA Continuing Serving of Food Intakes by Individuals, 1994–1996, 1998 (Cook and Friday 2000b) for women (2.61 vs. 2.8) and men (3.79 vs. 4.0). Because the servings of Food Pyramid vegetable group were significantly associated with energy intake (r=0.42, p<0.001), they were standardized to 1,000 kJ of energy intake for the analyses, which removed any sex differences (t=0.25, p=0.80).
Servings of the Pyramid vegetable group from the food records were significantly correlated with servings of vegetables from the food frequency questionnaire, including the general question of vegetable servings and those from the vegetable groups (bivariate correlations falling between 0.30 and 0.38, p<0.05). Men and women did not differ significantly on servings of vegetables from the food frequency questionnaire (Table 1).
Taste Phenotype and Genotype
Consistent with prior reports (e.g., Duffy et al. 2004c; Kalmus 1958; Lawless 1980), the distribution of PROP detection thresholds has bimodal (not shown). To show the diversity in suprathreshold bitterness of PROP, the bottom quartile with the lowest ratings for 3.2 mM PROP (near saturation) were classified as nontasters, the top quartile with the highest ratings were classified as supertasters and the middle two quartiles as medium tasters (Fig. 1). Mean bitterness of 3.2 mM PROP was not significantly different in men (35.45± 3.60) versus women (35.88±3.75) (t=0.08, p=0.94). Number of fungiform papilla varied from 11.75 to 42.5, with a greater mean density in women (26.5±1.4) than in men (23.0±1.2) (t=1.98, p=0.05). PROP bitterness and fungiform papillae number were positively correlated (r=0.44, p<0.001).
Fig. 1.

Left, PROP functions by TAS2R38 genotype (Entrez GeneID 5726). Right, PROP functions by psychophysical criteria based on the bitterness of 3.2 mM PROP for subjects with common genotypes
The PROP bitterness functions for adults with the three common genotypes are shown in Fig. 1. The associations between TAS2R38 and taste phenotypes (PROP bitterness and fungiform papillae density) in the present sample match those from other samples from our lab (Duffy et al. 2004b; Hayes et al. 2008a). The two-way ANOVA had significant main effects of genotype (F(2,52)=37.551, p<0.0001) and concentration (F(4,208)=194.10, p<0.0001) and significant genotype by concentration interaction (F(8,208)=18.55, p<0.0001). In pairwise comparisons, the three functions differ significantly for the four highest concentrations of PROP: PAV homozygotes>heterozygotes>AVI homozygotes, at least p<0.05.
There were more men than expected in the heterozygote group and more women than expected in the PAV/PAV group (χ2(2)=9.78, p<0.01); this sex difference was not observed in a larger sample (Duffy et al. 2004b; Hayes et al. 2008a). To avoid a potential sex confound, the genotypes were pooled to compare PAV allele carriers (PAV homozygotes and PAV/AVI heterozygotes) against the AVI homozygotes, resulting in nine vs. 15 women, and 11 vs. 20 men in the two groups, respectively. Number of fungiform papillae did not show significant mean difference across the two genotype groups (t=1.28, p=0.20), consistent with other analyses (Hayes et al. 2008a).
Relationships Between Phenotype, Genotype, and Quinine Bitterness
The bitterness of quinine averaged 41.56±2.55 SEM (between strong and very strong) and did not differ significantly between men and women (t=0.48, p=0.63). In separate bivariate associations, those who tasted quinine as more bitter also tasted PROP as more bitter (r=0.33, p<0.01) and had higher density of fungiform papillae (r=0.27, p<0.05). Adding both measures of phenotype into multiple regression predicted significant variance in quinine bitterness (R2=0.13, p<0.01) with significant contributions only from PROP bitterness (sr=0.31, p<0.05). Consistent with reports published previously (Hayes et al. 2008a), the mean quinine bitterness was not significantly different in PAV carriers as compared with AVI homozygotes (t=0.55, p=0.58) in this cohort. Additionally, PAV carriers were not more likely than AVI homozygotes to report that the quinine was equal to or greater than strong (χ2=0.24, p=0.62).
Vegetable Intake by Taste Phenotype
In multiple regression analysis, variance in the number of servings of Pyramid vegetable group per 1,000 kJ was predicted by the taste phenotypes (PROP bitterness and fungiform papilla) and sex (R2=0.20, p<0.01) with separate contributions from PROP bitterness (sr=−0.44, p<0.01; Fig. 2) and fungiform papilla number (sr=0.23, p=0.06). Notably, the patterns were in opposite directions: Individuals who tasted PROP as least bitter yet had more fungiform papillae consumed more servings of vegetables.
Fig. 2.

Scatterplot showing the relationship between PROP bitterness rated on the general Labeled Magnitude Scale (Bartoshuk et al. 2005a) and Pyramid vegetable servings (standardized to energy intakes). Bivariate correlation coefficient is reported
Taste phenotypes (PROP bitterness, fungiform papillae) predicted significant variance in the all vegetables group (R2=0.11, p=0.05) and tended to predict variance in the general vegetable question (R2=0.06, p=0.17) and the A&C-rich vegetable group (R2=0.09, p=0.07). PROP bitterness showed negative association with vegetable intakes, being a significant predictor for servings of the all vegetable (sr=−0.26, p=0.05) and the A&C-rich vegetable (sr=−0.30, p<0.05) groups and tended toward being a predictor of the general vegetable question (sr=−0.25, p= 0.06). Fungiform papilla density had a positive relationship with vegetable variables, but it was only a significant predictor for the all vegetables measure (sr=0.27, p<0.05).
Figure 3 provides an example of the joint influence of PROP and fungiform papilla on intake of vegetables. For the PROP nontaster, those with higher number of fungiform papillae reported a significantly higher intake of vegetables than those with a lower number of these papillae (groups defined at the median for the taster group). This effect was seen across all of the vegetable groups but is only shown for the all vegetable group from the food frequency questionnaire. Consistent with multiple regression analysis, the PROP supertasters consumed fewer vegetables than PROP non-tasters. Fungiform papillae number had less influence of vegetable intake in the supertasters than in the nontasters.
Fig. 3.

Yearly consumption of all vegetables from the food frequency questionnaire (Mean ± SEM) among groups defined by phenotype (left graph—3.2 mM PROP bitterness) and genotype (right graph—TAS2R38 receptor) for all subjects within that group (black bar), and for that group subdivided on the basis of fungiform papillae number median split, where white bars are below and hatched bars are above the median, respectively. Within nontasters (left graph, left panel) and AVI homozygotes (right graph, left panel), comparing intake across the low and high papillae groups revealed significant differences (p< 0.05); within the supertaster phenotype (left graph, right panel), the low/high papilla comparison was a trend (p<0.1). For all subjects irrespective of papillae number (black bars), nontasters and AVI homozygotes ate vegetables more frequently (p<0.05) than super-tasters or PAV*, respectively
Vegetable Intake by Taste Genotype
AVI homozygotes reported consuming significantly more servings of vegetables than did individuals who carried at least one copy of the PAV allele, according to Pyramid vegetable servings from the food records and according to the question of servings generally eaten and the vegetable groups from the food frequency questionnaire (Fig. 4). Number of fungiform papilla among the nontaster genotype explained additional variance in vegetable intake as seen with the nontaster phenotype (Fig. 3).
Fig. 4.
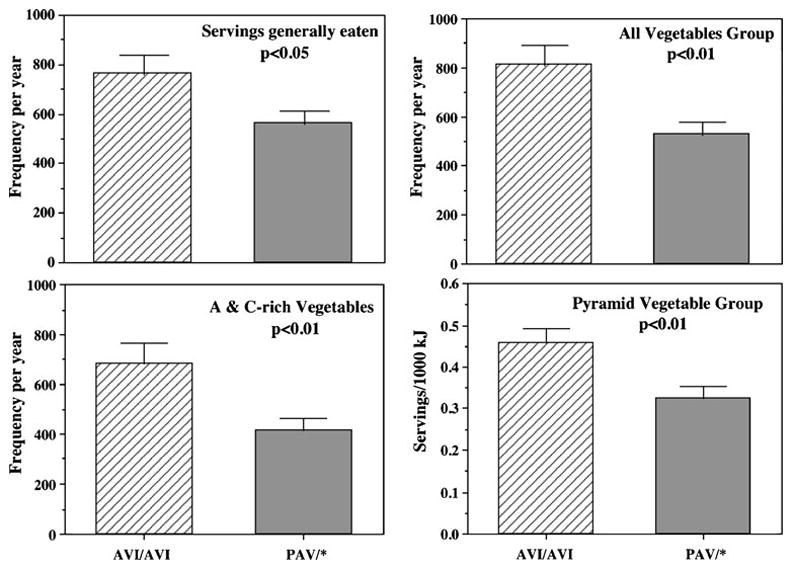
Mean±SEM servings of vegetables for AVI homozygotes and PAV allele carriers (PAV/AVI heterozygotes and PAV/PAV homozygotes) based on two complementary assessments: food frequency questionnaire (expressed per year) and food records (expressed per 1,000 kJ)
Discussion
In this laboratory-based study of college-aged adults, vegetable intake varied with taste phenotypes and TAS2R38 receptor genotype. Carriers of the functional (PAV) allele consumed less vegetables that did AVI/AVI homozygotes, and the bitterness of PROP was negatively correlated with intake. PROP bitterness and TAS2R38 genotype predicted intake of all vegetables (e.g., Pyramid vegetable intake, food frequency questionnaire vegetables shown in Table 1), which is consistent with previous phenotypic findings from our laboratory (Basson et al. 2005; Dinehart et al. 2006) and others (Bell and Tepper 2006; Turnbull and Matisoo-Smith 2002). Present data suggest that the effects of TAS2R38 genotype on vegetable bitterness seen previously in a US cohort (Sandell and Breslin 2006) also extend to consumption. To date, only two epidemiological trials have explored putative relationships between TAS2R38 and vegetable intake, with conflicting results (cf. Timpson et al. 2005 and Sacerdote et al. 2007). Our laboratory-based study provides independent confirmation of the latter, suggesting that the taste genetic–intake relationship exists when using valid measures of vegetable consumption, controlling for mediating factors known to influence vegetable intake (e.g., income and availability), and minimizing reporting errors that plague dietary assessment (e.g., dietary restraint). Additionally, we note that the relationship between TAS2R38 and vegetable intake was not limited to members of the glucosinolate-containing cruciferous family (e.g., brussels sprouts, and kale), which contain compounds that share the N–C=S moiety with PROP and PTC. Genetic differences in taste and oral sensations may influence early acceptance of oral sensory characteristics of vegetables, particularly bitterness, which may generalize to the acceptance and willingness to consume all vegetables. Markers of variation in taste may serve as a biomarker of habitual consumption of vegetables and thus serve as tools to study how diet influences chronic disease risk (Sacerdote et al. 2007; Duffy et al. 2004a, b, c).
Vegetables are perceptually complex stimuli, as they present a wide array of oral sensations to consumer that both promote and deter vegetable intake. Genetically determined variation in orosensation likely influences many of these sensations to affect ingestion behaviors. The primary approach in studying relationships between dietary behavior and sensation has been to examine bitterness as a hindrance to consumption (Drewnowski and Gomez-Carneros 2000). However, it has recently become apparent that we need to expand our approach to include sensory factors that have positive influences on vegetable preference and intake. As an example, we reported enhanced prediction of alcohol intake from tastes of alcoholic beverages when both perceived bitterness and sweetness were included in the analysis (Lanier et al. 2005). Subsequently, we used a similar approach to predict vegetable intake, and found that our ability to explain the variability in reported vegetable intake was greatly enhanced when we also considered the amount of endogenous sweetness (Dinehart et al. 2006). According to preliminary evidence, supertasters can benefit from lightly sweetening vegetables, thus balancing sweetness and bitterness, to enhance the acceptability of traditionally disliked vegetables (brussels sprouts, kale, and asparagus) (Napoleone et al. 2007).
The present study also found a positive relationship between fungiform papilla number and vegetable intake, particularly in the nontasters by phenotype or genotype. That fungiform papilla number shows an effect opposite to that from PROP on vegetable behaviors is consistent with an earlier finding from our laboratory. We found that those who had higher numbers of fungiform papillae reported greater liking for vegetables (Duffy and Bartoshuk 2000). Although fungiform papilla density correlated with PROP bitterness in the present study and in others (Bajec and Pickering 2008; Essick et al. 2003; Tepper and Nurse 1997), it is a separate taste phenotype that provides unique contribution to the prediction of dietary behaviors (Duffy et al. 2004c; Hayes and Duffy 2008; Hayes et al. 2010). Greater density of fungiform papilla likely associates with more intense textural and retronasal olfactory sensations from foods and beverages, which may add to the level of liking and increased consumption of vegetables in the nontaster. Although consumers often give texture as the reason for not liking certain foods (e.g., negative attributes such as sticky, soggy, or slimy textures; Cardello 1996), an elevated number of fungiform papillae for the PROP nontaster likely associates with overall enhancement of the oral sensations for vegetables (including endogenous sweetness), which promotes vegetable liking and consumption. In contrast, among PAV carriers, and PROP super-tasters, the bitterness supersedes the positive effects of more fungiform papillae. Thus, it seems that fungiform papillae number may be especially salient for vegetables, but only for some individuals.
As discussed elsewhere (Hayes et al. 2008a), super-tasters (defined via PROP bitterness) taste the bitterness of quinine more intensely than do nontasters not because of the TAS2R38 genotype per se but because they appear to have heightened oral sensations regardless of quality. Indeed, diverse evidence indicates that quinine bitterness occurs via a TAS2R38-independent mechanism (Delwiche et al. 2001; Hansen et al. 2006; Hayes et al. 2008a). One hypothesis suggests that the correlation between quinine and PROP bitterness may be an underlying third variable, namely greater numbers of fungiform papilla. This view was partially supported in the present study as quinine bitterness was predicted by the perceived bitterness of PROP and the number of fungiform papillae, but not by TAS2R38 genotype. However, papillae may not be the only determinant, as emerging evidence suggests that it cannot completely account for the heightened oral sensations in some individuals (Bajec and Pickering 2008; Hayes et al. 2008a); indeed, we found here and elsewhere that PROP bitterness continues to predict heightened response even after controlling for papillae number or TAS2R38 genotype. This suggests a pressing need for the field to develop additional methods to identify supertasters that are not confounded with receptor genetics (Bajec and Pickering 2008; Green and Hayes 2004; Hayes et al. 2008a).
The association between TAS2R38 genotype and vegetable intake is consistent with associations in adults between PROP bitterness and vegetable preference (Drewnowski et al. 2000; Kaminski et al. 2000; Keller et al. 2002; Turnbull and Matisoo-Smith 2002), liking (Dinehart et al. 2006) and intake found in the present sample, and another study of older men (Basson et al. 2005). The association also supports that bitter receptor genetics influences the acquisition of preference and thus willingness to consume vegetables as shown in studies with preschool children (Keller et al. 2002; Turnbull and Matisoo-Smith 2002). Genetic variation in oral sensation could also influence chronic disease risk through ingestive behaviors related to alcohol use (Duffy et al. 2004b; Hayes et al. 2008b; Lanier et al. 2005; Wang et al. 2007), cardiovascular disease (Duffy et al. 2004a), and cancer (Drewnowski et al. 2000). Related to cancer risk, preliminary data find that men who tasted PROP as most bitter had the most adenomatous polyps (Basson et al. 2005), which are considered the precursor of most large-bowel cancers. Present data also support that PROP bitterness serves as a proxy for assessing TAS2R38 effects on vegetable intake in a sample of young adults. However, using only the TAS2R38 genotype to predict vegetable intake behaviors may be highly limiting because this genotype as yet does not appear to explain variation in oral sensation beyond those related to the thiocyanate moiety (N–C=S) containing compounds. Notably, other taste receptor genes may contain functional polymorphisms that have the potential to impact food choice and dietary behavior (e.g., Duffy et al. 2009; Kuhn et al. 2004; Shiffman et al. 2008). Nonetheless, PROP bitterness has proven utility as a measure of variation in oral sensation, which is affected by environmental factors (e.g., sex hormones and exposure to pathology). Using multiple measures of oral sensory variation has proved to increase the ability to predict dietary behaviors (Bajec and Pickering 2010; Duffy et al. 2009; Hayes and Duffy 2008; Hayes et al. 2010)
The present study has a number of limitations. The sample was homogeneous in order to maximize the ability to reveal links between taste genetics and vegetable intake. Thus, the findings may not generalize to other groups. PROP may not be a significant predictor of genetic taste influences on vegetable intake in those who have been exposed to environmental insults, resulting in damage to the taste system (Bartoshuk et al. 1996). Although the size of the sample is smaller than in some previous studies that have examined PROP influences on dietary behaviors, power analysis indicates that it was sufficient to detect medium to large effects. Indeed, we found significant effects that were logically consistent with other studies performed by different investigators in multiple locations; this suggests that genetic variation in oral sensation may be a meaningful driver of dietary behavior, at least for vegetables. Finally, unlike prior work (Dinehart et al. 2006), the present study did not include measures of vegetable sensations or liking as intermediate variable between bitter phenotype and reported intake. However, given extant literature indicating that variability in vegetable intake is predicted by these variables (Drewnowski et al. 1999, 2000; Kaminski et al. 2000; Keller et al. 2002; Sandell and Breslin 2006; Turnbull and Matisoo-Smith 2002), we believe the most parsimonious explanation is to conclude that relationships between bitter receptor genetics and vegetable intake are wholly mediated through sensation and liking, and are not due to a spurious relationship with some unknown third variable. As genotyping costs continue to plummet, this work has potential for translation to health promotion efforts and individualized dietary recommendations.
Acknowledgments
The authors thank Julie M. Peterson, MS, RD and Megan N. Phillips, MS, RD for collecting the data; and Denise Anamani MA, CLSpMB for obtaining the blood samples. This work was supported by USDA Hatch Project CONS00827 and NIH grant numbers DC00283 and AA09379.
Contributor Information
Valerie B. Duffy, Email: valerie.duffy@uconn.edu, Department of Allied Health Sciences, College of Agriculture and Natural Resources, University of Connecticut, 358 Mansfield Road, Unit 2101, Storrs, CT 06269-2101, USA
John E. Hayes, Department of Food Science, College of Agricultural Sciences, The Pennsylvania State University, University Park, PA 16802, USA
Andrew C. Davidson, Department of Genetics, Yale University School of Medicine, New Haven, CT 06520, USA
Judith R. Kidd, Department of Genetics, Yale University School of Medicine, New Haven, CT 06520, USA
Kenneth K. Kidd, Department of Genetics, Yale University School of Medicine, New Haven, CT 06520, USA
Linda M. Bartoshuk, Department of Community Dentistry and Behavioral Science, University of Florida, Gainesville, FL, USA
References
- Bajec MR, Pickering GJ. Thermal taste, PROP responsiveness, and perception of oral sensations. Physiol Behav. 2008;95(4):581–590. doi: 10.1016/j.physbeh.2008.08.009. [DOI] [PubMed] [Google Scholar]
- Bajec MR, Pickering GJ. Association of thermal taste and PROP responsiveness with food liking, neophobia, body mass index, and waist circumference. Food Qual Prefer. 2010;21(6):589–601. [Google Scholar]
- Bamshad M, Wooding S, Salisbury BA, Stephens JC. Deconstructing the relationship between genetics and race. Nat Rev Genet. 2004;5(8):598–609. doi: 10.1038/nrg1401. [DOI] [PubMed] [Google Scholar]
- Barnicot NA, Harris H, Kalmus H. Taste thresholds of further eighteen compounds and their correlation with P.T.C. thresholds. Annals of Eugenics. 1951;16:119–128. doi: 10.1111/j.1469-1809.1951.tb02464.x. [DOI] [PubMed] [Google Scholar]
- Bartoshuk LM. Comparing sensory experiences across individuals: recent psychophysical advances illuminate genetic variation in taste perception. Chem Senses. 2000;25(4):447–460. doi: 10.1093/chemse/25.4.447. [DOI] [PubMed] [Google Scholar]
- Bartoshuk LM, Duffy VB, Reed D, Williams A. Supertasting, earaches and head injury: genetics and pathology alter our taste worlds. Neurosci Biobehav Rev. 1996;20(1):79–87. doi: 10.1016/0149-7634(95)00042-d. [DOI] [PubMed] [Google Scholar]
- Bartoshuk LM, Fast K, Snyder DJ. Differences in our sensory worlds: invalid comparisons with labeled scales. Curr Dir Psychol Sci. 2005a;14(3):122–125. [Google Scholar]
- Bartoshuk LM, Snyder DJ, Grushka M, Berger AM, Duffy VB, Kveton JF. Taste damage: previously unsuspected consequences. Chem Senses. 2005b;30(Suppl 1):i218–i219. doi: 10.1093/chemse/bjh192. [DOI] [PubMed] [Google Scholar]
- Basson MD, Bartoshuk LM, Dichello SZ, Panzini L, Weiffenbach JM, Duffy VB. Association between 6-n-propylthiouracil (PROP) bitterness and colonic neoplasms. Dig Dis Sci. 2005;50 (3):483–489. doi: 10.1007/s10620-005-2462-7. [DOI] [PubMed] [Google Scholar]
- Bathalon G, Tucker K, Hays N, Vinken A, Greenberg A, McCrory M, Roberts S. Psychological measures of eating behavior and the accuracy of 3 common dietary assessment methods in healthy postmenopausal women. Am J Clin Nutr. 2000;71(3):739–745. doi: 10.1093/ajcn/71.3.739. [DOI] [PubMed] [Google Scholar]
- Bell KI, Tepper BJ. Short-term vegetable intake by young children classified by 6-n-propylthoiuracil bitter-taste phenotype. Am J Clin Nutr. 2006;84(1):245–251. doi: 10.1093/ajcn/84.1.245. [DOI] [PubMed] [Google Scholar]
- Berkley Nutrition Services. 2003 www.nutritionquest.com/validation/html.
- Blakeslee AF. Genetics of sensory thresholds: taste for phenyl thio carbamide. Proc Natl Acad Sci. 1932;18:120–130. doi: 10.1073/pnas.18.1.120. [DOI] [PMC free article] [PubMed] [Google Scholar]
- Bufe B, Breslin PA, Kuhn C, Reed DR, Tharp CD, Slack JP, Kim UK, Drayna D, Meyerhof W. The molecular basis of individual differences in phenylthiocarbamide and propylthiouracil bitterness perception. Curr Biol. 2005;15(4):322–327. doi: 10.1016/j.cub.2005.01.047. [DOI] [PMC free article] [PubMed] [Google Scholar]
- Cardello A. The role of the human senses in food acceptance. In: Meiselman HL, MacFie HJH, editors. Food choice, acceptance, and consumption. 1. Blackie Academic & Professional; London: 1996. [Google Scholar]
- CDC . Fruit and vegetable consumption among adults: United States, 2005. Morb Mortal (MMWR) 2007;56(10):213–217. [PubMed] [Google Scholar]
- Cook A, Friday J. Pyramid servings database for USDA survey food codes version 1 [Internet] USDA, Agricultural Research Service; 2000a. http://www.ars.usda.gov/Services/docs.htm?docid=8503. [Google Scholar]
- Cook A, Friday J. PYRAMID SERVINGS INTAKES By US Children and Adults 1994–96, 1998 [Internet] USDA, Agricultural Research Service; 2000b. http://www.ars.usda.gov/ba/bhnrc/cnrg. [Google Scholar]
- de Castro JM. Methodology, correlational analysis, and interpretation of diet diary records of the food and fluid intake of free-living humans. Appetite. 1994;23(2):179–192. doi: 10.1006/appe.1994.1045. [DOI] [PubMed] [Google Scholar]
- Delwiche JF, Buletic Z, Breslin PA. Relationship of papillae number to bitter intensity of quinine and PROP within and between individuals. Physiol Behav. 2001;74(3):329–337. doi: 10.1016/s0031-9384(01)00568-6. [DOI] [PubMed] [Google Scholar]
- Dick DM, Rose RJ, Viken RJ, Kaprio J, Koskenvuo M. Exploring gene-environment interactions: socioregional moderation of alcohol use. J Abnorm Psychol. 2001;110(4):625–632. doi: 10.1037//0021-843x.110.4.625. [DOI] [PubMed] [Google Scholar]
- Dinehart ME, Hayes JE, Bartoshuk LM, Lanier SL, Duffy VB. Bitter taste markers explain variability in vegetable sweetness, bitterness, and intake. Physiol Behav. 2006;87(2):304–313. doi: 10.1016/j.physbeh.2005.10.018. [DOI] [PubMed] [Google Scholar]
- Drewnowski A, Gomez-Carneros C. Bitter taste, phytonutrients, and the consumer: a review. Am J Clin Nutr. 2000;72(6):1424–1435. doi: 10.1093/ajcn/72.6.1424. [DOI] [PubMed] [Google Scholar]
- Drewnowski A, Henderson SA, Shore AB. Taste responses to naringin, a flavonoid, and the acceptance of grapefruit juice are related to genetic sensitivity to 6-n-propylthiouracil. Am J Clin Nutr. 1997;66:391–397. doi: 10.1093/ajcn/66.2.391. [DOI] [PubMed] [Google Scholar]
- Drewnowski A, Henderson SA, Levine A, Hann C. Taste and food preferences as predictors of dietary practices in young women. Public Health Nutr. 1999;2(4):513–519. doi: 10.1017/s1368980099000695. [DOI] [PubMed] [Google Scholar]
- Drewnowski A, Henderson SA, Hann CS, Berg WA, Ruffin MT. Genetic taste markers and preferences for vegetables and fruit of female breast care patients. J Am Diet Assoc. 2000;100(2):191–197. doi: 10.1016/S0002-8223(00)00061-4. [DOI] [PubMed] [Google Scholar]
- Duffy VB, Bartoshuk LM. Food acceptance and genetic variation in taste. J Am Diet Assoc. 2000;100(6):647–655. doi: 10.1016/S0002-8223(00)00191-7. [DOI] [PubMed] [Google Scholar]
- Duffy V, Lucchina L, Bartoshuk L. Genetic variation in taste: potential biomarker for cardiovascular disease risk? In: Prescott J, Tepper BJ, editors. Genetic variations in taste sensitivity: measurement, significance and implications. Dekker; New York: 2004a. pp. 195–228. [Google Scholar]
- Duffy VB, Davidson AC, Kidd JR, Kidd KK, Speed WC, Pakstis AJ, Reed DR, Snyder DJ, Bartoshuk LM. Bitter receptor gene (TAS2R38), 6-n-propylthiouracil (PROP) bitterness and alcohol intake. Alcohol Clin Exp Res. 2004b;28(11):1629–1637. doi: 10.1097/01.ALC.0000145789.55183.D4. [DOI] [PMC free article] [PubMed] [Google Scholar]
- Duffy VB, Peterson J, Bartoshuk LM. Associations between taste genetics, oral sensations and alcohol intake. Physiol Behav. 2004c;82(2–3):435–445. doi: 10.1016/j.physbeh.2004.04.060. [DOI] [PubMed] [Google Scholar]
- Duffy VB, Hayes JE, Sullivan BS, Faghri P. Surveying food/beverage liking: a tool for epidemiological studies to connect chemosensation with health outcomes. Ann NY Acad Sci. 2009;1170:558–568. doi: 10.1111/j.1749-6632.2009.04593.x. [DOI] [PubMed] [Google Scholar]
- Essick GK, Chopra A, Guest S, McGlone F. Lingual tactile acuity, taste perception, and the density and diameter of fungiform papillae in female subjects. Physiol Behav. 2003;80(2–3):289–302. doi: 10.1016/j.physbeh.2003.08.007. [DOI] [PubMed] [Google Scholar]
- Faul F, Erdfelder E, Lang AG, Buchner A. G*Power 3: a flexible statistical power analysis program for the social, behavioral, and biomedical sciences. Behav Res Methods. 2007;39 (2):175–191. doi: 10.3758/bf03193146. [DOI] [PubMed] [Google Scholar]
- Fox AL. Six in ten “tasteblind” to bitter chemical. Sci News Lett. 1931;9:249. [Google Scholar]
- Gayathri DA, Henderson SA, Drewnowski A. Sensory acceptance of Japanese green tea and soy products is linked to genetic sensitivity to 6-n-propylthiouracil. Nutr Cancer. 1997;29:146–151. doi: 10.1080/01635589709514616. [DOI] [PubMed] [Google Scholar]
- Gorman B, Allison D. Handbook of assessment methods for eating behaviors and weight-related problems. Sage; California: 1995. [Google Scholar]
- Green BG, Hayes JE. Individual differences in perception of bitterness from capsaicin, piperine and zingerone. Chem Senses. 2004;29(1):53–60. doi: 10.1093/chemse/bjh005. [DOI] [PubMed] [Google Scholar]
- Green BG, Dalton P, Cowart B, Shaffer G, Rankin K, Higgins J. Evaluating the ‘Labeled Magnitude Scale’ for measuring sensations of taste and smell. Chem Senses. 1996;21(3):323–334. doi: 10.1093/chemse/21.3.323. [DOI] [PubMed] [Google Scholar]
- Hansen JL, Reed DR, Wright MJ, Martin NG, Breslin PA. Heritability and genetic covariation of sensitivity to PROP, SOA, quinine HCl, and caffeine. Chem Senses. 2006;31(5):403–413. doi: 10.1093/chemse/bjj044. [DOI] [PMC free article] [PubMed] [Google Scholar]
- Hayes JE, Duffy VB. Oral sensory phenotype identifies level of sugar and fat required for maximal liking. Physiol Behav. 2008;95(1–2):77–87. doi: 10.1016/j.physbeh.2008.04.023. [DOI] [PMC free article] [PubMed] [Google Scholar]
- Hayes JE, Bartoshuk LM, Kidd JK, Duffy VB. Supertasting and PROP bitterness depends on more than the TAS2R38 gene. Chem Senses. 2008a;33(3):255–265. doi: 10.1093/chemse/bjm084. [DOI] [PubMed] [Google Scholar]
- Hayes JE, Wallace MR, Bartoshuk LM, Herbstman D, Duffy VB. Novel TAS2R SNP associations with taste sensations, liking or intake for alcoholic and bitter non-alcoholic beverages. Chem Senses. 2008b;33(8):S40–S40. [Abstract] [Google Scholar]
- Hayes JE, Sullivan BS, Duffy VB. Explaining variability in sodium intake through oral sensory phenotype, salt sensation and liking. Physiol Behav. 2010;100(4):369–380. doi: 10.1016/j.physbeh.2010.03.017. [DOI] [PMC free article] [PubMed] [Google Scholar]
- Herman C, Polivy J. Anxiety, restraint, and eating behavior. J Abnorm Psychol. 1975;84:666–672. [PubMed] [Google Scholar]
- Herman C, Polivy J. Restrained eating. In: Stunkard A, editor. Obesity. Saunders; Philadelphia: 1980. pp. 208–225. [Google Scholar]
- Intranuovo LR, Powers AS. The perceived bitterness of beer and 6-n-propylthiouracil (PROP) taste sensitivity. Ann NY Acad Sci. 1998;855:813–815. doi: 10.1111/j.1749-6632.1998.tb10665.x. [DOI] [PubMed] [Google Scholar]
- Kalmus H. Improvements in the classification of the taster genotypes. Ann Hum Genet. 1958;22(3):222–230. doi: 10.1111/j.1469-1809.1958.tb01416.x. [DOI] [PubMed] [Google Scholar]
- Kaminski LC, Henderson SA, Drewnowski A. Young women’s food preferences and taste responsiveness to 6-n-propylthiouracil (PROP) Physiol Behav. 2000;68(5):691–697. doi: 10.1016/s0031-9384(99)00240-1. [DOI] [PubMed] [Google Scholar]
- Keller KL, Steinmann L, Nurse RJ, Tepper BJ. Genetic taste sensitivity to 6-n-propylthiouracil influences food preference and reported intake in preschool children. Appetite. 2002;38(1):3–12. doi: 10.1006/appe.2001.0441. [DOI] [PubMed] [Google Scholar]
- Keppel G. Design and analysis: a researcher’s handbook. Prentice Hall; Englewood Cliffs: 1991. [Google Scholar]
- Kidd K, Davidson A, Pakstis A, Speed W, Bartoshuk L, Duffy V, JR K. PTC-tasting and negative evidence for balancing selection (abstract) Am J Hum Genet. 2004;(Suppl 75) abstract 1175. [Google Scholar]
- Kim UK, Jorgenson E, Coon H, Leppert M, Risch N, Drayna D. Positional cloning of the human quantitative trait locus underlying taste sensitivity to phenylthiocarbamide. Science. 2003;299 (5610):1221–1225. doi: 10.1126/science.1080190. [DOI] [PubMed] [Google Scholar]
- Kuhn C, Bufe B, Winnig M, Hofmann T, Frank O, Behrens M, Lewtschenko T, Slack JP, Ward CD, Meyerhof W. Bitter taste receptors for saccharin and acesulfame K. J Neurosci. 2004;24 (45):10260–10265. doi: 10.1523/JNEUROSCI.1225-04.2004. [DOI] [PMC free article] [PubMed] [Google Scholar]
- Lanier SA, Hayes JE, Duffy VB. Sweet and bitter tastes of alcoholic beverages mediate alcohol intake in of-age undergraduates. Physiol Behav. 2005;83(5):821–831. doi: 10.1016/j.physbeh.2004.10.004. [DOI] [PubMed] [Google Scholar]
- Lawless HT. A comparison of different methods used to assess sensitivity to the taste of phenylthiocarbamide (PTC) Chem Senses. 1980;5(3):247–256. [Google Scholar]
- Lock K, Pomerleau J, Causer L, Altmann DR, McKee M. The global burden of disease attributable to low consumption of fruit and vegetables: implications for the global strategy on diet. Bull World Health Organ. 2005;83(2):100–108. [PMC free article] [PubMed] [Google Scholar]
- Macdiarmid J, Blundell J. Assessing dietary intake: who, what and why of under-reporting. Nutr Res Rev. 1998;11(2):231–253. doi: 10.1079/NRR19980017. [DOI] [PubMed] [Google Scholar]
- McBurney D, Collings VB. Introduction to sensation/perception. Prentice-Hall; Englewood Cliffs: 1977. [Google Scholar]
- Miller I, Reedy F. Variation in human taste bud density and taste intensity perception. Physiol Behav. 1990;47:1213–1219. doi: 10.1016/0031-9384(90)90374-d. [DOI] [PubMed] [Google Scholar]
- Napoleone G, Conliffe C, Hayes JE, Kneeland K, Sullivan BS, Duffy VB. Modifying vegetable tastes to improve liking. J Am Diet Assoc. 2007;107(8):A55. [Abstract] [Google Scholar]
- National Academy of Sciences. Dietary reference intakes for energy, carbohydrate, fiber, fat, fatty acids, cholesterol, protein and amino acids. Institute of Medicine; Washington: 2002. [DOI] [PubMed] [Google Scholar]
- Prescott J, Bartoshuk LM, Prutkin J. 6-n-Propylthiouracil tasting and the perception of nontaste oral sensations. In: Prescott J, Tepper BJ, editors. Genetic variation in taste sensitivity. Marcel Dekker; New York: 2004. pp. 89–104. [Google Scholar]
- Prutkin J, Fisher EM, Etter L, Fast K, Gardner E, Lucchina LA, Snyder DJ, Tie K, Weiffenbach J, Bartoshuk LM. Genetic variation and inferences about perceived taste intensity in mice and men. Physiol Behav. 2000;69(1–2):161–173. doi: 10.1016/s0031-9384(00)00199-2. [DOI] [PubMed] [Google Scholar]
- Reed DR. Birth of a new breed of supertaster. Chem Senses. 2008;33:489–491. doi: 10.1093/chemse/bjn031. [DOI] [PMC free article] [PubMed] [Google Scholar]
- Sacerdote C, Guarrera S, Smith GD, Grioni S, Krogh V, Masala G, Mattiello A, Palli D, Panico S, Tumino R, et al. Lactase persistence and bitter taste response: instrumental variables and mendelian randomization in epidemiologic studies of dietary factors and cancer risk. Am J Epidemiol. 2007;166(5):576–581. doi: 10.1093/aje/kwm113. [DOI] [PubMed] [Google Scholar]
- Sandell MA, Breslin PA. Variability in a taste-receptor gene determines whether we taste toxins in food. Curr Biol. 2006;16(18):R792–R794. doi: 10.1016/j.cub.2006.08.049. [DOI] [PubMed] [Google Scholar]
- Schonhof I, Krumbein A, Bruckner B. Genotypic effects on glucosinolates and sensory properties of broccoli and cauliflower. Nahrung-Food. 2004;48(1):25–33. doi: 10.1002/food.200300329. [DOI] [PubMed] [Google Scholar]
- Shiffman D, O’Meara ES, Bare LA, Rowland CM, Louie JZ, Arellano AR, Lumley T, Rice K, Iakoubova O, Luke MM, et al. Association of gene variants with incident myocardial infarction in the Cardiovascular Health Study. Arterioscler Thromb Vasc Biol. 2008;28(1):173–179. doi: 10.1161/ATVBAHA.107.153981. [DOI] [PMC free article] [PubMed] [Google Scholar]
- Snyder DJ, Prescott J, Bartoshuk LM. Modern psychophysics and the assessment of human oral sensation. Adv Otorhinolaryngol. 2006;63:221–241. doi: 10.1159/000093762. [DOI] [PubMed] [Google Scholar]
- Steinmetz KA, Potter JD. Vegetables, fruit, and cancer prevention: a review. J Am Diet Assoc. 1996;96(10):1027–1039. doi: 10.1016/S0002-8223(96)00273-8. [DOI] [PubMed] [Google Scholar]
- Stunkard A, Messick S. The three-factor eating questionnaire to measure dietary restraint, disinhibition, and hunger. J Psychosom Res. 1985;29(1):71–83. doi: 10.1016/0022-3999(85)90010-8. [DOI] [PubMed] [Google Scholar]
- Subar AF, Thompson FE, Kipnis V, Midthune D, Hurwitz P, McNutt S, McIntosh A, Rosenfeld S. Comparative validation of the Block, Willett, and National Cancer Institute food frequency questionnaires: the Eating at America’s Table Study. Am J Epidemiol. 2001;154(12):1089–1099. doi: 10.1093/aje/154.12.1089. [DOI] [PubMed] [Google Scholar]
- Tabachnick BG, Fidell LS. Using multivariate statistics. Allyn and Bacon; Boston: 2000. [Google Scholar]
- Tepper BJ, Nurse RJ. Fat perception is related to PROP taster status. Physiol Behav. 1997;61(6):949–954. doi: 10.1016/s0031-9384(96)00608-7. [DOI] [PubMed] [Google Scholar]
- Tepper BJ, Ullrich NV. Influence of genetic taste sensitivity to 6-n-propylthiouracil (PROP), dietary restraint and disinhibition on body mass index in middle-aged women. Physiol Behav. 2002;75 (3):305–312. doi: 10.1016/s0031-9384(01)00664-3. [DOI] [PubMed] [Google Scholar]
- Timpson NJ, Christensen M, Lawlor DA, Gaunt TR, Day IN, Smith GD. TAS2R38 (phenylthiocarbamide) haplotypes, coronary heart disease traits, and eating behavior in the British-Women’s Heart and Health Study. Am J Clin Nutr. 2005;81(5):1005–1011. doi: 10.1093/ajcn/81.5.1005. [DOI] [PubMed] [Google Scholar]
- Turnbull B, Matisoo-Smith E. Taste sensitivity to 6-n-propylthiouracil predicts acceptance of bitter-tasting spinach in 3–6-y-old children. Am J Clin Nutr. 2002;76(5):1101–1105. doi: 10.1093/ajcn/76.5.1101. [DOI] [PubMed] [Google Scholar]
- USDA. Food and Nutrient Intakes by Individuals in the United States, by Sex and Age, 1994–96. Nationwide Food Surveys Report No. 96–2 [Internet] 1998 http://www.ars.usda.gov/SP2Userfiles/Place/12355000/pdf/3yr_py.PDF.
- US Department of Agriculture, US Department of Health and Human Services. [Accessed on August 9, 2010];Report of the Dietary Guidelines Advisory Committee on the Dietary Guidelines for Americans, 2010. 2010 Available at: www.cnpp.usda.gov/DGAs2010-DGACReport.htm.
- Wang JC, Hinrichs AL, Bertelsen S, Stock H, Budde JP, Dick DM, Bucholz KK, Rice J, Saccone N, Edenberg HJ, et al. Functional variants in TAS2R38 and TAS2R16 influence alcohol consumption in high-risk families of African-American origin. Alcohol Clin Exp Res. 2007;31(2):209–215. doi: 10.1111/j.1530-0277.2006.00297.x. [DOI] [PubMed] [Google Scholar]
- Whitehead MC, Beeman CS, Kinsella BA. Distribution of taste and general sensory nerve endings in fungiform papillae of the hamster. Am J Anat. 1985;173:185–201. doi: 10.1002/aja.1001730304. [DOI] [PubMed] [Google Scholar]
- Wright J, Wang C, Kennedy-Stephenson J, Ervin R. Dietary intake of ten key nutrients for public health, United States: 1999–2000. 334. National Center for Health Statistics; Hyattsville: 2003. [PubMed] [Google Scholar]
- Zuniga JR, Chen N, Miller IJ., Jr Effects of chorda-lingual nerve injury and repair on human taste. Chem Senses. 1994;19(6):657–665. doi: 10.1093/chemse/19.6.657. [DOI] [PubMed] [Google Scholar]