

Abstract
Objectives. We estimated national and state-level potential medical care cost savings achievable through modest reductions in the prevalence of several diseases associated with the same lifestyle-related risk factors.
Methods. Using Medical Expenditure Panel Survey Household Component data (2003–2005), we estimated the effects on medical spending over time of reductions in the prevalence of diabetes, hypertension, and related conditions amenable to primary prevention by comparing simulated counterfactual morbidity and medical care expenditures to actual disease and expenditure patterns. We produced state-level estimates of spending by using multivariate reweighting techniques.
Results. Nationally, we estimated that reducing diabetes and hypertension prevalence by 5% would save approximately $9 billion annually in the near term. With resulting reductions in comorbidities and selected related conditions, savings could rise to approximately $24.7 billion annually in the medium term. Returns were greatest in absolute terms for private payers, but greatest in percentage terms for public payers. State savings varied with demographic makeup and prevailing morbidity.
Conclusions. Well-designed interventions that achieve improvements in lifestyle-related risk factors could result in sufficient savings in the short and medium term to substantially offset intervention costs.
The recent health care reform debate has heightened interest in the potential for national medical cost savings from investment in public health and disease prevention. National-level estimates are informative about the expected magnitude and distribution of returns to such investment across the various payers in the health care system. However, neither the magnitude nor the distribution of returns is likely to be uniform across states. Age, household income, and race/ethnicity are important correlates of the overall disease burden, and variation in the proportions of the population that are elderly, poor, and employed affect the distribution of cost burdens among payers. Because state governments likely will bear a significant portion of the investment costs, the states will benefit from savings estimates that take into account differences in the relevant demographic and economic characteristics affecting potential returns. Estimates of potential medical cost savings can provide guidance to states and other stakeholders on the extent to which outlays for prevention programs may be offset by reduced medical care spending.
Because many chronic conditions stem from similar, largely lifestyle-related risk factors, such as smoking, poor diet, or inadequate physical activity, primary prevention programs aimed at addressing these causes have the potential to affect multiple conditions.1 Research suggests that even small increases in exercise, improvements in nutrition, and continued reduction in tobacco use can have measurable effects on disease.2–5
Risk factor reduction is likely to yield some savings in the short run by reducing the onset of uncomplicated disease, but the largest savings are likely to occur in the medium and longer runs because costly complications are avoided. The long-term horizon may reduce incentives for investment in primary prevention, particularly in the private sector where the original investor may expect to realize only some of the long-run return on investment. For example, few Americans have a single health insurer throughout their preretirement years, and Medicare becomes the primary payer for almost all US residents at the age of 65 years. Thus, much of the return on an insurer's investment in primary prevention for younger subscribers may accrue to other payers, particularly Medicare. Because the prevalence of chronic disease rises with age, the implications of failing to address modifiable risks at younger ages are higher costs for private insurers and Medicaid for the working-age population in the short run and greater Medicare costs to treat related advanced disease in the longer run. The challenge for public policy is to recognize and fully account for the incidence of both costs and savings over time in assessing the potential for savings from investment in primary prevention.
For our study, we analyzed the excess medical costs associated with 2 common and preventable chronic diseases and the savings that could be realized over time from reductions in the prevalence of these 2 conditions and associated complications. Specifically, we modeled a reduction in the incidence of diabetes and hypertension, which was assumed to be accomplished through diet, exercise, and reduced smoking, and which, over time, would in turn reduce the incidence of some of the most serious and expensive complications of the 2 conditions—such as heart disease, stroke, and kidney disease—and their biological antecedents. We assumed that population-based primary prevention activities lead to reduced disease onset in the short run and, consequently, to reduced complications associated with the avoided diseases and their biological antecedents in the medium run. The assumption of population-based prevention means that intervention costs are not borne by the medical care system. We estimated potential savings at both the state and national levels from a model that took state differences into account.
METHODS
We modeled the development over time of a set of major chronic diseases by drawing on evidence from the literature. The diseases chosen are among the most expensive conditions to treat in the United States6–8 and are amenable to prevention through improvements in nutrition, increases in physical activity, and reductions in smoking, all of which can be central elements in population-based primary prevention.
Specifically, the model examined diabetes and hypertension and a subset of the most important complications associated with those 2 diseases—heart disease, stroke, and kidney disease—and their biological antecedents9–12 over 2 time periods: 1 to 2 years and 5 years or more. We used the term “uncomplicated disease” to refer to diabetes or hypertension occurring individually or together but without the 3 study complications and the term “complicated disease” to refer to diabetes or hypertension occurring with coexisting heart disease, stroke, or kidney disease, as well as selected forms of these 3 diseases occurring without diabetes or hypertension but associated with common biological antecedents. The first time period of 1–2 years represents a plausible time for the effects of primary prevention to be seen13,14; the second period of 5 years or more reflects the time over which intervention effects on complications of the diseases are assumed to be seen. The timing of complications associated with diabetes or hypertension or their antecedents depends on many factors. Research has shown that the risk of the complications we examined is higher among those with diagnosed diabetes, but also 15 years or more before diabetes diagnosis, with further risk elevation after diabetes diagnosis.10 Two hypothetical explanations are that the biological processes leading to complications of the disease begin in advance of diabetes onset or that both diabetes and its complications have the same biological antecedents.9–12 The assumed 5-year period over which reduced onset of complications could be observed was illustrative, but the savings estimates, which were reported in constant 2008 dollars, did not depend on any specific timing assumption.
The model included as complications only those types of heart disease, stroke, or kidney disease associated with diabetes or hypertension or their biological antecedents and therefore likely also to be affected by primary prevention activities. The clinical classification codes for all conditions included in the model, according to the International Classification of Diseases, Ninth Revision,15 are provided in Table 1.
TABLE 1.
Classification of Conditions Included in the Model According to the International Classification of Diseases, Ninth Revision
| Conditions | Clinical Classification Codes |
| Short-run modifiable | |
| Diabetes | 049, 050 |
| Hypertension | 098, 099 |
| Medium-run modifiable | |
| Heart disease | 100, 101, 104, 105, 106, 107 108 |
| Stroke | 109, 110, 111, 112, 113 |
| Renal disease | 156, 157, 158 |
Source. Agency for Healthcare Research and Quality.15
In the model, a primary prevention intervention was assumed to reduce the prevalence of uncomplicated diabetes or hypertension by a fixed percentage in the first period. We assumed that this reduction and the reduction in related biological antecedents led to a proportional reduction in the prevalence of heart disease, stroke, and renal disease in the second period. We did not model any direct first-period effects of the intervention on people who already had diagnosed diabetes or hypertension, either with or without complications, such as reductions in severity, although such reductions are plausible. Furthermore, we assumed that the rate at which complications occurred once a person had diabetes or hypertension was unchanged, although a change in this rate in response to the intervention is also plausible.
Specifically, we assumed a 5% reduction in the population prevalence of uncomplicated diabetes or hypertension in the first period. Recent trends for diabetes alone indicate an average 4.8% annual increase in prevalence between 2000 and 2006, with much of the recent increases attributed to lifestyle factors.16–18 For simplicity, we assumed that movement in and out of the affected population, from backsliding and new conversions, yielded a constant net reduction in the prevalence of both conditions. Thus, the reduction in incidence of diabetes or hypertension was modeled as a 1-time reduction sustained over time, so that estimated savings would be realized annually. We believe this to be a middle-of-the-road assumption. An optimistic assumption would be that prevalence reductions rise over time, and a pessimistic assumption would be that they diminish over time.
Data
The primary data for the analysis were from the 2003 to 2005 waves of the Medical Expenditure Panel Survey Household Component (MEPS-HC).15 The survey collects detailed information on medical utilization and spending by source of payment, insurance coverage, health, and sociodemographic characteristics from a nationally representative sample of the civilian noninstitutionalized population. The analysis sample pooled annual observations on adult respondents (aged ≥ 18 years) from the 3-year period and contained 66 928 observations on 45 431 unique individuals. We used the National Health Expenditure Accounts (NHEAs), which reflect changes over time in both price and quality, to norm our MEPS estimates by source of payment by using a detailed reconciliation of differences between spending included in the MEPS and the NHEA.19a Expenditures were inflated to 2008 dollars by using the Consumer Price Index Medical Care index.
The sampling design of the MEPS does not permit direct state-level estimation. We therefore used data from the US Census Bureau's 2004 to 2006 Current Population Surveys19b (CPSs) to create synthetic state samples of the MEPS data that mimicked the demographic characteristics of each state's population.
Statistical Analysis
We used generalized linear models to estimate spending associated with each disease cluster at the national level. On the basis of statistical testing of alternative specifications,20 we estimated a 1-part model with a log link and assumed a γ error distribution for each annual spending variable (all payers, Medicare, and Medicaid). Samples for the Medicare and Medicaid models were limited to individuals who either reported enrollment in the respective programs or had positive program expenditures on their behalf. The explanatory variables of interest were dummy variables, Cj, indicating respondents with each of the study conditions. Each model also controlled for sociodemographic variables (X) including age, gender, level of education, metropolitan residence, race/ethnicity, poverty status, and health insurance coverage. The expenditure model can be summarized as
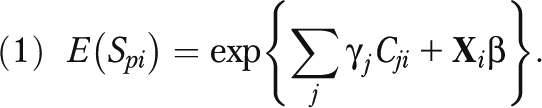 |
To estimate the costs (total and by payer p) associated with each condition j, we calculated the predicted value of spending for each sample member i given their actual profile of conditions and summed these predictions across the weighted sample. This sum forms the baseline spending estimate with the current distribution of conditions in the population. To estimate the total expenditures associated with the conditions, we simulated counterfactual distributions of conditions that eliminated each condition in turn by changing the relevant subsets of dummy variables (Cj) to zero, leaving all other C and X variables at their actual values. We then recalculated the individual predicted spending values and again summed the predictions over the population. The difference between the baseline and each counterfactual can be interpreted as the excess costs associated with each condition. Excess costs associated with uncomplicated disease were estimated on the basis of individuals in the MEPS who had diabetes or hypertension but had none of the 3 more advanced conditions. Excess costs associated with heart disease, stroke, or kidney disease were based on persons with the forms of these diseases associated with diabetes, hypertension, or their common and modifiable antecedents. The estimated excess costs are thus mutually exclusive. Persons with uncomplicated disease by definition and by construction do not have the more advanced conditions and vice versa.
We computed the savings from reduced disease prevalence as proportional to the reduction in prevalence. The assumption of proportional reduction in excess costs is equivalent to assuming a random distribution of prevented cases by costliness, in the absence of evidence on which to base a different assumption, such as larger reductions among least costly cases. Thus, for example, a 5% or 10% reduction in the prevalence of a disease would result in medical cost savings equal to 5% or 10% of the excess costs associated with the disease. We present savings estimates for a 5% prevalence reduction. A 10% reduction would generate savings twice as large as the estimates we present; savings from a 2.5% reduction would be half as large as our estimates.
The MEPS-HC multistage probability sample is not designed to represent each state's population. We therefore relied on a propensity score method to estimate state-level medical care savings.21 First, we used pooled 2004–2006 CPS data to estimate the probability of residing in each state as a function of a vector of demographic characteristics common to the MEPS-HC and CPS by using a probit model of state residence of the form
 |
We then used the parameter estimates for βk to compute a predicted probability of residence in state k,  , for each MEPS-HC observation from the appropriate census region (REGr) and constructed sample weight adjustment factors for each state and the District of Columbia.22 The reweighted MEPS-HC observations constituted pseudo-states in which the distribution of social, demographic, economic, and health insurance characteristics closely matched that of the true state populations. To ensure that each pseudo-state sample exactly matched the joint distribution of 3 key characteristics (race/ethnicity, employment, and health insurance) in each state, we used the CPS to calculate the additional weight adjustment factors required.21 We calculated state savings estimates by applying the same modeling strategy described in equation 1 for national estimates to the 4 census region samples. The parameter estimates from the appropriate regional spending model were then applied to each of the 51 synthetic state samples created by the reweighting technique. Regional parameter estimates thus took into account differences in prices and practice patterns across the country.
RESULTS
Of the approximately 216 million US residents represented by our sample, 17.9% had uncomplicated disease and 8.3% had complicated disease. Persons covered by Medicaid or Medicare were more likely than were others to be affected. Among Medicaid recipients, 21.0% had uncomplicated disease and 13.7% had complicated disease. For Medicare recipients, these proportions were 36.5% and 27.9%, respectively. Only 35.6% of Medicare recipients had none of the conditions, compared with 73.8% of the total population and 65.3% of Medicaid recipients.
Excess Costs Associated With Target Conditions
Estimates of the excess annual medical care spending associated with the conditions in the US adult noninstitutionalized population are provided in Table 2. These conditions accounted for $494 billion in national medical spending, which represented 33.9% of annual all-payer spending for this population.
TABLE 2.
Excess Annual Medical Spending in the United States Associated With Conditions Amenable to Primary Prevention in the Short Run and Medium Run
| Conditions | Spending in Billions |
|||
| All Payers, $ (% of Total) | Medicaid, $ (% of Total) | Medicare, $ (% of Total) | All Other Payers, $ (% of Total) | |
| Short-run modifiable | 180 (12.3) | 15 (8.6) | 30 (9.0) | 134 (13.8) |
| Diabetes | 31 (2.1) | 3 (1.7) | 7 (2.0) | 21 (2.2) |
| HBP | 97 (6.6) | 5 (3.0) | 15 (4.6) | 76 (7.7) |
| Diabetes and HBP | 52 (3.6) | 7 (3.8) | 8 (2.4) | 37 (3.9) |
| Medium-run modifiable | 314 (21.6) | 32 (17.6) | 124 (37.1) | 158 (17.5) |
| Heart/renal/cerebrovascular disease | 76 (5.2) | 5 (2.8) | 27 (7.9) | 44 (4.7) |
| Diabetes and (heart/renal/cerebrovascular disease) | 34 (2.3) | 5 (2.9) | 19 (5.6) | 10 (1.3) |
| HBP and (heart/renal/cerebrovascular disease) | 120 (8.2) | 9 (5.1) | 44 (13.3) | 66 (7.1) |
| Diabetes and HBP and (heart/renal/cerebrovascular disease) | 85 (5.8) | 12 (6.8) | 35 (10.3) | 38 (4.4) |
| Total excess spending | 494 (33.9) | 47 (26.2) | 155 (46.2) | 292 (31.3) |
| Total spending | 1457 (100.0) | 181 (100.0) | 335 (100.0) | 941 (100.0) |
Note. HBP = high blood pressure. Data are for the US noninstitutionalized population aged 18 years and older.
Uncomplicated disease accounted for $180 billion of the excess annual spending, with more than half attributable to persons with uncomplicated hypertension alone. Complications of these conditions accounted for the largest share of excess costs—$314 billion, or 21.6% of total annual spending. More than twice as many persons had uncomplicated disease as had complicated disease, but the per-person excess costs associated with complicated disease were nearly 4 times as much as the per-person excess costs for uncomplicated disease. As a result, the potential for savings from reductions in prevalence was greatest in the second period of the model.
The excess costs associated with the study diseases were not distributed evenly across payers because of differences in the size and characteristics of the populations covered. By far, the largest share of costs was borne by payers other than Medicaid and Medicare, primarily private insurance and out-of-pocket payments, which accounted for about 60% of excess health costs for the study population. Medicare, however, bore the greatest burden of excess costs, which represented 46.2% of total Medicare spending for the study population but only 26.2% of Medicaid costs and 31.3% of private costs. The greater Medicare burden is consistent with the concentration of more advanced disease at older ages. The proportion of excess costs borne by each payer also varied by disease category. Medicaid paid fairly similar shares of excess costs for uncomplicated disease (8.6%) and complicated disease (10.2%). Private payers paid a larger share of excess costs for uncomplicated disease (74.6%) than for complicated disease (50.3%). Medicare, in contrast, paid for 16.8% of excess costs for uncomplicated disease but paid more than twice that proportion (39.6%) of excess costs for complicated disease.
Potential Savings
The total excess spending shown in Table 2 represented the target costs that might be reduced by prevention. As modeled, the share of these costs actually avoided is proportional to the reduction achieved in prevalence. We calculated results for an assumed 5% reduction in the population prevalence of uncomplicated diabetes and hypertension in the first time period, and a 5% proportional reduction in the prevalence of associated complications in the second time period.
Estimates of the savings that could be realized annually under these assumptions nationally and by states and payers in the 2 time periods are presented in Table 3. Medicaid savings were calculated separately by state and federal share of the estimated savings. The reduction in first-period uncomplicated disease prevalence would yield annual savings of nearly $9.0 billion nationally. The reduction in the prevalence of complicated disease in the second period would increase total annual savings to $24.7 billion.
TABLE 3.
Estimated Medical Expenditure Savings Following a 5% Reduction in Prevalence of Short-Run and Medium-Run Modifiable Medical Conditions, by State
| Short Run Savings (in Millions) |
Medium Run Savings (in Millions) |
|||||||||||
| State | Total Savings, $ | Medicaid Total, $ | Medicaid State Portion, $ | Medicaid Federal Portion, $ | Medicare Savings, $ | Other Payer Savings, $ | Total Savings, $ | Medicaid Total, $ | Medicaid State Portion, $ | Medicaid Federal Portion, $ | Medicare Savings, $ | Other Payer Savings, $ |
| Alabama | 150.9 | 13.5 | 4.4 | 9.1 | 14.8 | 122.5 | 449.1 | 35.9 | 11.6 | 24.3 | 143.0 | 270.3 |
| Alaska | 22.3 | 4.7 | 2.2 | 2.4 | 1.8 | 15.9 | 57.5 | 9.8 | 4.7 | 5.2 | 9.0 | 38.6 |
| Arizona | 124.3 | 26.7 | 9.0 | 17.7 | 25.4 | 72.2 | 351.2 | 65.4 | 22.1 | 43.3 | 125.3 | 160.5 |
| Arkansas | 83.1 | 7.6 | 2.1 | 5.6 | 8.0 | 67.4 | 252.8 | 20.5 | 5.5 | 15.0 | 80.8 | 151.5 |
| California | 882.0 | 157.0 | 78.5 | 78.5 | 166.0 | 559.0 | 2493.1 | 373.0 | 186.5 | 186.5 | 818.9 | 1301.2 |
| Colorado | 105.6 | 12.6 | 6.3 | 6.3 | 15.7 | 77.2 | 300.9 | 30.9 | 15.5 | 15.5 | 83.3 | 186.6 |
| Connecticut | 71.0 | 12.9 | 6.4 | 6.4 | 17.5 | 40.6 | 220.9 | 36.0 | 18.0 | 18.0 | 100.4 | 84.5 |
| Delaware | 33.2 | 4.0 | 2.0 | 2.0 | 2.7 | 26.5 | 92.4 | 10.0 | 5.0 | 5.0 | 23.9 | 58.5 |
| District of Columbia | 35.3 | 7.2 | 2.2 | 5.0 | 2.5 | 25.6 | 82.0 | 15.8 | 4.7 | 11.1 | 15.4 | 50.7 |
| Florida | 633.8 | 48.8 | 21.1 | 27.7 | 71.6 | 513.4 | 1856.6 | 123.4 | 53.3 | 70.1 | 631.3 | 1101.9 |
| Georgia | 251.2 | 31.3 | 11.6 | 19.8 | 20.4 | 199.4 | 678.9 | 79.3 | 29.3 | 50.0 | 178.9 | 420.7 |
| Hawaii | 41.6 | 5.7 | 2.5 | 3.2 | 6.9 | 29.0 | 93.7 | 10.9 | 4.7 | 6.2 | 24.6 | 58.2 |
| Idaho | 30.0 | 3.0 | 0.9 | 2.1 | 4.8 | 22.2 | 89.4 | 8.0 | 2.4 | 5.6 | 26.1 | 55.2 |
| Illinois | 542.1 | 22.3 | 11.2 | 11.2 | 107.7 | 412.2 | 1233.3 | 70.0 | 35.0 | 35.0 | 357.5 | 805.8 |
| Indiana | 267.2 | 9.6 | 3.6 | 6.0 | 51.7 | 206.0 | 607.9 | 28.7 | 10.7 | 18.0 | 172.1 | 407.1 |
| Iowa | 126.8 | 4.6 | 1.8 | 2.8 | 24.2 | 98.0 | 288.6 | 14.2 | 5.4 | 8.8 | 78.7 | 195.7 |
| Kansas | 119.5 | 3.7 | 1.5 | 2.2 | 23.6 | 92.3 | 276.9 | 11.8 | 4.8 | 7.0 | 79.6 | 185.5 |
| Kentucky | 135.9 | 16.3 | 4.9 | 11.4 | 11.2 | 108.4 | 432.9 | 50.0 | 15.1 | 34.9 | 119.3 | 263.6 |
| Louisiana | 142.6 | 13.8 | 3.8 | 10.0 | 15.8 | 112.9 | 423.5 | 35.3 | 9.7 | 25.6 | 143.7 | 244.6 |
| Maine | 34.1 | 13.1 | 4.8 | 8.3 | 6.6 | 14.4 | 101.2 | 30.1 | 11.0 | 19.0 | 32.7 | 38.3 |
| Maryland | 200.2 | 17.6 | 8.8 | 8.8 | 18.1 | 164.5 | 527.2 | 44.9 | 22.4 | 22.4 | 146.3 | 336.1 |
| Massachusetts | 134.9 | 38.8 | 19.4 | 19.4 | 31.4 | 64.7 | 450.4 | 110.1 | 55.0 | 55.0 | 192.6 | 147.7 |
| Michigan | 440.0 | 15.8 | 6.6 | 9.2 | 99.8 | 324.4 | 998.3 | 52.9 | 22.2 | 30.7 | 326.4 | 619.0 |
| Minnesota | 233.4 | 9.9 | 5.0 | 5.0 | 37.4 | 186.0 | 520.8 | 33.8 | 16.9 | 16.9 | 117.4 | 369.6 |
| Mississippi | 92.3 | 12.2 | 2.9 | 9.3 | 9.3 | 70.8 | 274.8 | 34.0 | 8.1 | 25.9 | 91.9 | 149.0 |
| Missouri | 262.2 | 16.9 | 6.4 | 10.6 | 54.9 | 190.3 | 610.7 | 54.6 | 20.5 | 34.1 | 181.2 | 374.9 |
| Montana | 24.2 | 2.9 | 0.9 | 2.0 | 3.8 | 17.5 | 67.1 | 7.0 | 2.2 | 4.8 | 19.9 | 40.2 |
| Nebraska | 77.7 | 2.3 | 1.0 | 1.3 | 14.6 | 60.8 | 174.7 | 7.2 | 3.0 | 4.2 | 47.2 | 120.3 |
| Nevada | 54.8 | 4.7 | 2.2 | 2.5 | 10.2 | 39.9 | 163.4 | 11.7 | 5.6 | 6.2 | 51.9 | 99.8 |
| New Hampshire | 25.7 | 2.6 | 1.3 | 1.3 | 5.5 | 17.6 | 73.9 | 6.5 | 3.2 | 3.2 | 27.7 | 39.7 |
| New Jersey | 174.3 | 25.3 | 12.6 | 12.6 | 43.9 | 105.2 | 535.5 | 69.7 | 34.8 | 34.8 | 259.9 | 205.9 |
| New Mexico | 48.7 | 10.3 | 3.0 | 7.3 | 7.9 | 30.5 | 131.2 | 22.1 | 6.4 | 15.7 | 36.0 | 73.0 |
| New York | 462.0 | 179.6 | 89.8 | 89.8 | 104.3 | 178.1 | 1402.1 | 449.0 | 224.5 | 224.5 | 574.4 | 378.6 |
| North Carolina | 271.6 | 34.5 | 12.4 | 22.1 | 22.9 | 214.2 | 787.1 | 91.8 | 33.0 | 58.8 | 213.1 | 482.3 |
| North Dakota | 29.7 | 0.9 | 0.3 | 0.6 | 5.2 | 23.6 | 66.3 | 3.0 | 1.1 | 1.9 | 17.3 | 46.0 |
| Ohio | 531.6 | 23.9 | 9.4 | 14.5 | 106.3 | 401.3 | 1232.9 | 76.7 | 30.1 | 46.6 | 359.8 | 796.4 |
| Oklahoma | 102.4 | 7.2 | 2.4 | 4.8 | 10.3 | 85.0 | 320.4 | 20.0 | 6.6 | 13.4 | 105.1 | 195.3 |
| Oregon | 95.2 | 13.6 | 5.3 | 8.3 | 14.7 | 66.9 | 282.9 | 35.8 | 14.0 | 21.8 | 82.5 | 164.5 |
| Pennsylvania | 271.8 | 53.1 | 24.4 | 28.7 | 68.7 | 150.0 | 871.7 | 133.7 | 61.4 | 72.3 | 407.5 | 330.4 |
| Rhode Island | 22.7 | 5.9 | 2.8 | 3.1 | 5.0 | 11.7 | 74.5 | 18.0 | 8.5 | 9.4 | 30.0 | 26.6 |
| South Carolina | 137.6 | 16.0 | 4.8 | 11.2 | 12.0 | 109.7 | 415.1 | 43.7 | 13.2 | 30.5 | 113.6 | 257.8 |
| South Dakota | 32.4 | 1.0 | 0.4 | 0.6 | 5.9 | 25.4 | 74.4 | 3.4 | 1.4 | 2.1 | 20.0 | 51.0 |
| Tennessee | 199.2 | 36.1 | 13.1 | 23.0 | 16.8 | 146.3 | 621.2 | 98.2 | 35.6 | 62.5 | 164.9 | 358.1 |
| Texas | 630.6 | 45.8 | 18.1 | 27.7 | 60.4 | 524.3 | 1810.0 | 114.6 | 45.2 | 69.4 | 535.9 | 1159.5 |
| Utah | 43.3 | 4.8 | 1.4 | 3.5 | 6.8 | 31.7 | 119.8 | 14.2 | 4.0 | 10.2 | 33.6 | 71.9 |
| Vermont | 15.1 | 4.2 | 1.7 | 2.5 | 3.0 | 8.0 | 41.1 | 9.4 | 3.9 | 5.5 | 13.1 | 18.6 |
| Virginia | 223.3 | 11.8 | 5.9 | 5.9 | 17.2 | 194.4 | 611.0 | 31.7 | 15.9 | 15.9 | 154.3 | 424.9 |
| Washington | 169.1 | 23.1 | 11.2 | 11.9 | 22.7 | 123.3 | 481.4 | 61.6 | 29.9 | 31.7 | 124.5 | 295.3 |
| West Virginia | 69.3 | 8.5 | 2.2 | 6.3 | 6.1 | 54.8 | 228.6 | 25.7 | 6.6 | 19.1 | 66.1 | 136.7 |
| Wisconsin | 259.1 | 8.6 | 3.6 | 4.9 | 43.4 | 207.2 | 578.6 | 26.1 | 11.1 | 15.0 | 136.0 | 416.5 |
| Wyoming | 13.9 | 1.5 | 0.8 | 0.8 | 2.1 | 10.3 | 39.0 | 4.2 | 2.1 | 2.1 | 10.0 | 24.8 |
| US estimatesa | 8981.8 | 774.9 | 311.0 | 463.9 | 1509.9 | 6697.0 | 24 705.1 | 2774.4 | 1203.6 | 1570.8 | 7904.6 | 14 289.7 |
Note. Data are for the US noninstitutionalized population aged 18 years and older. Medium-run savings are cumulative, assuming a 5% lower prevalence of short-run and medium-run conditions.
Source. Estimates were from the Medical Expenditure Panel Survey Household Component, 2003–2005,15 pooled sample and normed to 2004 National Health Expenditure Accounts19 totals by state and payer and inflated to 2008 dollars.
US estimates are from the national spending model and are not column totals, which differed slightly from the national estimates because state estimates were from individual models for each state.
Like potential national savings, state-level savings in both time periods would accrue primarily to nonpublic payers, including out-of-pocket payments by individuals. In the first period, the proportion of savings that would accrue to nonpublic payers ranged from 38.6% in New York to 87.0% in Virginia. In the second period, when Medicare became more important, the nonpublic share of savings fell somewhat, ranging from a low of 27.0% in New York to a high of 72% in Wisconsin.
As at the national level, the largest potential state-level savings occurred during the second period. Although the level of savings varied substantially across states, there was less variation in potential savings as a percentage of total spending. The potential savings over all payers was 0.6% of total spending nationally in the first period, with a range across states of 0.3% to 0.9%. In the second period, the savings represented 1.7% of total national spending and ranged from 1.1% to 2.2% across states.
The differences in the level, percentage, and distribution of savings across payers were affected by the size of the state population, demographic characteristics, the generosity of Medicaid program eligibility and benefits, and state or regional medical practice patterns. We focus our discussion on the magnitude of savings and the prevalence of the study conditions.
The largest potential savings for all payers was in California: $882 million and $2.5 billion in the first and second periods, respectively. The 5 most populous states—California, New York, Florida, Texas, and Illinois—had the largest potential savings and together accounted for nearly 36% of the total potential savings nationally. The 10 states with the highest savings accounted for more than half of all-payer savings. Thus, prevention in these large states had the highest estimated cost-saving potential, although of the top 5, only Florida had an above-average prevalence of the study conditions in the MEPS data.
The 5 states with the highest prevalence of uncomplicated disease were among the states with the most to gain in the percentage of reduction in their spending. Although West Virginia was 33rd in total potential savings ($229 million), it had the highest potential percentage of reduction in total spending, 2.2%, and had the highest prevalences of uncomplicated and complicated disease (21.6% and 12.7%, respectively). The remaining 4 states—Mississippi, Alabama, Arkansas, and Tennessee—all had uncomplicated disease prevalences above 20% and complicated disease prevalences well above the median state prevalence of 8.3%. For all 5 states, savings would be more than 2% across all payers, 1.7% to 1.8% for Medicaid, and 2.4% for Medicare. Together, however, these 5 states represented only 7.4% of the potential savings nationally.
DISCUSSION
In computing our estimates, we made conservative assumptions about the level and duration of the likely effects of community-based prevention. For example, prevention activities would likely affect the severity of both complicated and uncomplicated disease as well as medical expenditures for persons with undiagnosed disease,23 but we did not include these effects in our calculations. Nor did we include the effects of prevention initiatives on other conditions; on nonmedical factors, such as productivity; or on societal value, which is increasingly argued to be the appropriate metric for measuring the benefits of disease prevention.24,25
Our estimate that $24.7 billion in excess medical spending would be avoided annually if primary prevention were able to achieve a 5% reduction in only the conditions we examined can be considered a conservative estimate of the investment in prevention activities that could be offset by medical care savings alone. We did not directly consider the costs of the interventions that could achieve our illustrative level of disease reduction. The evidence base does not currently provide a template for what a community-based intervention that would accomplish a given reduction in the diseases we examined would look like or what it would cost. There are, however, promising developments on that front, at least on a small scale.26–32 In fact, the evidence that does exist suggests that a 1-size-fits-all intervention is unlikely; that even for effective programs, effect sizes are reported in many different ways so that evidence is difficult to combine across programs; that programs tend to be multifactorial with little if any means to differentiate the contribution of components to effect size; and that cost information is minimal and not easily applied to estimating the cost of a large-scale intervention.33 The costs of interventions and the effect sizes they accomplish are likely to vary across states and across communities and population groups within states.
To put our savings estimates in perspective, $9.0 billion in first-period savings would cover a $29 per-person annual investment for every US resident. Targeting activities to areas or groups at higher risk—for example, persons who are overweight, who smoke, or who have limited access to healthy foods—could substantially increase cost-effectiveness. We estimate that by the second period, annual savings would increase nearly 3-fold. Although the annual savings we estimated were not affected by our assumption of a 5-year window for the prevalence reduction to be realized, investment behavior may be affected if, for example, it takes 10 years for second-period savings to be realized. Absent other incentives, lower-income states or states and other stakeholders that do not take into account savings beyond a legislative budget window may find it difficult to justify investments based on the promise of future return.
Several factors argue for broader public investment. Although some large employers have implemented workplace wellness programs and reported savings from such programs, which suggests a growing recognition of the financial benefits of prevention, market signals alone may not be able to bring about an optimal level of investment in the private sector.34,35 Additional difficulties arise in assigning the costs of interventions because of the distribution of savings across public and private payers. In both time periods, the potential savings are greatest in dollars for nonpublic payers, whereas the relative expenditure reductions are greatest for Medicare. But both persons served by public programs and those privately insured would benefit, because reductions in medical care expenditures slow the growth rate of Medicare and Medicaid costs, private premiums, and out-of-pocket costs. Slower public program growth also reduces the pressure to raise state and federal taxes, which both businesses and individuals pay. Finally, government investment in well-designed and evaluated interventions may be required to provide the strong evidence base that is currently lacking.
Limitations
The MEPS-HC relies on self-reports for diagnoses, and therefore some individuals may have been misclassified. Because the MEPS is not designed to make state-level estimates, we relied on statistical estimation of state populations. Although tests suggested that our estimation procedure yielded reasonably accurate results, and comparisons to state-level findings of other researchers on the prevalence36 and Medicaid costs16 of chronic disease add external validity to our findings, the reader should keep in mind the nature of the estimates when looking at any 1 state. Finally, like all modeling efforts, ours required several assumptions, notably the size, persistence, and time frame for effects of a community-based intervention addressing common lifestyle-related risk factors for the diseases we considered.
Conclusions
The magnitude of the excess costs associated with the common preventable diseases we examined—$494 billion annually—provides evidence of the potential economic benefit of primary prevention even when focused narrowly on medical care spending. In addition to reducing these costs in aggregate, community-based primary prevention also could contribute to reduced health disparities because the study conditions and the lifestyle-related risk factors associated with them differ by economic status and race/ethnicity, both of which are major sources of the differences across the states in estimated potential savings. The literature suggests that a measurable reduction in diabetes, hypertension, and related conditions can be achieved and sustained in controlled settings, but additional well-designed and evaluated research is needed to provide direct evidence for the large-scale efficacy and costs of this type of intervention.37 The large potential savings to government health programs may provide justification for public investments in this research.
Acknowledgments
Support for this project was provided by the Trust for America's Health and The California Endowment.
The authors thank Robert Berenson, MD, for advice on medical conditions, and Stephen Zuckerman and anonymous reviewers for helpful comments.
Human Participant Protection
All analyses were conducted on public release versions of secondary data. No institutional review board approval was required.
References
- 1.Grundy SM, Balady GJ, Criqui MH, et al. Primary prevention of coronary heart disease: guidance from Framingham: a statement for healthcare professionals from the AHA Task Force on Risk Reduction. American Heart Association. Circulation. 1998;97(18):1876–1887 [DOI] [PubMed] [Google Scholar]
- 2.Aldana SG, Greenlaw RL, Diehl HA, et al. The behavioral and clinical effects of therapeutic lifestyle change on middle-aged adults. Prev Chronic Dis. 2006;3(1):A05. [PMC free article] [PubMed] [Google Scholar]
- 3.Stevens VJ, Obarzanek E, Cook NR, et al. Long-term weight loss and changes in blood pressure: results of the Trials of Hypertension Prevention, phase II. Ann Intern Med. 2001;134(1):1–11 [DOI] [PubMed] [Google Scholar]
- 4.Appel LJ, Brands MW, Daniels SR, Karanja N, Elmer PJ, Sacks FM. Dietary approaches to prevent and treat hypertension: a scientific statement from the American Heart Association. Hypertension. 2006;47(2):296–308 [DOI] [PubMed] [Google Scholar]
- 5.Resnick HE, Valsania P, Halter JB, Lin X. Relation of weight gain and weight loss on subsequent diabetes risk in overweight adults. J Epidemiol Community Health. 2000;54(8):596–602 [DOI] [PMC free article] [PubMed] [Google Scholar]
- 6.Roehrig C, Miller G, Lake C, Bryant J. National health spending by medical condition, 1996-2005. Health Aff (Millwood). 2009;28(2):w358–w367 [DOI] [PubMed] [Google Scholar]
- 7.Cohen JW, Krauss NA. Spending and service use among people with the fifteen most costly medical conditions, 1997. Health Aff (Millwood). 2003;22(2):129–138 [DOI] [PubMed] [Google Scholar]
- 8.Thorpe KE, Florence CS, Joski P. Which medical conditions account for the rise in health care spending? Health Aff (Millwood). 2004;Jul-Dec;Suppl Web Exclusives:W4–437–45 [DOI] [PubMed] [Google Scholar]
- 9.Haffner SM, Stern MP, Hazuda HP, Mitchell BD, Patterson JK. Cardiovascular risk factors in confirmed prediabetic individuals. Does the clock for coronary heart disease start ticking before the onset of clinical diabetes? JAMA. 1990;263(21):2893–2898 [DOI] [PubMed] [Google Scholar]
- 10.Hu FB, Stampfer MJ, Haffner SM, Solomon CG, Willett WC, Manson JE. Elevated risk of cardiovascular disease prior to clinical diagnosis of type 2 diabetes. Diabetes Care. 2002;25(7):1129–1134 [DOI] [PubMed] [Google Scholar]
- 11.Stern MP. Diabetes and cardiovascular disease. The “common soil” hypothesis. Diabetes. 1995;44(4):369–374 [DOI] [PubMed] [Google Scholar]
- 12.Sowers JR, Epstein M, Frohlich ED. Diabetes, hypertension, and cardiovascular disease: an update. Hypertension. 2001;37(4):1053–1059 [DOI] [PubMed] [Google Scholar]
- 13.Dunn AL, Marcus BH, Kampert JB, Garcia ME, Kohl HW, Blair SN. Comparison of lifestyle and structured interventions to increase physical activity and cardiorespiratory fitness: a randomized trial. JAMA. 1999;281(4):327–334 [DOI] [PubMed] [Google Scholar]
- 14.Knowler WC, Barrett-Connor E, Fowler SE, et al. ; Diabetes Prevention Program Research Group. Reduction in the incidence of type 2 diabetes with lifestyle intervention or metformin. N Engl J Med. 2002;346(6):393–403 [DOI] [PMC free article] [PubMed] [Google Scholar]
- 15.Agency for Healthcare Research and Quality Medical Expenditure Panel Survey Household Component-006R: 1996 Medical Conditions. Rockville, MD: Agency for Healthcare Research and Quality, Center for Cost and Financing Studies; 2000 [Google Scholar]
- 16.Chronic Disease Cost Calculator Atlanta, GA: Centers for Disease Control and Prevention; 2009. Available at: http://www.cdc.gov/chronicdisease/esources/calculator/index.htm. Accessed September 15, 2010 [Google Scholar]
- 17.Centers for Disease Control and Prevention 2007. Crude and Age-Adjusted Percentage of Civilian, Noninstitutionalized Population with Diagnosed Diabetes, United States, 1980–2007. Atlanta, GA: Centers for Disease Control and Prevention; Available at: http://www.cdc.gov/diabetes/statistics/prev/national/figage.htm. Accessed September 23, 2010 [Google Scholar]
- 18.2007 National Diabetes Fact Sheet: General Information and National Estimates on Diabetes in the United States, 2007. Atlanta, GA: US Department of Health and Human Services; 2008. Available at: http://www.cdc.gov/diabetes/pubs/factsheet07.htm. Accessed September 15, 2010 [Google Scholar]
- 19a.Sing M, Banthin JS, Selden TM, Cowan CA, Keehan SP. Reconciling medical expenditure estimates from the MEPS and NHEA, 2002. Health Care Financ Rev. 2006;28(1):25–40 [PMC free article] [PubMed] [Google Scholar]
- 19b.Bureau of the Census, Systems Support Division. Washington, DC: Available at: http://www.census.gov/cps. Accessed November 11, 2010 [Google Scholar]
- 20.Buntin MB, Zaslavsky AM. Too much ado about two-part models and transformation? Comparing methods of modeling Medicare expenditures. J Health Econ. 2004;23(3):525–542 [DOI] [PubMed] [Google Scholar]
- 21.Hadley J, Ruhter J. Estimates of the uninsured's medical care costs in Ohio in 2006. Working Paper Washington, DC: The Urban Institute; 2008 [Google Scholar]
- 22.Dinardo J, Fortin NM, Lemieux T. Labor market institutions and the distribution of wages, 1973-1992: a semiparametric approach. Econometrica. 1996;65(5):1001–1044 [Google Scholar]
- 23.Zhang Y, Dall TM, Mann SE, et al. The economic costs of undiagnosed diabetes. Popul Health Manag. 2009;12(2):95–101 [DOI] [PubMed] [Google Scholar]
- 24.Woolf SH. A closer look at the economic argument for disease prevention. JAMA. 2009;301(5):536–538 [DOI] [PubMed] [Google Scholar]
- 25.Russell LB. Preventing chronic disease: an important investment, but don't count on cost savings. Health Aff (Millwood). 2009;28(1):42–45 [DOI] [PubMed] [Google Scholar]
- 26.Brink S. The Diabetes Prevention Program: how the participants did it. Health Aff (Millwood). 2009;28(1):57–62 [DOI] [PubMed] [Google Scholar]
- 27.Delahanty LM, Nathan DM. Implications of the diabetes prevention program and Look AHEAD clinical trials for lifestyle interventions. J Am Diet Assoc. 2008;108(4 Suppl. 1):S66–S72 [DOI] [PMC free article] [PubMed] [Google Scholar]
- 28.Seidel MC, Powell RO, Zgibor JC, Siminerio LM, Piatt GA. Translating the Diabetes Prevention Program into an urban medically underserved community: a nonrandomized prospective intervention study. Diabetes Care. 2008;31(4):684–689 [DOI] [PubMed] [Google Scholar]
- 29.Ackerman RT, Finch EA, Brizendine E, Zhou H, Marrero GG. Translating the Diabetes Prevention Program into the Community: The DEPLOY Pilot Study. Am J Prev Med. 2008;35(4):357–363 [DOI] [PMC free article] [PubMed] [Google Scholar]
- 30.Aldana S, Barlow M, Smith R, et al. A worksite diabetes prevention program: two-year impact on employee health. AAOHN J. 2006;54(9):389–395 [DOI] [PubMed] [Google Scholar]
- 31.Economos CD, Curtatone JA. Shaping up Somerville: a community initiative in Massachusetts. Prev Med. 2010;50(suppl 1):S97–S98 [DOI] [PubMed] [Google Scholar]
- 32.Jenum AK, Anderssen SA, Birkeland KI, et al. Promoting physical activity in a low-income multiethnic district: effects of a community intervention study to reduce risk factors for type 2 diabetes and cardiovascular disease: a community intervention reducing inactivity. Diabetes Care. 2006;29(7):1605–1612 [DOI] [PubMed] [Google Scholar]
- 33.Task Force on Community Preventive Services The Guide to Community Preventive Services: What Works to Promote Health? Zaza S, Briss PA, Harris KW, New York, NY: Oxford University Press; 2005 [Google Scholar]
- 34.Goetzel RZ, Roemer EC, Liss-Levinson RC, Samoly DK. Workplace Health Promotion: Policy Recommendations that Encourage Employers to Support Health Improvement Programs for their Workers. Washington, DC: Partnership for Prevention; 2008 [Google Scholar]
- 35.Baicker K, Cutler D, Song Z. Workplace wellness programs can generate savings. Health Aff (Millwood). 2010;29(2):304–311 [DOI] [PubMed] [Google Scholar]
- 36.Health Care Costs: a Primer Key Information on Health Care Costs and Their Impact. Washington, DC: The Henry J Kaiser Family Foundation; 2009. Available at: http://www.kff.org/insurance/upload/7670_02.pdf. Accessed September 15, 2010 [Google Scholar]
- 37.Simmons RK, Unwin N, Griffin SJ. International Diabetes Federation: an update of the evidence concerning the prevention of type 2 diabetes. Diabetes Res Clin Pract. 2010;87(2):143–149 [DOI] [PubMed] [Google Scholar]