Abstract
Healthcare is increasingly dependent upon information technology (IT), but the accumulation of data has outpaced our capacity to use it to improve operating efficiency, clinical quality, and financial effectiveness. Moreover, hospitals have lagged in adopting thoughtful analytic approaches that would allow operational leaders and providers to capitalize upon existing data stores. In this manuscript, we propose a fundamental re-evaluation of strategic IT investments in healthcare, with the goal of increasing efficiency, reducing costs, and improving outcomes through the targeted application of health analytics. We also present three case studies that illustrate the use of health analytics to leverage pre-existing data resources to support improvements in patient safety and quality of care, to increase the accuracy of billing and collection, and support emerging health issues. We believe that such active investment in health analytics will prove essential to realizing the full promise of investments in electronic clinical systems.
Keywords: Healthcare technology, hospital information systems, medical informatics, medical informatics applications
Introduction
The practice of medicine in the USA is being transformed by the application of increasingly powerful and ubiquitous information technology (IT). In the wake of the Institute of Medicine's (IOM) 2001 call to action,1 hospitals have hastened to implement electronic health records, computerized physician order entry, pharmacy and drug bar coding, and have sought to modernize clinical and research databases. These efforts have been bolstered by recent federal emphasis on technological infrastructure in healthcare. As part the American Recovery and Reinvestment Act, the US Department of Health and Human Services has explicitly identified the ‘meaningful use’ of healthcare IT (HIT) as a key priority of Recovery Act funding.2 3 The term ‘meaningful use’ underscores the importance of leveraging existing data stores “… to enable significant and measurable improvements in population health through a transformed healthcare delivery system”.4 Such meaningful use of HIT is intended to usher in an era of evidence-based medicine in which clinical and research data are used to improve the performance of caregivers and institutions,5 enhance patient safety,6 7 and allow rapid translation of scientific discovery into clinical practice.8
Unfortunately, such change entails challenges both technological and cultural,9 and 7 years after publication of the IOM report, the full potential of HIT has yet to be realized.10 11 Use of electronic health records, advances in genomic research, and a proliferation of bio-specimens have placed staggering amounts of data in institutional repositories12 13; but a mature approach to combining, analyzing, and leveraging these resources has yet to emerge, and concerns about ineffective use of clinical information14 and inefficient uptake of HIT systems are now being voiced.15
Meanwhile, clinical and financial data languish in separate silos, sequestered in proprietary systems or stored in incompatible formats.13 16 Often, data useful for improving care or operations cannot be accessed without time-consuming intermediate processes.17 In a recent report on the effective use of HIT, the National Research Council18 described a “healthcare IT chasm” that mirrors the structural problems of the healthcare enterprise as a whole. The NRC report warns that current piecemeal efforts at HIT implementation may fail to realize the promise offered by new technologies, and could even prove counterproductive.18
If the technological transformation of American healthcare envisioned by the IOM1 and the NIH Roadmap Initiative8 19 is to succeed, a more thoughtful and systematic approach to HIT services research is essential. We believe that through careful implementation of health analytics, hospitals can transform unwieldy amalgamations of data into information that can improve patient outcomes, increase safety, enhance operational efficiency, and support public health efforts. These applications, commonly known as business intelligence (BI), place timely, relevant, and actionable information into the hands of all users with a legitimate interest in it.20
Background
Business intelligence
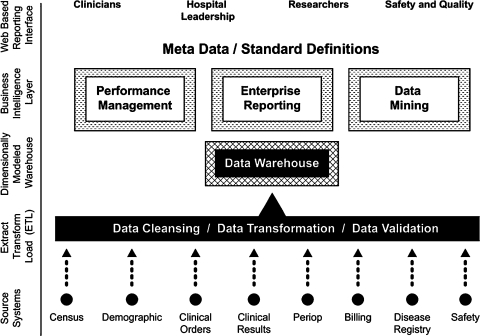
BI comprises an integrated array of IT tools that allow users to transform data into informed actions.21–23 The critical functionality that all BI systems share is the establishment of a logical, comprehensible interface between the human user and a central data repository, known as a data warehouse (figure 1).
Figure 1.
Key functionalities of a business intelligence application in the healthcare environment.
By offering valid, comprehensive views of organizational data, BI tools help users to understand complex processes and relationships by means of easily assimilated, customized visual reports that help users to make timely and informed decisions, take actions that will improve performance, and understand how their actions affect the entire organization.22 23
Health analytics: from data to knowledge
An increasing number of hospitals are already demonstrating the potential of more sophisticated approaches to data management that provide tailored, context-sensitive information to guide research, education, administration, and clinical practice.24 25 Data warehouses and BI technologies have been used in healthcare settings to improve workflow efficiency,26 monitor quality and improve outcomes,27 develop best practices,28 optimize insurance procedures,29 and uncover patterns of increased expenditures.30 Many health systems are also using ‘scorecard’31 and ‘dashboard’10 methodologies and developing Web-based query and reporting tools10 32 to optimize delivery of services as well as improve their own data warehouse projects.31 These efforts reinforce the NRC's observation that health systems should emphasize HIT investments that help create context for, and comprehension of, raw data, rather than implementing increasing amounts of automated processes to collect data.18 We present below three case studies that we hope will contribute to the further understanding of these efforts.
Case studies
The Duke University Health System (DUHS) uses Six Sigma performance improvement methodology33 34 to reduce process variance and improve the efficiency of care delivery, patient safety, and hospital operations, with our data stores and BI strategies providing the substrate upon which research efforts are based. The following case studies demonstrate how our integrated enterprise data strategy has been used to support patient safety, financial effectiveness, and public health issues.
Leveraging enterprise data through computerized patient safety initiatives
The IOM report on preventing medication errors35 recommends that healthcare systems capture electronic information on safety and use the data to improve the quality of their care delivery systems. While many health systems have achieved the former, translating burgeoning data stores into meaningful safety improvement initiatives has proven difficult. At DUHS, we designed our voluntary Safety Reporting System and automated Adverse Drug Event Surveillance System to synergistically gather critical patient safety data,36 37 while our Decision Support Repository and Clinical Data Repository store and aggregate additional clinical information critical to our quality improvement (QI) initiatives.
Over the past 5 years, our ability to capture electronic safety information has grown exponentially. Conscious of the need for data integration and expedited analysis, we modeled our patient safety systems into an integrated data warehouse. We also designed BI tools that provide unit leaders with real-time access to aggregate patient safety data, thus permitting clinicians to ask dynamic questions about critical safety and quality issues, and encouraging staff to take responsibility for responding to them. More importantly, our dynamic BI interface allows clinicians and leaders to analyze data at the level of the health system as a whole or in a service-specific manner. This flexibility makes possible targeted safety strategies that consider differences in care settings and make intelligent use of specialized domain knowledge.
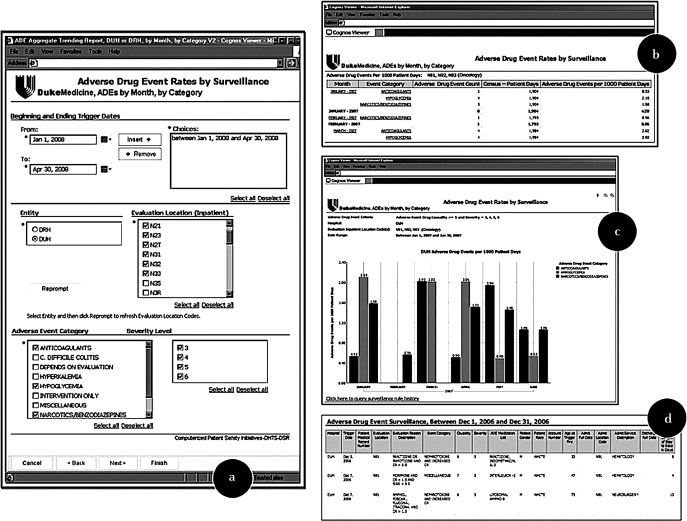
Using our Web-based safety dashboard, clinicians can identify cohorts of interest (figure 2a), display census-corrected aggregate safety statistics (2b, 2c), and click on bars within graphs to ‘drill down’ into encounter-specific or event-specific details (2d). These reports also allow us to dynamically aggregate and disaggregate information to actively identify systemic issues and intervene on the basis of timely, accurate, and high-confidence data.
Figure 2.
Duke Health Safety Dashboard. Clinicians can use the interface to identify a patient cohort of interest (a), display census-corrected aggregate safety statistics (b, c), and ‘drill down’ on displayed data to show encounter-specific or event-specific detail (d).
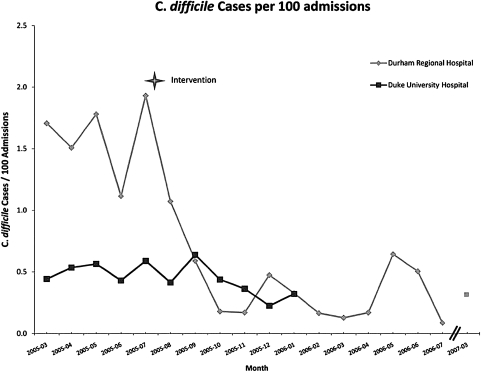
Although the safety dashboard is relatively new, the integration of DUHS safety systems has already proven its effectiveness. Duke has previously reported on the proactive detection and subsequent amelioration of Clostridium difficile colitis rates at Durham Regional Hospital.37 This QI initiative was made possible by an active ADE surveillance system based on a consolidated IT infrastructure, and a targeted hand-washing and provider education campaign. Continued intermittent monitoring after the intervention shows the improvement has remained durable (figure 3).
Figure 3.
Clostridium difficile cases per 100 admissions at Duke University Hospital and Durham Regional Hospital, 2005–2007. Adapted from: Kilbridge PM, Campbell UC, Cozart HB, Mojarrad MG. Automated surveillance for adverse drug events at a community hospital and an academic medical center. J Am Med Inform Assoc 2006;13:372-7; reproduced with permission from BMJ Publishing Group.
Based on our data, the intervention prompted by our initial safety analysis prevented 157.8 potential cases of nosocomially acquired C difficile colitis per year. Kyne38 and Wilcox39 calculate the financial burden of C difficile colitis to range from $3669 to $7234 in additional hospital costs per infected patient, which by conservative analysis translates into a total savings of $578 968. Of greater significance, however, are the rising estimates of serious complications of C difficile infection (ie, surgery, prolonged hospitalization, intensive care services) and the case-fatality rate of about 2.2%,40 meaning that the ability to forestall such infections has serious implications for patient wellbeing.39 The rapid identification and subsequent intervention made possible by aggregate data analysis has improved patient care and demonstrably reduced our nosocomial infection rate.
The success of this initiative prompted development of a more robust BI infrastructure that contains granular safety data on medication safety, transfusion deviations, and patient falls. By decentralizing this information and furnishing unit-based caregivers with direct access to detailed safety data, we are better able to undertake effective QI initiatives at the point of care. More importantly, events can be viewed at varying levels of granularity, from high level trend reports to detailed descriptions of individual patient safety events.
Improving the business cycle: the Duke intensive care nursery
As is the case at many institutions, the DUHS data warehouse was originally designed as a financial system and has only recently been used to support safety, research, and QI. Nevertheless, our early experiences with the warehouse have taught us how to integrate and analyze large data sets using graphical statistics and visualization techniques. In many cases, the analyses yielded significant marginal improvements that could be used for further research in BI and health analytics.
The largest cuts in Medicare history were enacted in 1997 through the Balanced Budget Act,41 resulting in significant erosions of hospital margins.42 43 Years later, Phillips and colleagues44 concluded that total margins for teaching hospitals had also declined since the inception of the Act, but also observed that losses were “not entirely attributable” to the Act and that other factors had contributed to negative margins at teaching hospitals.
It was in this context of falling revenues that the Duke Division of Neonatology was informed that its Intensive Care Nursery (ICN) had lost nearly $1.7 million in the prior fiscal year on operations and was forecast to lose over $2.1 million in the current fiscal year. Traditional cost-cutting strategies were not feasible, because nearly 75% of costs were due to personnel, leaving only 25% of costs amenable to reduction through reduced resource utilization. We therefore examined our data warehouse with the aim of constructing a model to identify parts of the revenue cycle that might prove amenable to targeted improvement efforts.
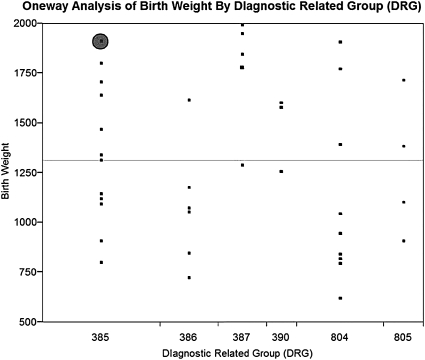
Our initial analysis (figure 4) indicated that only one account (shaded circle) had been properly paid, implying that the problem was not attributable to any single factor.
Figure 4.
One-way analysis of birth weight by diagnostic related group (DRG). Circle indicates single account identified as having been properly paid.
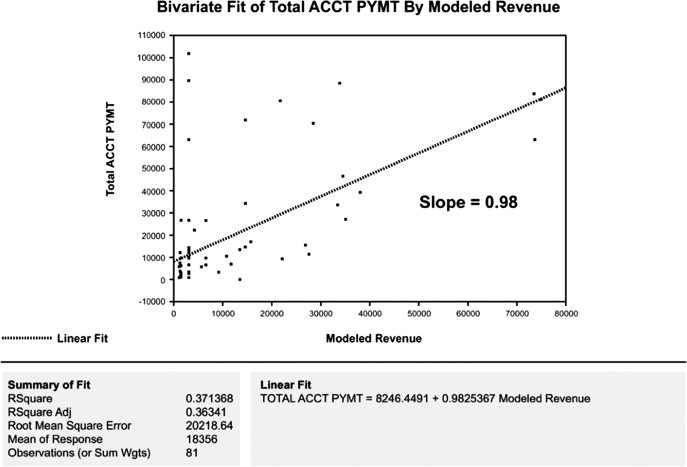
Further analysis suggested four areas for targeted improvement: physician documentation, medical record coding, revenue modeling, and third-party payments. Accordingly, we reasoned that any successful project would have to be data-driven, correctable, verifiable, simultaneous, and recursive. We therefore tested the hypothesis that traditional accounting practices could be improved through serial application of visual and factorial statistical analyses to our enterprise data stores (JMP V.3.0, SAS Corporation, Cary, NC, USA). The new process used existing clinical and billing data to develop a validated revenue model representing expected payment for each patient in our cohort. We then plotted actual revenue against modeled payments to identify process-level errors (figure 5). Although the slope of the regression line was 0.98, the relatively low R2 adjusted statistic of 0.36 was an important indicator that most of the data variability could not be explained by the existing revenue model; thus, closer examination was clearly warranted.
Figure 5.
Bivariate fit of account payments plotted against modeled revenue (original revenue model).
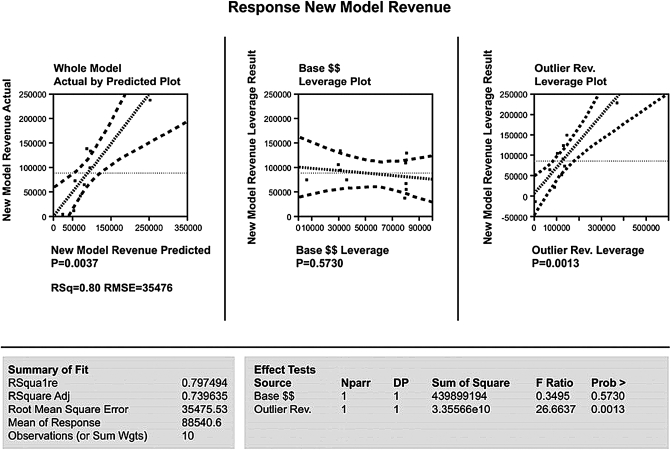
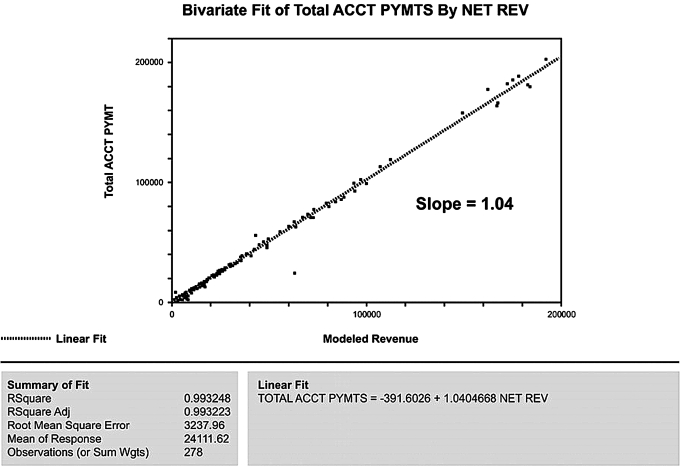
To further assess potential candidates for process-level errors, we modeled the difference between actual and modeled revenues (ie, variability) using the main factors associated with the third party's base payments and outlier payments. Analysis of variance and factorial modeling techniques were used to assess specific contributions of statistically significant factors to the model's performance. As expected, the whole model was a reasonable predictor of process variance. But, as figure 6 shows, base payments did not significantly affect variances (p=0.57), while outlier payments had a profoundly significant effect (p<0.002). Armed with this information, we identified and corrected the charge-entry error that uniquely affected outlier payments. The successful outcome is illustrated in figure 7, where modeled revenues are accurately predictive (slope=1.04) with a high degree of precision (R2=0.99).
Figure 6.
Difference between actual and modeled revenues according to base payments and outlier payments.
Figure 7.
Bivariate fit of account payments plotted against modeled revenue (revised revenue model).
This approach allowed the identification and correction of process errors involving physician documentation, medical records, and charge processing, which not only eliminated the projected $2.1 million deficit but led to a profit of $400 000 within 4 months. More importantly, these analyses resulted in the correction and resubmission of previously submitted accounts, subsequently returning over $12 million in additional revenues over the following fiscal year and establishing a precedent for future monitoring. Some of these funds were used to found the Duke Neonatal-Perinatal Research Institute, which supports innovative multidisciplinary research in newborn medicine.
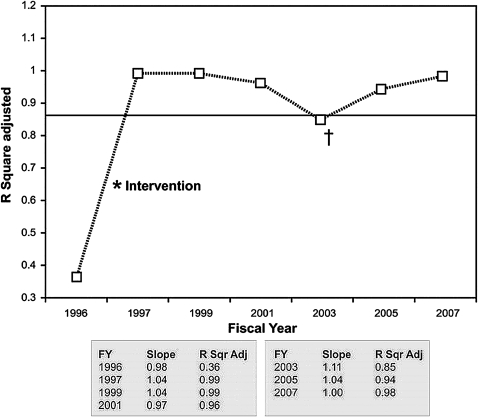
Continued monitoring of the model revealed that the slope of line the remained close to 1.0 and R2 adjusted statistics remained ≥0.98 (figure 8). The additional variability in 2003 was analyzed and determined to be secondary to multiple out-of-cycle adjustments to the Medicaid payment process. By 2007, the model had returned to baseline R2 adjusted statistics of 0.98.
Figure 8.
Results from continued monitoring of the revised revenue model. † indicates an increase in model error in 2003 that was attributable to out-of-cycle adjustments to the Medicaid payment table.
Leveraging health analytics for emerging health issues
In the wake of a declaration of a pandemic of H1N1 influenza (‘swine flu’) by the WHO in the spring of 2009,45 the DUHS faced the problem of estimating the amount of vaccine it would need to request in order to meet the needs of the communities it serves.
In doing so, the DUHS sought to avoid two undesirable outcomes: (1) ordering too little vaccine, resulting in local shortages and diminished protection among unvaccinated patients and customers served by Duke, or (2) ordering too much vaccine, resulting in waste and potentially contributing to shortages in other locations, as well as incrementally adding to stress on the national vaccine distribution network.
The DUHS therefore used its data warehouse to provide a highly refined estimate of patients likely to need H1N1 vaccine. A database query based on CDC vaccination priority eligibility criteria46 was applied to a list of all patients with a status of ‘alive’ in the data warehouse (table 1).
Table 1.
CDC priority criteria for H1N1 vaccine distribution
| Category |
| Pregnant women |
| People who live with or care for children <6 months of age |
| Healthcare/emergency services workers with direct patient contact |
| People between 6 months and 24 years of age |
| People aged 25–64 years with chronic health disorders or compromised immune systems |
Patients were further grouped according to inpatient status and whether they were noted as having a chronic disease, which were defined according to International Classification of Disease 9 (ICD-9) based Agency for Healthcare Reseach and Quality bundles (diabetes mellitus, heart disease, lung disease, HIV infection, cancer, chronic kidney disease, liver disease, and neurological disease). Wherever bundles failed to produce a good fit for the patient condition, individual ICD-9 codes were used.
By applying this query to the data warehouse, the DUHS was able to refine its estimate of vaccine need according to CDC priority criteria, allowing us to send timely and accurate information to the state and to better define our strategy for vaccine administration. Given the high-risk status of pregnant women and children, information from the data warehouse was further used to prioritize vaccine administration as inventory became available, a capability that has proven particularly important in the wake of vaccine shortages created by unexpected production delays.
A multidisciplinary group of pediatric subspecialists was convened to define the highest-risk ICD-9 diagnoses commonly seen in pediatric practice. Within 24 h, the data warehouse generated contacts lists for high-risk patients, coupled with details about their next scheduled appointment in the health system. This enabled the targeted delivery of vaccine to high-volume clinics, and prompted a focused education and marketing campaign aimed at getting the highest-risk patients to a clinic for early immunization.
This use case demonstrates how a data-driven enterprise can quickly mobilize its resources in support of emerging health needs, while BI tools equip clinical leaders with data that allows them to make the most informed decisions for their patients, as well as helping them adapt quickly to changing circumstances.
Discussion
Based on our experience, we believe the following key issues deserve careful consideration:
Funding for HIT must be better allocated. The present emphasis on iterative upgrades of operation systems leads to accumulations of data without a concomitant understanding of how best to use these ‘stockpiles’ to benefit patients, and there is little evidence that such ‘upgrades’ actually improve outcomes. The US healthcare enterprise faces serious challenges in coming years, as the population ages and chronic diseases become increasingly prevalent. These challenges will be amplified by increased performance reporting requirements, public scrutiny of such information, and the withholding of reimbursement for substandard care. We believe that traditional approaches to cost containment and QI will not keep pace with the increasing demands being placed on healthcare systems, and the future of the nation's healthcare enterprise may depend on mature approaches to data aggregation, interpretation, and sharing.
Active investment in Health Analytics, data integration, and data sharing are crucial to creating efficiencies. We are in the early stages of a revolution in healthcare, as genomics, proteomics, pharmacogenomics, and point-of-care decision support converge in a new era of personalized medicine. Without timely and appropriate investment in data infrastructure, however, the potential benefits of this revolution may be impeded,18 and the opportunities present in current incentive programs aimed at fostering meaningful use of HIT could be, if not altogether missed, then certainly diminished. In industry, data are typically viewed as a critical enterprise asset; medicine, in contrast, tends to view data as a byproduct of operations. This latter view is not without promise, but in general this ‘byproduct’ is not being fully leveraged. An approach that incorporates active investment in integrating existing data structures and developing BI tools, such as that described in the NRC report's ‘Principles for Evolutionary Change’18 can provide the most immediate return on investment and allow health systems to keep pace with increasing demands.
-
New approaches to data visualization and analysis are needed. BI tools allow us to continuously monitor health system performance, separate signals from noise, and scientifically evaluate the return on investment provided by QI initiatives. As our financial case study shows, even minute variances can result in significant cost savings when improvements are applied to large populations. As patient populations grow and operating budgets are increasingly constrained, such efficiencies will be vital to the success of healthcare institutions. Unfortunately, as pointed out in the NRC report,18 many implementations of HIT products pay scant attention to ultimate usability or cognitive factors and merely recapitulate designs, process flows, and data displays that mimic older, paper-based systems. Increased attention to these issues will be critical to designing successful and usable systems.
Our findings have a number of limitations. Relatively few studies have systematically examined HIT use across the spectrum of US healthcare providers, although the number of institutions piloting various projects in this field is growing. Nonetheless, more research is clearly needed to assess its merits in the clinical setting. Because health analytics tools are ultimately intended to inform clinical and operational decision-making, the quality of any system will be highly sensitive to appropriate design and implementation, including user training. User acceptance will also be critical to success; thus, tools must be intuitive, possess appropriate features, and be trusted to provide accurate data. Finally, our case study examples are drawn from a large academic medical center, and their applicability to other settings may be limited.
Summary
Careful deployment of health analytics tools can allow health systems, hospitals, and individual clinical staff to maximize the value of clinical and administrative data, in many cases without extensive investment in additional HIT infrastructure. By adapting proven information management strategies, healthcare efficiency can be enhanced, waste and redundancy can be abated, patient safety and outcomes can be improved, and public health efforts can be more effectively supported.
Acknowledgments
The authors wish to thank Jonathon Cook of the Duke Clinical Research Institute for assistance in preparing the figures for this manuscript.
Footnotes
Funding: This work was supported by Duke Health Technology Solutions. Other Funders: Duke Health Technology Solutions.
Competing interests: None.
Provenance and peer review: Not commissioned; externally peer reviewed.
References
- 1.Institute of Medicine Chapter 7: Using information technology. In: Crossing the quality chasm: a new health system for the 21st century. Washington, DC: National Academy Press, 2001 [Google Scholar]
- 2.American Recovery and Reinvestment Act Web site Agency plans: Department of Health and Human Services Health Information Technology Recovery Plan. http://www.recovery.gov/Transparency/Agency/reporting/agency_reporting5program.aspx?agency_code=75&progplanid=7607 (accessed January 21, 2010).
- 3.Section A, Title XIII, of the American Recovery and Reinvestment Act of 2009 (HITECH Act). http://frwebgate.access.gpo.gov/cgi-bin/getdoc.cgi?dbname=111_cong_bills&docid=f:h1enr.pdf (accessed 30 Oct 2009).
- 4.US Department of Health and Human Services Web site Meaningful use: a definition. Recommendations from the meaningful use workgroup to the health IT policy committee. June 16, 2009. http://healthit.hhs.gov/portal/server.pt/gateway/PTARGS_0_11113_872720_0_0_18/Meaningful%20Use%20Preamble.pdf (accessed 30 Oct 2009).
- 5.Detmer DE. Building the national health information infrastructure for personal health, health care services, public health, and research. BMC Med Inform Decis Mak [serial online]. 2003;3 http://www.biomedcentral.com/1472-6947/3/1 (accessed 15 Mar 2008). [DOI] [PMC free article] [PubMed] [Google Scholar]
- 6.Bates DW, Gawande AA. Improving safety with information technology. N Engl J Med 2003;348:2526. [DOI] [PubMed] [Google Scholar]
- 7.Kaushal R, Barker KN, Bates DW. How can information technology improve patient safety and reduce medication errors in children's health care? Arch Pediatr Adolesc Med 2001;155:1002–7 [DOI] [PubMed] [Google Scholar]
- 8.Zerhouni E. Medicine. The NIH roadmap. Science (Washington, DC) 2003;302:63–72 [DOI] [PubMed] [Google Scholar]
- 9.Blumenthal D, Glaser J. Information technology comes to medicine. N Engl J Med 2007;356:2527–34 [DOI] [PubMed] [Google Scholar]
- 10.Grant A, Moshyk A, Diab H, et al. Integrating feedback from a clinical data warehouse into practice organisation. Int J Med Inform 2006;75:232–9 [DOI] [PubMed] [Google Scholar]
- 11.Bates DW. Physicians and ambulatory electronic health records. Health Aff (Millwood) 2005;24:1180–9 [DOI] [PubMed] [Google Scholar]
- 12.Han J, Altman RB, Kumar V, et al. Emerging scientific applications in data mining. Commun ACM 2002;45:54–8 [Google Scholar]
- 13.Fayyad U, Uthurusamy R. Evolving data mining into solutions for insights. Commun ACM 2002;45:28–31 [Google Scholar]
- 14.Hersh WR. Medical Informatics: improving health care through information. JAMA 2002;288:1955–8 [DOI] [PubMed] [Google Scholar]
- 15.Wachter RM. Expected and unanticipated consequences of the quality and information technology revolutions. JAMA 2006;295:2780–3 [DOI] [PubMed] [Google Scholar]
- 16.Hersh W. Health care information technology: progress and barriers. JAMA 2004;292:2273–4 [DOI] [PubMed] [Google Scholar]
- 17.Kohavi R, Rothleder NJ, Simoudis E. Emerging trends in business analytics. Commun ACM 2002;45:45–8 [Google Scholar]
- 18.Stead WW, Lin HS. Computational technology for effective health care: immediate steps and strategic decisions. Committee on engaging the computer science research community in health care informatics, computer science and telecommunications board, division on engineering and physical sciences, national research council. Washington, DC: National Academies Press, 2009 [PubMed] [Google Scholar]
- 19.Zerhouni EA. US biomedical research: basic, translational, and clinical sciences. JAMA 2005;294:1352–8 [DOI] [PubMed] [Google Scholar]
- 20.Luhn HP. A business intelligence system. IBM Journal of Research and Development 1958;2:314–19 [Google Scholar]
- 21.Golfarelli M, Rizzi S, Cella I. Beyond data warehousing: what's next in business intelligence? Proceedings of the 7th ACM international workshop on Data warehousing and OLAP. Washington, DC, USA: ACM, 2004:1–6 [Google Scholar]
- 22.Loshin D. Business intelligence: getting onboard with emerging IT. San Francisco: Morgan Kaufmann Publishers, 2003 [Google Scholar]
- 23.Liautaud B. e-Business intelligence: turning information into knowledge into profit. New York: The McGraw-Hill Companies, Inc., 2001 [Google Scholar]
- 24.Cain TJ, Rodman RL, Sanfilippo F, et al. Managing knowledge and technology to foster innovation at the Ohio State University Medical Center. Acad Med 2005;80:1026–31 [DOI] [PubMed] [Google Scholar]
- 25.Guard JR, Brueggemann RF, Highsmith RF, et al. Building research administration applications for the academic health center: a case study. Acad Med 2005;80:1032–8 [DOI] [PubMed] [Google Scholar]
- 26.Borlawsky T, LaFountain J, Petty L, et al. Leveraging an existing data warehouse to annotate workflow models for operations research and optimization. AMIA Annu Symp Proc 2008. November 6:885. [PubMed] [Google Scholar]
- 27.Resetar E, Noirot LA, Reichley RM, et al. Using business intelligence to monitor clinical quality metrics. AMIA Annu Symp Proc 2007. October 11:1092. [PubMed] [Google Scholar]
- 28.Dhaval R, Buskirk J, Backer J, et al. Leveraging an information warehouse to create translational research environment for wound care center. AMIA Annu Symp Proc. 2007. October 11:939. [PubMed] [Google Scholar]
- 29.Ostrander M, Parikh D, Tennant M. Improving daily workflow to improve insurance rejection handling by leveraging an existing data warehouse. AMIA Annu Symp Proc 2008. November 6:1075. [PubMed] [Google Scholar]
- 30.Chen Y, Matsumura Y, Nakagawa K, et al. Analysis of yearly variations in drug expenditure for one patient using data warehouse in a hospital. J Med Syst 2007;31:17–24 [DOI] [PubMed] [Google Scholar]
- 31.Eaton S, Ostrander M, Santangelo J, et al. Managing data quality in an existing medical data warehouse using business intelligence technologies. AMIA Annu Symp Proc 2008. November 6:1076. [PubMed] [Google Scholar]
- 32.Roohan PJ. Integration of data and management tools into the new york state medicaid managed care encounter data system. J Ambul Care Manage 2006;29:291–9 [DOI] [PubMed] [Google Scholar]
- 33.Harry MJ. The nature of six sigma quality. Motorola Government Electronics Group, 1987 [Google Scholar]
- 34.Breyfogle FW., III Implementing six sigma: smarter solutions using statistical methods. New York, NY: John Wiley & Sons, 1999. ISBN 0471265721 [Google Scholar]
- 35.Institute of Medicine Preventing medication errors: quality chasm series. Washington, DC: National Academy Press, 2006 [Google Scholar]
- 36.Kilbridge PM, Campbell UC, Cozart HB, et al. Automated surveillance for adverse drug events at a community hospital and an academic medical center. J Am Med Inform Assoc 2006;13:372–7 [DOI] [PMC free article] [PubMed] [Google Scholar]
- 37.Ferranti J, Horvath MM, Cozart H, et al. Reevaluating the safety profile of pediatrics: a comparison of computerized adverse drug event surveillance and voluntary reporting in the pediatric environment. Pediatrics 2008;121:e1201–7 [DOI] [PubMed] [Google Scholar]
- 38.Kyne L, Hamel MB, Polavaram R, et al. Health care costs and mortality associated with nosocomial diarrhea due to Clostridium difficile. Clin Infect Dis 2002;34:346–53 [DOI] [PubMed] [Google Scholar]
- 39.Wilcox MH, Cunniffe JG, Trundle C, et al. Financial burden of hospital-acquired Clostridium difficile infection. J Hosp Infect 1996;34:23–30 [DOI] [PubMed] [Google Scholar]
- 40.Zilberberg MD, Shorr AF, Kollef MH. Increase in adult Clostridium difficile–related hospitalizations and case-fatality rate, United States, 2000–2005. Emerg Infect Dis [serial on the Internet] 2008 Jun [date cited]. http://www.cdc.gov//EID/content/14/6/929.htm (accessed 2 Jun 2008). [DOI] [PMC free article] [PubMed]
- 41.Pub Law No 105-33, 111 Stat 251 [The Balanced Budget Act of 1997].
- 42.Wilensky GR, Newhouse JP. Rethinking Medicare's payment policies for graduate medical education and teaching hospitals. Washington, DC: Medical Payment Advisory Commission, 1999. http://www.medpac.gov/publications/congressional_reports/august99.pdf (accessed 28 May 2008). [Google Scholar]
- 43.Hackbarth GM, Chair Report to the congress. Washington, DC: Medicare Payment Policy, 2002 [Google Scholar]
- 44.Phillips RL, Jr, Fryer GE, Chen FM, et al. The Balanced Budget Act of 1997 and the financial health of teaching hospitals. Ann Fam Med 2004;2:71. [DOI] [PMC free article] [PubMed] [Google Scholar]
- 45.World Health Organization Web site Global alert and response: pandemic (H1N1) 2009. http://www.who.int/csr/disease/swineflu/en/ (accessed 12 Oct 2009).
- 46.Centers for Disease Control and Prevention Web site H1N1 influenza vaccine. http://www.cdc.gov/h1n1flu/vaccination/public/vaccination_qa_pub.htm (accessed 12 Oct 2009).


