

Abstract
Nitric oxide (NO), produced by NO synthase (NOS), modulates the function of all retinal neurons and ocular blood vessels and participates in the pathogenesis of ocular diseases. To further understand the regulation of ocular NO release, we systematically studied the morphology, topography and light responses of NOS-containing amacrine cells (NOACs) in dark-adapted mouse retina. Immunohistological staining for neuronal NOS (bNOS), combined with retrograde labeling of ganglion cells (GCs) with Neurobiotin (NB, a gap junction permeable dye) and Lucifer yellow (LY, a less permeable dye), was used to identify NOACs. The light responses of ACs were recorded under whole-cell voltage clamp conditions and cell morphology was examined with a confocal microscope. We found that in dark-adapted conditions bNOS-immunoreactivity (IR) was present primarily in the inner nuclear layer and the ganglion cell layer. bNOS-IR somas were negative for LY, thus they were identified as ACs; nearly 6 % of the cells were labeled by NB but not by LY, indicating that they were dye-coupled with GCs. Three morphological subtypes of NOACs (NI, NII and displaced) were identified. The cell density, inter-cellular distance and the distribution of NOACs were studied in whole retinas. Light evoked depolarizing highly sensitive ON-OFF responses in NI cells and less sensitive OFF responses in NII cells. Frequent (1 to 2 Hz) or abrupt change of light-intensity evoked larger peak responses. The possibility for light to modify NO release from NOACs is discussed.
Keywords: retrograde labeling, patch clamp recording, dye coupling
Introduction
Nitric oxide (NO), generated by nitric oxide synthase (NOS), is a powerful modulator in mammalian eyes. It not only modulates the physiological function of retinal neurons and ocular blood vessels but also participates in the pathogenesis of ocular diseases (Cudeiro and Rivadulla, 1999; Goldstein et al., 1996). By activating the enzyme soluble guanylate cyclase to produce cyclic guanosine monophosphate (cGMP), NO modifies the phototransduction cascade, increases cone glutamate release (Savchenko et al., 1997), modifies the function of bipolar cells (BCs) (Nawy and Jahr, 1990; Shiells and Falk, 1990) and ganglion cells (GCs) (Ahmad et al., 1994), decreases the inter-cellular coupling between horizontal cells (Xin and Bloomfield, 2000; DeVries and Schwartz, 1989; Pottek et al., 1997) and the coupling between cone bipolar and AII cells (Mills and Massey, 1995). NO also inhibits dopamine release (Bugnon et al., 1994) and modifies G-protein via cGMP-independent mechanisms (Goldstein et al., 1996). In ocular blood vessels, NO dilates arteries and increases blood flow (Schmetterer and Polak, 2001). NO can have either toxic or neuroprotective effects (Cudeiro and Rivadulla, 1999; Goldstein et al., 1996; Chiou, 2001). During glucose and oxygen deprivation, NO may increase blood flow and prevent platelet aggregation. When large amounts of NO are generated over time, NO could be converted into NO2, nitrite, peroxynitrite and free radicals to induce pathophysiological actions, such as optic nerve degeneration and posterior retinal degeneration lesions, leading to glaucoma, retinopathy, age-related macular degeneration, myopia, cataracts and uveitis.
NO possesses unique properties. Firstly, NO is soluble in tissue. Its half-life is several seconds (Palmer et al., 1987), and it is able to diffuse through all physiological barriers (Wood and Garthwaite, 1994; Cudeiro and Rivadulla, 1999) over several hundred micrometers in its lifetime (Xin and Bloomfield, 2000; Margulis and Sitaramayya, 2000). Secondly, NO is highly unstable (Dawson and Snyder, 1994) and cannot be stored in synaptic vesicles. Since the thickness of a mouse retina is only about 200 micrometers (see results), NO generated from NOACs are expected to be effective for the whole thickness of the retina over a large region, if NO can diffuse in the retina. NO, as a small-molecule lipophilic gas, theoretically is able to penetrate plasma membrane and diffuse in tissue. However, there is still some conflict regarding its diffusion. By using DAF (diaminofluoresceins) NO fluorescency, some studies showed that NO generated from ACs were restricted in the cells in turtle retina (Eldred and Blute, 2005) and NO did not diffuse in the mouse retina (Giove et al., 2009). The underlying mechanism is not clear. The biosynthesis of NO, or the amount and activity of NOS, directly determines the level of NO in tissues. The neuronal isoform of NOS (also named brain NOS-bNOS, nNOS or NOS1) is Ca2+ -dependent (Schmidt et al., 1992). It is expressed mostly in NOACs in retinas (Huang and Lo, 1998; Haverkamp et al., 2000; Schmetterer and Polak, 2001; Kim et al., 2000).
NOACs appear to be important cells in regulation of NO level in ocular tissue. Retinal NO DAF fluorescence has been found to be enhanced by light in the mouse and turtle retina (Eldred and Blute, 2005; Giove, et al, 2009); but it is still unclear how NO release from a NOAC is specifically related to physiological stimuli (e.g. light) or pathological signals. The morphology of NOACs has been studied in some detail in the retinas of turtles (Haverkamp et al., 2000; Eldred and Blute, 2005), rats (Chun et al., 1999), and guinea pigs (Oh et al., 1999), but the identity of some NOS immunoreactive cells is not clear (Haverkamp et al., 2000). Due to the breakthrough in the discovery of mouse genome and the development of many transgenic mouse strains, the mouse model has become the most promising animal model in biological and medical research. Yet, the individual cell morphology, the function and distribution of NOACs have not been revealed previously in the mouse retina (Kim et al., 2000; Haverkamp and Wässle, 2000). The specific aims of this study were: 1) to determine the morphological subtypes of NOACs, 2) to reveal the light response of NOACs, 3) to investigate the topographical distribution of NOACs, and 4) to reveal dye-coupling between NOACs and GCs.
Materials and Methods
Animals
The animals used in this study were C57B6/J and Nos1tm1Plh mice (Huang, 1998) purchased from Jackson Laboratory (Bar Harbour, ME, USA). The mice were 2 to 6 months old males and females. All procedures used in this study followed the NIH and ARVO animal care guidelines as well as the relevant requirements of the Baylor College of Medicine Animal Care and Use Committee. All mice were dark-adapted for 1–2 hours prior to the experiment. Animals were anesthetized with an intra-peritoneal injection of ketamine (200 mg/kg) and xylazine (10 mg/kg). The eyes were enucleated after the animals were deeply anesthetized. Animals were sacrificed by over-dose of the anesthesia thereafter.
Antibodies
In this experiment, the IgG fraction of rabbit antiserum against bNOS (Sigma, N7155, MI) in a dilution of 1:4000 was used to label NOS. The specificity of this antibody was characterized previously (Zucker, Luthi-Carter et al., 2005). The antibody was developed in rabbit using the synthetic peptide K-GDNDRVFNDLWGKDNVPVIL corresponding to bNOS of rat brain origin (amino acids 251-270 with N-terminally added lysine) conjugated to KLH as the immunogen. Whole antiserum was fractionated and then further purified by ion-exchange chromatography to provide the IgG fraction of antiserum that is essentially free of other rabbit serum proteins. The antibody was specific for NOS derived from brain (bNOS, 150–160 kD), but it did not recognize NOS derived from activated macrophages (iNOS) and endothelial cells (eNOS). By immunoblotting of rat brain tissue extract, the staining of bNOS band was specifically inhibited with bNOS peptide (amino acids 251-270 with N-terminally added lysine). bNOS-IR was colocalized with the mRNA for the same protein (Zucker, Luthi-Carter et al., 2005). We further examined the specification of the antibody in bNOS-knockout mice (Nos1tm1Pl−/−) (Huang, 1998). In our results, bNOS antibody only recognized a small population of ACs in the inner nuclear layer (INL) and in the GC layer (GCL) in wild type mouse retinas. bNOS-IR in ACs was absent in the bNOS-knockout mice. It indicated that bNOS labeling, at least in ACs, was specific. Ganglion cells were usually bNOS-negative. In the nerve fiber layer (NFL), bNOS-IR was partially colocalized with GFAP (Glial fibrillary acidic protein)-IR in astrocytes. This bNOS labeling was similar between the wild type and bNOS-knockout mice. GFAP is widely used as a marker for retinal astrocytes in a variety of animals (Provis, 2001). We used monoclonal rat anti-GFAP (Zymed Lab. Inc., CA, 13-0300, lot 51101613R) with a dilution of 1:1000 in this study. This antibody was raised against enriched bovine glial filaments and it only reacted with a 55 kDa protein in astrocytes. Its staining pattern in our results was similar to the staining patterns of other anti-GFAP antibodies in the retinas of mouse, rabbit and monkey (Dorrell et al., 2002; Schnitzer, 1988). A nuclear dye, TO-PRO-3 (1: 5000, Invitrogen, Carlsbad, CA) was used to visualize nuclei in retinas.
Retrograde-labeling of ganglion cells and immunohistochemical staining
In order to more precisely distinguish GCs and ACs, we retrogradely labeled the whole population of GCs. A mixture of Neurobiotin, a gap-junction-permeable dye (NB, MW 322.85, Vector Laboratories, CA), and Lucifer yellow, a less permeable dye (LY, MW 457.24, Sigma, MO) (Vaney, 1991; Mills and Massey, 1995; Cook and Becker, 1995), were used for the labeling. The cells double-labeled by LY and NB were recognized as GCs. The cells that contained only NB but no LY were identified as being coupled with GCs. We selected freshly dissected eyeballs with attached optic nerve stump to perform retrograde-labeling. First, the nerve stump was dipped into a small drop of a cocktail that contained 3% LY and 8% NB in the internal solution (see below) to allow the axons within the optic nerve to take up the dyes. Afterwards, the eyeball was thoroughly rinsed with pre-oxygenated Ame’s medium (Sigma) to remove the extra dye. The above procedures were carried out under the illumination of dim red light, and then the eyeball was dissected under infrared illumination. The eyecup with intact retina and sclera tissue was transferred into fresh oxygenated Ame’s medium and kept at room temperature for one hour under a 15 min-dark/15 min-light cycle (white light with an intensity of 0). This procedure was to excite ON- and OFF center GCs equally during the labeling. Subsequently the whole retina was carefully isolated under infrared illumination. The whole retinas were fixed in darkness in 4% paraformaldehyde (Electron Microscope Science, PA) and 0.5 % glutaraldehyde (Sigma) in phosphate buffer (D-PBS, Invitrogen, CA), pH 7.4, for 30–45 min in room temperature. The retinas were blocked with 10% donkey serum (Jackson Immunoresearch) in TBS (D-PBS with 0.5% Triton X-100 (Sigma) and 0.1% NaN3 (Sigma), pH 7.2) for 2 hours in room temperature or in 4°C overnight to reduce nonspecific labeling. Afterwards, the retrogradely filled whole retinas were incubated in Cy3-conjugated streptavidin (1:200, Jackson Immunoresearch, PA) in 3% normal donkey serum-TBS for 1 day in 4°C. The retinas with clearly and evenly double-labeled GCs were selected for further tests.
The retinas were subsequently cut into 40 μm-thick vertical sections with a vibratome. The whole-mounted retinas or free-floating sections were incubated in primary antibodies in the presence of 3% donkey serum-TBS for 3–5 days in 4°C. Controls lacking primary antibodies were also processed. Following several rinses, the slices and whole retinas were then transferred into Cy3- and/or Cy5-conjugated secondary antibodies (1:200, Jackson Immunoresearch) and/or Alexa Fluor 488-conjugated secondary antibodies (1:200, Molecular Probes, CA), in 3% normal donkey serum-TBS solution at 4°C overnight. After extensive rinses, the slices and whole retinas were coverslipped. Two small pieces of filter paper (180 μm thick, MF-membrane filters, Millipore, MA, USA) were mounted beside the whole retinas to prevent them from being over-flattened.
The slides were observed with a laser scanning confocal microscope (LSM 510, Carl Zeiss, Germany). Images were further processed in Adobe Photoshop v6.0. In the mouse retina, a subpopulation of cells contained barely detectable amount of bNOS and was labeled rather weakly by anti-bNOS antibody (see results). To enhance the visibility of these cells, we deliberately enhanced the brightness and contrast of the micrographs. The background noise was, therefore, higher in these images. Also for clarity, some images were presented in black and white, in which fluorescent signals were in white against a dark background; and some images were inverted as well, in which fluorescent signals were in black against a bright background.
Whole-cell voltage clamp recording and light stimulation
We performed a systematic voltage clamp analysis on AC light responses in the mouse retina. The excitatory and inhibitory current responses in ACs were separated by holding the membrane potential to chloride or cation equilibrium potential (EC and ECl, respectively), so that the bipolar cell (BC) contributions to ACs’ light responses (cation currents, ΔIC, recorded at ECl) and AC contributions to ACs’ light responses (chloride currents, ΔICl, recorded at EC) could be studied individually. Since the mouse rod pigment’s sensitivity to 500 nm light is about 2 log units higher than that of the M-cone pigment, and about 4 log units higher than that of the S-cone pigment (Lyubarsky et al., 1999), we use the response threshold to 500 nm lights to estimate the relative rod/cone contributions to ΔIC and ΔICl in each AC. Another advantage of this approach is that the individual cell morphology can be easily revealed by LY filling with the recording electrode. This allows us to characterize the morphology of each recorded cell.
To maintain the retina in fully dark-adapted state, all procedures were performed under infrared illumination with dual-unit Nitemare (BE Meyers, Redmond, WA) infrared scopes. Preparation of living retinal slices essentially followed the procedures described in previous publications (Werblin, 1978; Wu, 1987). Oxygenated Ames solution (adjusted at pH 7.3) was introduced continuously to the recording chamber, and the medium was maintained at 35°C by a temperature control unit (TC 324B, Warner Instruments, CT). A photostimulator was used to deliver light spots (of diameter 600-1,200 μm) to the retina via the epi-illuminator of the microscope. The intensity of unattenuated (log I = 0) 500 nm light was 1.4 × 10⁶ photons μm−2 sec−1. The number of photoisomerizations per rod per second (Rh*rod−1sec−1) was estimated using methods addressed in a previous publication (Pang et al., 2003). Since we delivered un-collimated stimulus light beams through an objective lens with a large numerical aperture (Zeiss 40x/0.75 water), the incident light entered the retinal slice in many directions, and thus the effect of photoreceptor self-screening was minor (Field and Rieke, 2002).
Voltage-clamp recordings were performed with an Axopatch 700B amplifier connected to a DigiData 1322A interface and pClamp software v9.2 (Axon Instruments, Foster City, CA). Whole cell voltage clamp recordings were conducted with patch electrodes made with Narishige or Sutter patch electrode pullers. The electrodes had 5–7 MΩ tip resistance when filled with an internal solution containing 118 mM Cs methanesulfonate, 12 mM CsCl, 5 mM EGTA, 0.5 mM CaCl2, 4 mM ATP, 0.3 mM GTP, 10 mM Tris, and 0.08 % LY, adjusted to pH 7.2 with CsOH. For a minority of recordings the electrodes contained 2% NB, instead of LY. ECl, with this internal solution was about −60 mV. The liquid junction potential at the tip of the patch electrode was compensated prior to seal formation with pClamp software. In order to ensure better space-clamping, we selected cells with higher input resistance (>500 MΩ) for further recording. The recordings were performed on 200 μM-thick retinal slices. To avoid damaged cells, we recorded only from cells that were 2–3 cell layers below the surface of the retinal slices.
LY fluorescent images were acquired with a 40X water immersion objective (NA= 1.20), using the 458 nm excitation line of an argon laser, and a long pass 505 nm emission filter. Consecutive optical sections were superimposed to form a single image using the Zeiss LSM-PC software. And these compressed image stacks were further processed in Adobe Photoshop v6.0 to improve the signal-to-noise ratio. Since signal intensity values were typically enhanced during processing to improve visibility of smaller processes, the cell bodies and larger processes of some cells appear saturated due to their larger volume of fluorophore. The level at which dendritic processes stratified in the IPL was characterized in retinal vertical sections by the distance from the processes to the distal margin (0%) of the IPL.
Data analysis
All data are presented as mean ± standard deviation of the mean. The difference between data groups was analyzed by student t-test. Histograms of the closest distance of individual somas to the nearest neighbor were plotted and further analyzed by Sigmaplot software v8 (Systat, CA, USA). The data was fitted by the normal Gaussian distribution equation:
Where p(r) is the probability density of finding the nearest cell at a distance of r from an arbitrarily chosen cell, μ is the mean distance, σ is the standard deviation of the measurements and k is a normalizing factor (Wässle and Riemann, 1978). The statistical significance of the non-linear regression was determined by t-test and variance analysis from Sigmaplot.
The peak amplitudes of light-evoked current responses were plotted against light stimulus intensity, and data points were fitted by Hill equation:
Where R is the current response amplitude, Rmax is the maximum response amplitude, σ is the light intensity that elicits a half-maximal response, N is the Hill coefficient, tanh is the hyperbolic tangent function and log is the logarithmic function of base 10. In this article, we use the R–logI plot for our analysis (the right-hand term of the above equation, and for such plots the light intensity span (dynamic range: range of intensity that elicits responses between 5% and 95% of Rmax) of a cell equals 2.56/N (Thibos and Werblin, 1978).
Results
Whole retinas retrogradely filled by NB and LY were stained for NB before sectioning and further labeling. Only the retinas successfully labeled by NB and LY were chosen for further experiments. The labeling technique described in the methods yielded even and bright labeling in a majority of retina preparations. In the successfully labeled whole retinas, NB and LY highlighted the axon bundles, the somas and fine processes of GCs and displaced GCs all over the entire retina (Fig. 1). The fluorescent signals in retinas presented a diffusion gradient with the strongest labeling in axons, medium labeling in GC somas and relatively weaker signal in the dendritic arbors (Fig. 1). It proved that the retrograde dyes were transported into GC somas via axons. All the LY-positive somas in the GCL and INL contained NB. (Fig. 2a). But a small portion of NB-labeled somas were LY-negative. These cells were assumed to be coupled with GCs and termed tracer-coupled cells (Fig. 2a). The tracer-coupled cells usually contained rather weak NB signal. The NB and LY double-labeled GCs in the GCL made up nearly half of the total neurons in the GCL (Fig. 2a). The diffusion gradient of retrograde dyes made it impossible to use one exposure time to show all the structures clearly in a single micrograph. In most of the micrographs, we intended to show the GC somas, thus the axons may appear to be over-exposed and the dendritic arbors may be invisible. The GC density in the GCL was lower in the most peripheral retina. GC somas in the GCL and INL were generally larger in the peripheral retina than in the center. GC somas were absent beneath large blood vessels (Fig. 2b).
Figure 1.

Confocal micrographs of the GCL in flat-mounted wild type mouse retinas. The retinas are retrogradely labeled by LY and NB. The dyes highlight GCs in entire retinas. The dyes show diffusion gradient, with the strongest labeling in axon boundless, medium labeling in GC somas and weaker labeling in GC dendrites. Open arrow: blood vessels; arrows: axon bundles; LY: Lucifer yellow; NB: neurobiotin; GCL: ganglion cell layer; Scale bars: 100μm in a; 20 μm in b.
Figure 2.

Confocal micrographs of retinas from wild type (W.T., a to e) and bNOS knockout mice (bNOS KO, Nos1tm1Plh−/−, f and g). a is a whole-mounted retina labeled by LY (blue), NB (red) and TO-PRO-3 (green). All LY-positive somas in the GCL and INL contain NB. Weak NB signal is present in a small portion of LY negative somas (asterisks in a). Flat-mounted retinas (b and c) and vertical sections (d and e) from wild type mice are triple labeled by bNOS antibody (green), GFAP antibody (blue) and retrograde dye NB (red). A flat-mounted retina (g) and a retina slice (f) from bNOS knockout mouse retina are triple labeled by bNOS antibody (green), NB (red) and LY (blue). The bNOS-IR is not colocalized with LY and NB in the images. bNOS-IR somas are present in the GCL and INL in wild type mouse retinas (b to e), but are absent in the bNOS knockout mouse retinas (g and f). Some bNOS-IR somas are labeled weakly (asterisks in b and c). The bNOS-IR in the NFL (b, e and g, arrows), being partially colocalized with the GFAP-IR, is present in both wild type and bNOS knockout mice. Open arrow in b: blood vessels; IR: immunoreactive; LY:Lucifer yellow; NB: neurobiotin; INL: inner nuclear layer; IPL: inner plexiform layer; GCL: ganglion cell layer; NFL: nerve fiber layer. Scale bars: 20 μm.
Three major morphological types of NOACs were observed in the mouse retina and a small portion of them exhibited dye-coupling with ganglion cells
The anti-bNOS antibody used in this experiment specifically identified a small population of cells in the INL and GCL. It generated rather low background staining in other retinal areas except for the nerve fiber layer (NFL, Figs 1–4). The astrocytes in the NFL revealed by anti-GFAP antibody were partially labeled by anti-bNOS (Fig 2b); all the NOS-IR cells in the INL and GCL were negative for GFAP (Fig. 2b to e). Some bNOS-IR cells in the INL were brightly labeled, which were designated as NI cells (Fig. 3). The remaining bNOS-IR cells were labeled weakly and designated as NII cells (Fig. 4). In the GCL, most bNOS-IR cells were usually labeled weakly and were displaced cells (Fig. 2 and 4). The bNOS-IR in NI and NII cells can be compared in figure 2c, 3d and 6a, in which both types of cells are present side by side. In figure 4, we deliberately enhanced the brightness of the green channel (bNOS-IR), so that NII cells could be observed more clearly. Due to such image adjustment, the noise in the IPL in figure 4 is also higher than that in figure 3. In retrogradely labeled retinas, bNOS-IR cells in the INL and GCL were often negative for LY and a great majority of them contained no NB either, which confirmed that bNOS-IR cells were ACs (Fig. 2 to 5). Interestingly, in a minority of NI cells (13% cells, 4/30), were colocalized with NB, suggesting that these ACs were dye-coupled with GCs (Fig. 2a and 5).
Figure 4.

Weakly stained bNOS-IR neurons (NII). a–d are stacked confocal micrographes of vertical retinal sections that are double labeled for bNOS (green in left panels and black in right panels) and NB (magenta in left panels). The brightness of the bNOS signals is deliberately enhanced. The images show morphological variation of NII cells: stratified NIIin a and b, pyramidally branched NII in c and d, and displaced monostratified cells in d (asterisk). NB does not label these bNOS-IR cells, indicating no gap junctions between these cells and GCs. IR: immunoreactive; NB: neurobiotin; INL: inner nuclear layer; IPL: inner plexiform layer; GCL: ganglion cell layer; NFL: nerve fiber layer; Scale bar: 20 μm.
Figure 3.

Strongly stained bNOS-IR neurons (NI). a–d are stacked confocal micrographs of vertical retinal sections that are double-labeled for bNOS (green in left panels and black in right panels) and NB (magenta in left panels). The images show morphological variation of NI cells: narrowly monostratified NI cells (in a and b) and broadly monostratified NI cells (in c and arrow in d). The single apical dendrites of the cells branch into secondary dendrites at the level of 20% to 40% of IPL depth and extend in the lamina near 50% of the IPL depth. The gap junction-permeable tracer NB was backfilled into GCs. NB does not label these NI cells, indicating no gap junctions between these cells and GCs. Astrocytes in the NFL are partially colocalized with the bNOS-IR; and the labeling is presumably nonspecific. The OSL and OPL are weakly labeled. NB: neurobiotin; IR-immunoreactive; OSL: outer segment layer; ONL: outer nuclear layer; OPL: outer plexiform layer; INL: inner nuclear layer; IPL: inner plexiform layer; GCL: ganglion cell layer; NFL: nerve fiber layer; Scale bar: 20 μm.
Figure 6.

Topographical distribution of bNOS-IR neurons. a, b and c are stacked confocal micrographs of horizontal optical sections crossing a flat-mounted retina. In the INL (a) are observed strongly stained somas of NI cells and weakly stained somas of NII cells. Most bNOS-IR somas in the GCL (c) are weakly stained. A loose network is formed primarily by the dendrites of NI cells (b). The distributions of the somas are depicted in d for NI cells, e for NII cells and f for the displaced cells. The triangles in d2~f2 denote the optic nerve head. In d1, e1 and f1, are shown the histograms of the distance to the nearest neighbor for each type of NOACs, which are superimposed with normal Gaussian distribution fitting curves. The abscissa in the histograms represents the bin of the distance, and the ordinate represents the count of cell number. It indicates that the distributions are well fit by normal Gaussian function. D: dorsal; T: temporal; V: ventral; N: nasal; INL: inner nuclear layer; IPL: inner plexiform layer; GCL: ganglion cell layer; Scale bar: 20 μm in a~c, 921 μm in d2, e2 and f2.
Figure 5.

Tracer-coupled NI cell. a and b are stacked confocal micrographs of vertical retinal sections that are triple labeled for bNOS (white in a1 and b1, and green in a3 and b3), NB (white in a2 and b2, and red in a3 and b3) and LY (blue in a3 and b3). GCs were retrogradely labeled by NB and LY. The NI cell (in a) contains weak NB signal but no LY, suggesting that the cell obtains NB from GCs through gap junctions. GCs (in a and b), including displaced GCs (in b, asterisks), are double stained by LY and NB (in purple, a3 and b3), but none of them are positive for bNOS. LY: Lucifer yellow; NB: neurobiotin; GCs-ganglion cells; INL: inner nuclear layer; IPL: inner plexiform layer; GCL: ganglion cell layer; NFL: nerve fiber layer; Scale bar: 20 μm.
To analyze the morphology of bNOS-IR ACs, we took consecutive micrographs over each targeted cell and reconstructed three-dimensional images of the cell. The images in figure 3, 4 and 5 were taken from retinal slices of 40 μm thickness and the images in figure 7 and 8 were from 200 μm-thick retinal slices. Whether a bNOS-IR profile belonged to an AC was verified by rotating the three-dimensional image of the cell to find the connection between the bNOS-IR to the soma. Only the bNOS-IR profiles that had a clear connection with the soma were recognized as a part of the cell. We used highlighted somas of GCs and NOACs as IPL boundaries. This IPL definition was very helpful for us to accurately describe the location of bNOS-IR process in the IPL. In fixed retinas the diameter of most dentritic processes of NOACs was less than 2 μm; but the thickness of the IPL was near 40 μm. We felt that it was hard to precisely define the location of the dendritic processes in the IPL in whole mount retinal preparations, even with a confocal microscope. Thus in this study the location of the dendrites was primarily examined in slice preparations.
Figure 7.

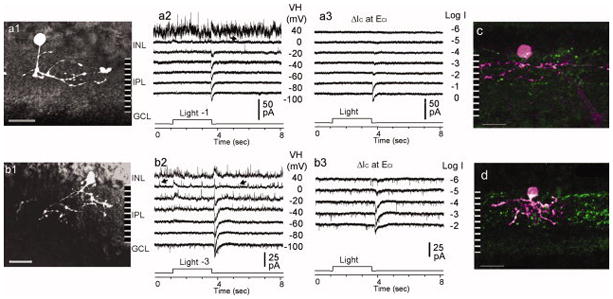
Light responses and individual cell morphology of NI cells in the mouse retina. The light-evoked current responses to 2.5 s light steps (500 nm, −4.0 (4.0 log unit attenuation)) at various holding potentials (VH) (a2 and b2) and various light intensities (at ECl only) (a3 and b3) were recorded from a narrowly mono-stratified NI cell (a1) and a broadly mono-stratified NI (b1) cell. Both of the cells exhibit ON-OFF-type light responses with small spontaneous excitatory postsynaptic currents (EPSCs, arrows in a2 and b2) and small ΔICl. The ΔIC at light offset (ΔIC_offset) is more substantial than ΔIC at light onset (ΔIC_onset). ΔIC_onset is more transient in the NI cell in a, but more sustained in the NI cell in b. The cells in c and d were filled with NB during recording and stained for NB (red) and bNOS (green) thereafter. c- a narrowly mono-stratified bNOS-IR NI cell; b- a broadly mono-stratified bNOS-IR NI cell. NB: neurobiotin; ACs: amacrine cells; IR: immunoreactive; EC: cation equilibrium potential; ECl: chloride equilibrium potential; INL: inner nuclear layer; IPL: inner plexiform layer; GCL: ganglion cell layer; ΔIC: light-evoked cation currents recorded at ECl (near −60 mV in the experimental condition); ΔICl: light-evoked chloride currents recorded at EC (near 0 mV); Scale bar: 20 μm.
Figure 8.
Light responses and individual cell morphology of NII cells in the mouse retina. The light-evoked current responses to 2.5 s light steps (500 nm, −1.0 or −3.0 (1.0 or 3.0 log unit attenuation) at various holding potentials (VH) (a2 and b2) and various light intensities (at ECl only) were recorded in a stratified NII (a1) and a pyramidally branched NII (b1) cells. Both of the cells typically exhibit OFF-type light responses, which are characterized by a large transient ΔIC at light offset (ΔIC_offset). Both types of the cells show spontaneous inhibitory postsynaptic currents (IPSCs, at EC, arrows in a2 and b2), small ΔICl and tiny sustained ΔIC during light ON; but the currents are slightly larger on pyramidally branched cells. The cells in c and d were filled with NB during recording and were stained for NB (red) and bNOS (green) thereafter. c- a stratified bNOS-IR NII cell; d- a pyramidally branched bNOS-IR NII cell; NB: neurobiotin; ACs: amacrine cells; IR: immunoreactive; EC: cation equilibrium potential; ECl: chloride equilibrium potential; INL: inner nuclear layer; IPL: inner plexiform layer; GCL: ganglion cell layer; ΔIC: light-evoked cation current recorded at ECl (near −60 mV in the experimental condition); ΔICl: light-evoked chloride current recorded at EC (near 0 mV); Scale bar: 20 μm.
We further studied the morphology of NOACs in slice preparations using a confocal microscope. The soma size was measured in confocal micrographs in steps of 0.01 μm. Figure 3 shows the morphology of NI cells. The strongly labeled NI somas were typically pear-shaped and the major axis averaged 16.76±2.62 μm (n=25 cells) and the minor axis averaged 9.84±1.31 μm (n=25 cells). Their nuclear areas were nearly bNOS-negative in contrast with the extensively stained large cytosols. The diameter ratio of nucleus to cytosol was small in NI cells (≥1/2). The nuclear area was situated near the second row of somas in the INL. The single apical dendrites of the cells branched into secondary dendrites at the level of 20% to 40% of IPL depth. Their dendritic arbors, whether sparsely or extensively branched, were located near the center of the IPL (Fig. 3).
The morphology of NII cells is shown in figure 4. NII cells had weakly labeled somas in various shapes and the major axis averaged 13.12±2.62 μm (n=24 cells), which was significantly smaller than that of the NI cells (p<0.001). The minor axis was similar to NI cells, averaging 9.12±1.35 μm (n=24 cells). The diameter ratio of nucleus to cytosol was large in NII cells (≥1/2). The cytosols were moderately labeled for bNOS and appeared as thin shells on the bubble-like, nearly bNOS-negative nuclei. The somas were frequently found near the first row of the somas in the INL. NII cells exhibited either stratified or pyramidally branched dendritic trees. Stratified cells usually had more than two primary dendrites. They emitted predominantly horizontal branches, either bi-stratifing in 10% and 50% of the IPL depth (Fig. 4a), or tri-stratifing in 10%, 40% and 60% of the IPL depth (Fig. 4, b and c). NII cells might also possess pyramidal dendritic trees. Their fine processes often ended near 65% of the IPL depth (Fig. 3, d and e).
The displaced bNOS-IR ACs were usually weakly labeled; and their dendrites were found to narrowly ramify around 50% of the IPL depth. (Fig. 2, b and d, asterisk in Fig. 4d). A few displaced NOACs were observed with weak NB labeling (2/45 cells). It was estimated that 5.71% of the total bNOS-IR somas in the INL and GCL were dye-coupled with GCs (6/104 cells).
Topographical analysis of bNOS-IR neurons in the INL and GCL
The distribution of the NOACs was studied in 3 complete retinas from 3 animals with a 40x oil-immersion objective on a confocal microscope. In the flat-mount retinas, somas of NI cells were brightly labeled, just as seen in the slice preparations (Fig 6a). Their single apical dendrites usually branched into 4–6 very long secondary dendrites in the middle of the IPL. These processes formed a loose but complete network at the center of the IPL (Fig. 6b). Some of the dendritic processes from NII cells and the displaced cells also joined in the network. The somas of NII cells (Fig. 6a) and most displaced cells (Fig. 6c) were labeled weakly by anti-bNOS antibody. The soma sizes of displaced cells were measured from flat-mounted retinas. The major axis was 12.73±1.21 μm and the minor axis was 8.91±1.38 μm (n=23 cells).
To quantitatively analyze the regularity of NOAC distribution in the retina, we performed a nearest-neighbor analysis (Wässle and Riemann, 1978) on randomly chosen confocal micrographs taken from a whole retina. The distance of individual somas to their nearest neighbor was measured for each type of cell in steps of 0.01 μm. It was found that NI, NII and displaced cells are arranged in a regular mosaic. Their distributions were well fit by the gaussian function (p<0.001) (Fig. 6). The average distance to the closest neighbor was 90±41 μm (n=123 cells) for NI somas, 68±37 μm (n=120 cells) for NII somas, and 58±34 μm (n=134 cells) for displaced NOACs. The distribution regularity (R), graded by the ratio of the mean distance to the standard deviation (Wässle and Riemann, 1978), was the highest for NI cells (R=2.19), medium for NII cells (R=1.84) and the lowest for displaced cells (R=1.71). In figure 6, the drop of the regularity from left to right was immediately obvious. The total numbers of NI, NII and displaced bNOS-IR cells per retina were counted as 558±55, 574±43, and 667±65 respectively, and their densities were calculated as 30±3 cells/mm2, 30±3 cells/mm2 and 39±4 cells/mm2 respectively. NI cells make up 31% of the total population, NII cells 32% and displaced cells 37%. On three whole-mount retinas, we also performed triple labeling with anti-bNOS antibody, NB and LY. Consistent with the data from slices, bNOS-IR was seldom colocalized with LY and NB.
The cells with NI-morphology exhibit highly sensitive ON-OFF light responses; and the cells with NII -morphology exhibit less sensitive OFF light responses. The light responses were abolished by DNQX
Morphology is one of the most important characteristics for identifying retinal neurons. It has been widely used to classify subtypes of bipolar cells, GCs and ACs (Kolb et al., 1981; Wu, et al, 2000). Retinal ACs have been studied preferentially in primate, cat and turtle retina. In these species, near 30 subtypes of ACs have been anatomically described from whole mount retinas (Kolb, 1997; Kolb et al., 1981). However, corresponding information for ACs in the mouse retina is still missing. NOACs comprise a very small population in the mouse retina (Jeon et al., 1998). Therefore, there is a low probability of encountering them in physiological recordings. In this study, we had recorded 156 ACs in the mouse retina. From these recordings, the images of individually recorded cells revealed more than 20 subtypes of ACs (data not shown). By comparing such fluorescent images to the morphology of NI and NII cells and further staining some of the recorded cells for bNOS, we identified 21 cells as NOACs. The images of the recorded cells (a and b) showed in figure 7 and 8 were obtained from living retinas. Without being shrunk by fixation and being individually highlighted by LY, the recorded cells often showed thicker and softer dendrites than their counterparts in fixed retinas. Their soma shape may be changed due to whole-cell recording and removing the recoding pipette. In both fixed and living retinas, NI cells generally showed medium-field dendritic arbors (100 to 400 mm) that stratified primarily in the center of the IPL; and NII cells usually exhibited small-field dendritic trees (<100mm) that stratified or pyramidally branched in the sublamina a.
The results showed that NI cells (n=6 cells/animals) displayed uniform ON-OFF depolarizing light responses and NII cells (n=8 cells/animals) exhibited OFF depolarizing light responses. The morphology and the light responses of the NI cells are shown in figure 7, and that of the NII cells in Figure 8. In figure 7 the two types of NI cells exhibited similar waveform of ON-OFF light responses with large depolarizing peak currents at light on- and offset, small spontaneous excitatory postsynaptic currents (EPSCs, arrows in Fig. 7, a2 and b2), high light sensitivity, wide dynamic ranges and small light-evoked ΔICl (Figs. 7 and 9). The light-evoked ΔIC at light offset (ΔIC_offset) was more substantial than that at light onset (ΔIC_onset). The threshold was −9 (9 log unit of attenuation) for ΔIC_offset and −8.6 for ΔIC_onset. The dynamic range was 5.7 log units for ΔIC_offset and 5.4 log units for ΔIC_onset. The differences between the two cells were minor and were primarily seen in the density of the dendrites in the IPL and the waveform of the ΔIC_onset. The cells with more branches displayed more sustained ΔIC_onset (Fig. 7b). These results indicated that NI cells receive similar pre-synaptic inputs. It further suggests that NI cells comprise a homogenous cell population.
Figure 9.

Light sensitivity of NOACs. The amplitudes of ΔIC are normalized and plotted as a function of the light intensity in log unit (log I). Each data point represents the amplitude of ΔIC from individual cells at a certain light intensity. Filled and open symbols represent the ΔIC_offset for NI (n=5) and NII cells (n=5), respectively (a). Gray symbols depict ΔIC_onset of NI cells (n=4, in b). The data is fitted by Hill equations as described in the methods. The fitting curves of the offset responses reveal a wide dynamic range for both NI and NII cells. However, NI cells display uniformly high light sensitivity (solid fitting curve in a), and NII cells display lower light sensitivity with large variation (broken fitting curve in a). ΔIC_onset and ΔIC_offset of NI cells exhibit similar light sensitivity and dynamic range (b). ΔIC: light-evoked cation current; ΔIC_Onset: ΔIC at light onset; ΔIC_Offset: ΔIC at light offset.
NII cells were more variable in morphology compared to NI cells, but they all possessed an outstanding light-evoked ΔIC_offset (Fig. 8). They possessed spontaneous inhibitory postsynaptic currents (IPSCs, arrows in Fig. 8, a2 and b2) and tiny outward sustained ΔIC during light ON (Fig. 8), but those currents were slightly larger in the pyramidally branched cells than in the stratified ones. Spontaneous intermediate-sized EPSCs and light-evoked ΔICl only occurred in the pyramidally branched cells. According to the fitting curve of ΔIC_offset (Fig. 9), NII cells were about 2-log units less sensitive than NI cells; but the light sensitivity among NII cells exhibited extensive variation. The thresholds of ΔIC_offset ranged from −8 to −1. This indicates that the presynaptic OFF BCs are quite different among NII cells. Therefore, unlike NI cells, NII cells represent a heterogeneous cell population.
As a general population, NII cells had OFF light responses, with a lower mean light sensitivity and a wider mean dynamic range (−7.5 and 6.8 log units, respectively); while NI cells had ON-OFF light responses, higher light sensitivity and slightly narrower dynamic range. Because of this, NOACs were equipped with a wider dynamic range in detecting light offsets, but a slightly narrower dynamic range for detecting light onsets. Light onsets activated only NI cells with a dynamic range of 5.4 log units; but light offset activated both NI and NII cells with a combined dynamic range of 8 log units. The light-off signals activated both NI and NII cells in the light intensity range between −7.5 to −3.3, only NI cells between −9 and −7.5 and just NII cells between −3.3 and −1. These data demonstrated that the population of NOACs is asymmetrically modulated by retinal on- and off-pathways and the off-pathway mediates more activities.
More over, NI and NII cells primarily generated transient light responses at light on- and offsets. This indicates that light-evoked ΔIC in NOACs preferentially encode the change of environment illumination and are less sensitive to stable illumination levels. Additionally, we analyzed the kinetics of the light responses elicited by subsaturating (saturation intensity −1) 2.5 s light steps. We examined peak widths and delays of ΔIC_onset and ΔIC_offset. The peaks referred to the transient portions that rose beyond the sustained components; and the delays referred to the time from light onsets to the beginning of ΔIC_onset or from light offsets to the start of ΔIC_offset. The peak width was 334±64 ms (n=5) for ΔIC_onset in NI cells, 215±33 ms (n=5) for ΔIC_offset in NI cells and 236±57 ms (n=5) for ΔIC_offset in NII cells. The ΔIC_onset in NI cells was delayed 118±26 ms; and the ΔIC_offset was delayed 137 ±32 ms in NI cells and 125 ±6 ms for NII cells. The light stimulation efficiency in eliciting ΔIC was rated with the total peak charges of ΔIC versus the time for light ON. In NI cells, we found that within a wide duration range (from 12 to 2500 ms), two light durations, 140 ms and 750 ms, yielded the maximum stimulation efficiency. With these results, we proposed two flicker patterns to be the most optimal in evoking ΔIC in NI cells, a flicker with 140 ms light-on duration and a period about 462 ms (118 ms of delay + 334 ms for onset peak) giving a frequency around 2.21/sec, and a flicker with 750 ms light-on duration and a period around 1102 ms (750 ms light +137 ms offset delay + 215 ms offset peak) giving a frequency about 0.91/sec (Fig. 10). These optimal periods or frequency presumably represent the optimal neurotransmitter releasing period or frequency and minimum flicker fusion periods or frequencies, as well.
Figure 10.

Light durations and frequencies. A series of light durations, ranged from 12 to 2500 ms (a), were used to evoke ΔIC (b) on a NI cell. The delays of ΔIC_onset are rather stable. The peak widths ofΔIC_onset are not clearly related to light duration for shorter light steps (12 to 180 ms). Longer light steps cause sustained inward ΔIC during light on. Along with the elongation of light duration, the amplitude of offset peak gradually grows, but the peak width becomes progressively shorter. Two optimal flicker patterns are showed in c with a light on time of 750 ms and 140 ms. Light: 500 nm, −4; ΔIC: light-evoked cation current; ΔIC_Onset: ΔIC at light onset.
Further more, the light responses of both NI and NII cells were largely abolished by 40 μM DNQX. This indicated that the light responses in NOACs were primarily mediated by AMPA/KA receptors (Fig. 11).
Figure 11.

Effect of DNQX on light responses in NI and NII cells. The light-evoked currents are recorded at various holding potentials (VH). The light-evoked currents in a NI (the cell a in Fig. 7) and a NII (the cell b in Fig. 8) cell are blocked by 40 μM DNQX applied in bath. Light: 500 nm.
Discussion
bNOS immunoreactive neurons in the INL and GCL are amacrine cells
NOS-IR somas in both the INL and GCL, as reported previously, have been assumed to be ACs. Indeed, even without using specific methods to exclude GCs, NOS-IR somas in the INL are less likely to be confused with GCs, because very few GC somas (1–2%) in the mouse retina (Drager and Olsen, 1981) are displaced in the INL. NOS-IR somas in the GCL, however, are more easily to be confused with GCs, since about 40% of the somas there are GCs (Jeon et al., 1998). Also, some displaced NOS-IR cells were suspected to be GCs (Haverkamp et al., 2000). In order to precisely identify NOACs, we labeled bNOS with a specific antibody and GCs with retrograde dyes. In our data, retinas were labeled by specific anti-bNOS antibody against a very clear GC background. With this approach, we found that bNOS-IR neurons in both the INL and GCL were ACs.
A positive correlation is suggested between the amount of NO release from NOACs and the extent and frequency of the light intensity change
NOACs are an important subpopulation of ACs in the mammalian retina, yet their light responses have not been studied before. In this paper, we have for the first time described the light responses in the morphological identified NOACs. The light responses of the cells correspond with the general designation of sublamina a and b of the IPL (Pang et al., 2002b; Famiglietti et al., 1976; Nelson et al., 1978). By ramifying in the middle of the IPL, NI cells can receive excitatory inputs from both ON- and OFF-BCs and thus show inward ΔIC at both light on- and off-sets. Ramifying in sublamina a, NII cells are able to receive inputs from OFF BCs and thus generate inward ΔIC at light offset. Unlike ΔIC, the light-evoked ΔICl that represents the inhibitory inputs from ACs was relatively small in these NOACs. The results are also in line with the previous reports that retinal NO release (detected by DAF fluorescency), is enhanced by light, especially by flashing light (Eldred and Blute, 2005; Giove, et al, 2009).
In previous studies, NO generation was found to be positively correlated with a transient increase of intracellular Ca2+ concentration ([Ca2+]i) (Schmidt et al., 1992). But it is not clear whether [Ca2+]i and NO release are quantitatively related to light. Our results showed that light steps evoked transient depolarizing ΔIC in NOACs, which would transiently increase [Ca2+]i and enhance NO release if the cell membrane expresses functional calcium channels. Ordinarily a [Ca2+]i increase can be caused by opening of either voltage- or ligand-gated calcium channels in cell membrane (Akopian and Witkovsky, 2002). ACs in low vertebrate retina have been found to express voltage-gated calcium channels (Maguire, 1999; Vigh and Lasater, 2004). And the Ca2+ permeability of AMPA/KA receptors has also been shown in variety of neurons. These include AII cells (Morkve et al., 2002) and GCs (Zhang et al., 1995) in the rat retina, neurons in the hippocampus (Silva et al., 2001), cerebellum (Brorson et al., 1994) and spinal cord (Vandenberghe et al., 2000), and even neurons that express GluR2 (Vandenberghe et al., 2000), despite that in earlier reports only the AMPA/KA receptors lacking GluR2 subunits were found to be Ca2+ permeable (Hollmann et al., 1991). Thus, it is likely that light-evoked depolarization in NOACs is able to enhance [Ca2+]i and trigger their NO release. A direct measurement of light-induced Ca2+ currents and NO release in NOACs in the future will be helpful to further confirm this possibility.
In the results, a positive relation was revealed between the amplitude of light-evoked ΔIC and the extent of the light intensity change. A flickering light with a frequency of about 1 to 2 Hz was found to be the most efficient in evoking ΔIC peaks. If light-evoked membrane depolarization opens Ca2+ channels in NOACs as proposed, then Ca2+ -dependent NO release should also be positively related to the extent of the light intensity change. Based on this presumption, flickering lights or abrupt transitions from light to dark could elevate the NO level in ocular tissue. These data suggest that light stimuli may be able to regulate NO release, which implies a novel treatment for NO-related ocular disorders.
NI cells exhibited highly sensitive light-evoked currents at light offset
In scotopic conditions, two light pathways have been discovered to carry rod-driven light-off signals to GCs (Muller et al., 1988; Soucy et al., 1998; Volgyi, et al., 2004; Protti et al., 2005). They are referred to as alternative rod pathways, in which rod signals either flow to the cone pedicles via gap junctions (DeVries and Baylor, 1995) or directly contact OFF-center cone BCs (Tsukamoto et al., 2001; Soucy et al., 1998; Li et al., 2004). However, these important pathways have not been examined in mammalian retinal ACs. In this report, we showed that ON-OFF ACs (NI cells) displayed highly sensitive offset light responses. The offset responses were characterized by large excitatory currents (threshold around −9 or 0.0007 Rh*rod−1sec−1) and small inhibitory currents, demonstrating that they were driven by rods and dominated by OFF BCs. Thus, the alternative rod pathways appear to mediate the offset responses in NI cells, in which the signals flow along photoreceptors → OFF BCs → ACs.
Rod signals could also reach OFF GCs via a APB- and strychnine-sensitive route, a traditional rod pathway involving rod BCs and AII cells (Muller et al., 1988; Protti et al., 2005). In this pathway the scotopic signals can bypass OFF BCs, since AII ACs can directly make inhibitory synapses onto GCs (Kolb and Famiglietti, 1974). These synapses, at least in mouse OFFαGC, are able to dominate scotopic light responses (Pang et al., 2003). In that case, the light signals flows along rods → rod BCs → ONACs (AII) → sustained OFF GCs. However, in the scotopic condition, AII ACs primarily generate excitatory ON-center light response and OFFαGCs exhibit inhibitory ON-center light responses accordingly. Thus, the AII-related classic rod pathway is less likely to dominate the transient offset light responses in NI cells.
Dye coupling is present between some NOACs and ganglion cells
Retinal GCs are coupled with various types of retinal neurons (Vaney, 1991), but it is still not clear what kinds of ACs are coupled to GCs (Volgyi, 2009). In this article, our results revealed for the first time that nearly 6% of NOACs were dye-coupled with GCs. It remains unknown how the dye coupling between NOACs and GCs affects GC function. However, if the coupling is functional, NOACs may be able to contribute highly sensitive light onsets and offsets to GCs through the coupling, even if the GCs do not receive direct inputs from ON or OFF BCs. It is still unclear what subtypes of GCs are coupled to NOACs, though αGCs appear to be suitable coupling partners for ACs. αGCs have been reported to couple with both αGCs and ACs (Pang et al. 2003; Hidaka et al., 2004; Schubert et al., 2005). Beside gap junctions, NOACs also make chemical synapses onto other ACs and GCs (Oh et al. 1999). These chemical synapses are expected to be GABAergic (Kim IB, et al., 1999) and nitric oxidergic; but how the NO release is modulated by presynaptic events is mostly unknown. Our data suggests that presynaptic glutamate release might be responsible for modulation of NO release from NOACs. In addition, NO may modulate GABA and glycine release from ACs (Yu and Eldred, 2005; Hoffpauir et al., 2006), and therefore play an important role in the retinal inhibitory circuitry.
Uniform distribution of NOACs in the mouse retina
We have studied the topographical distribution of NI, NII and displaced NOACs separately in this study. In accordance with previous reports from other species (Chun et al., 1999), we found that the somas of NOACs and the dendrites of NI cells covered the retina evenly. Our data showed that the average distance to the closest neighbor was less than 100 μm for NI, NII and displaced cells. Thus, if NO can diffuse significantly beyond 100 μm (Wood and Garthwaite, 1994; Porterfield et al., 2001), the NO generated from the NOAC network may be capable of reaching all retinal areas. But the data is still controversial regarding how far NO travels beyond its resource in the studies of different approaches. In some recent reports, NO was found highly retained inside retinal cells (Eldred and Blute, 2005; Giove, et al, 2009).
NOACs usually contain GABA (Kim IB, et al., 1999). They make synapse with GCs and other ACs. Our data also showed that they received substantial physiological inputs from BCs. Thus, NOACs are expected to participate retinal light signal transmissions, like regular ACs. On the other hand, NO can modulate GABA and glycine receptor-mediated currents in cultured ACs; and NO induced chloride release from an internal store and caused positive shift of ECl. This action has profound influence on the polarity of GABA and glycine receptor-mediated currents (Hoffpauir et al., 2006), though it is still not clear whether endogenous NO has similar effect in NOACs. From this point of view, NO looks more like a “local modulator”. NO concentration and function are closely related to many factors, e.g., the type, location, expression level and activity of NOS, the concentration of NOS substrates, the speed of NO oxidation, the location of soluble granulate cyclase, and etc. These factors are evidently varied among distinct retinal neurons or cellular compartments (Kim IB, et al., 1999; Eldred and Blute, 2005). The cell or location specification of NO is expected to be more remarkable, when its diffusion is restricted. But even if NO does diffuse, NO signal may still be spatially more restricted for small scale releases comparing to extensive releases. For instance, in the mouse retina, NOACs were less excited by weak light or bright constant light; and under those circumstances, moderate NO releases were expected. However, a strong synchronized release of NO from NOACs (e.g., when NI and NII cells are strongly activated by light offsets, especially the ones with high intensity, large field and a frequency near 1–2 Hz) may enhance, and be enhanced by, NO diffusion, if any. This is most likely to cause a reset of whole retinal function due to NOAC network in the retina; and it may play some roles in retinal dark-adaptation and pathogenesis of retinal diseases. From this point of view, NO or NOACs looks more like a “system modulator”. This exquisite NO system in the retina is worth further investigations.
Three morphological subtypes of NOACs are identified in mouse retina
Based on the ultrastructure of the somas and staining intensity, NOACs were generally classified into two major types in earlier reports (Oh et al., 1999; Kim et al., 2000), namely type I and type II. The type I cells have large extensively stained somas, while type II cells posses small and weakly stained somas. The somas of NI and NII cells observed in this study correspond to the previously reported type I and type II cells. We further revealed several morphological subtypes of NOACs in the mouse retina with a confocal microscope. Consecutive micrographs were routinely taken over individual cells in slice preparations and three-dimensional images of the cells were reconstructed. We found that three-dimensional images were critical for verification of the depth of the dendrites in the IPL and whether a bNOS-IR profile was part of a cell. This approach, however, was limited by the thickness of the retinal slices, and there is a chance that we might have missed some long dendritic processes in slice preparations for the neurons with large dendritic fields. However, our observations on flat-mounted retinas likely compensated for this bias.
In previous reports (Kim et al., 1999; Haverkamp and Wässle, 2000; Giove TJ, et al 2009), bNOS antibodies, especially the one corresponding to the C-terminal of bNOS (Giove TJ, et al 2009), revealed three bands in IPL in the rat, mouse and turtle retina. One band was close to the center of the IPL and the other two bands were close to the boundaries of the IPL. The bNOS antibody directed to the N-terminals (Giove TJ, et al 2009), on the other hand, did not label the band close to GCL as brightly as the C-terminal antibodies did. Morphology of individual NOS-IR cells has not revealed previously. The dendritic trees of our NI, NII and displaced cells, in agreement with the previous findings, covered the center stratum of IPL and the dendrites of our NII cells covered both center and the distal stratums in IPL. The bNOS staining pattern in our results was similar to that of the N-terminal bNOS antibody (Giove TJ, et al 2009). However, the bNOS antibody that we used did not reveal ACs that sent dendrites primarily to sublamina b of the IPL in dark-adapted mouse retina. Additionally, the displaced NOACs that we identified primarily ramified in the center of the IPL, rather than in sublamina b as was observed in the rat retina (Chun et al., 1999). The use of variable species of animals and bNOS antibodies may partially account for the morphological variation among NOS-IR cells in different reports. The antibody that we used was rabbit anti-bNOS 251-270 (immunogen recombinant neuronal NOS fragment, amino acids 251-270) from rat brain (1: 4000, Sigma); and the antibodies that used in the previous studies were rabbit anti-bNOS 1409–1429 (1:3000, Sigma) (Kim et al., 2000; Chun et al., 1999) and mouse anti-bNOS (1–181(?), the only available type in Sigma, not shown in the paper) (Sigma, 1: 50 to 100) (Haverkamp et al., 2000). Additionally, light or dark adaptation may contribute to the morphological variation, since retina is a light-sensitive tissue. We executed the immunohistological labeling in dark-adapted conditions, so we could directly compare the results with the cells that we recorded in dark-adapted retinas. Currently, most immunohistological studies are carried out in daylight, and it is still unclear how light affects the immunoreactivity of retinal neurons. Comparing with the classical types of ACs in other species, our NI cells bear the same morphology with the H type ACs described by Cajal in 1892 in the carp retina. The NI cells, stratified NII, pyramidally branched NII and displaced NOACs also bear some resemblance to the A19, A9, A2 and A14 cells in the cat retina, respectively (Kolb, 1997; Kolb et al., 1981).
In general, this paper documented three morphological subtypes of NOACs in the mouse retina (Fig. 12). The cells with NOAC morphology exhibited AMPA/KA receptor-mediated, transient depolarizing ON-OFF or OFF light responses. These depolarizing light responses and the great potential for NOACs to express functional Ca++ channels strongly suggest that light may be able to quantitatively adjust NO release in the mammalian retina.
Figure 12.

Schematic diagram of major subtypes of NOACs in the mouse retina. NI cells possess large strong bNOS-IR somas. Their dendrites ramify close to the middle of the IPL. NI cells display ON-OFF light responses. NII and displaced NOACs possess smaller and weaker bNOS-IR somas but larger nuclei. The displaced NOACs ramify in the middle of the IPL resembling NI cells. The dendrites of stratified NII cells ramify near 10% and 40% to 60% of the IPL depth; and those of other NII cells cover a pyramidal area in the IPL and terminate near 60% of IPL depth. OFF light responses are revealed on NII cells.
Acknowledgments
This work was supported by NIH Grant 1F32 EY13915 and Knights Templar Eye Foundation to Dr. Ji-Jie Pang and by National Institutes of Health (NIH) Grant EY 04446, NIH Vision Core Grant EY 02520, the Retina Research Foundation (Houston, TX), and Research to Prevent Blindness, Inc to Dr. Samuel M. Wu. We thank Dr. Roy Jacoby for critically reading this manuscript.
References
- Ahmad I, Leinders-Zufall T, Kocsis JD, Shepherd GM, Zufall F, Barnstable CJ. Retinal ganglion cells express a cGMP-gated cation conductance activatable by nitric oxide donors. Neuron. 1994;12:155–165. doi: 10.1016/0896-6273(94)90160-0. [DOI] [PubMed] [Google Scholar]
- Akopian A, Witkovsky P. Calcium and retinal function. Mol Neurobiol. 2002;25:113–132. doi: 10.1385/MN:25:2:113. [DOI] [PubMed] [Google Scholar]
- Brorson JR, Manzolillo PA, Miller RJ. Ca2+ entry via AMPA/KA receptors and excitotoxicity in cultured cerebellar Purkinje cells. J Neurosci. 1994;14:187–197. doi: 10.1523/JNEUROSCI.14-01-00187.1994. [DOI] [PMC free article] [PubMed] [Google Scholar]
- Bugnon O, Schaad NC, Schorderet M. Nitric oxide modulates endogenous dopamine release in bovine retina. Neuroreport. 1994;5:401–404. doi: 10.1097/00001756-199401120-00007. [DOI] [PubMed] [Google Scholar]
- Chiou GC. Review: effects of nitric oxide on eye diseases and their treatment. J Ocul Pharmacol Ther. 2001;17:189–198. doi: 10.1089/10807680151125555. [DOI] [PubMed] [Google Scholar]
- Chun MH, Oh SJ, Kim IB, Kim KY. Light and electron microscopical analysis of nitric oxide synthase-like immunoreactive neurons in the rat retina. Vis Neurosci. 1999;16:379–389. doi: 10.1017/s0952523899162175. [DOI] [PubMed] [Google Scholar]
- Cook JE, Becker DL. Gap junctions in the vertebrate retina. Microsc Res Tech. 1995;31:408–419. doi: 10.1002/jemt.1070310510. [DOI] [PubMed] [Google Scholar]
- Cudeiro J, Rivadulla C. Sight and insight--on the physiological role of nitric oxide in the visual system. Trends Neurosci. 1999;22:109–116. doi: 10.1016/s0166-2236(98)01299-5. [DOI] [PubMed] [Google Scholar]
- Dawson TM, Snyder SH. Gases as biological messengers: nitric oxide and carbon monoxide in the brain. J Neurosci. 1994;14:5147–5159. doi: 10.1523/JNEUROSCI.14-09-05147.1994. [DOI] [PMC free article] [PubMed] [Google Scholar]
- DeVries SH, Baylor DA. An alternative pathway for signal flow from rod photoreceptors to ganglion cells in mammalian retina. Proc Natl Acad Sci U S A. 1995;92:10658–10662. doi: 10.1073/pnas.92.23.10658. [DOI] [PMC free article] [PubMed] [Google Scholar]
- DeVries SH, Schwartz EA. Modulation of an electrical synapse between solitary pairs of catfish horizontal cells by dopamine and second messengers. J Physiol. 1989;414:351–375. doi: 10.1113/jphysiol.1989.sp017692. [DOI] [PMC free article] [PubMed] [Google Scholar]
- Dorrell MI, Aguilar E, Friedlander M. Retinal vascular development is mediated by endothelial filopodia, a preexisting astrocytic template and specific R-cadherin adhesion. Invest Ophthalmol Vis Sci. 2002;43:3500–10. [PubMed] [Google Scholar]
- Drager UC, Olsen JF. Ganglion cell distribution in the retina of the mouse. Invest Ophthalmol Vis Sci. 1981;20:285–293. [PubMed] [Google Scholar]
- Eldred WD, Blute TA. Imaging of nitric oxide in the retina. Vision Res. 2005;45:3469–3486. doi: 10.1016/j.visres.2005.07.033. [DOI] [PMC free article] [PubMed] [Google Scholar]
- Famiglietti EV, Jr, Kolb H. Structural basis for ON-and OFF-center responses in retinal ganglion cells. Science. 1976;194:193–195. doi: 10.1126/science.959847. [DOI] [PubMed] [Google Scholar]
- Field GD, Rieke F. Mechanisms regulating variability of the single photon responses of mammalian rod photoreceptors. Neuron. 2002;35:733–747. doi: 10.1016/s0896-6273(02)00822-x. [DOI] [PubMed] [Google Scholar]
- Giove TJ, Deshpande MM, Eldred WD. Identification of alternate transcripts of neuronal nitric oxide synthase in the mouse retina. J Neurosci Res. 2009;87:3134–3142. doi: 10.1002/jnr.22133. [DOI] [PubMed] [Google Scholar]
- Goldstein IM, Ostwald P, Roth S. Nitric oxide: a review of its role in retinal function and disease. Vision Res. 1996;36:2979–2994. doi: 10.1016/0042-6989(96)00017-x. [DOI] [PubMed] [Google Scholar]
- Haverkamp S, Kolb H, Cuenca N. Morphological and neurochemical diversity of neuronal nitric oxide synthase-positive amacrine cells in the turtle retina. Cell Tissue Res. 2000;302:11–19. doi: 10.1007/s004410000267. [DOI] [PubMed] [Google Scholar]
- Haverkamp S, Wässle H. Immunocytochemical analysis of the mouse retina. J Comp Neurol. 2000 Aug 14;424(1):1–23. [PubMed] [Google Scholar]
- Hidaka S, Akahori Y, Kurosawa Y. Dendrodendritic electrical synapses between mammalian retinal ganglion cells. J Neurosci. 2004;24:10553–10567. doi: 10.1523/JNEUROSCI.3319-04.2004. [DOI] [PMC free article] [PubMed] [Google Scholar]
- Hoffpauir B, McMains E, Gleason E. Nitric oxide transiently converts synaptic inhibition to excitation in retinal amacrine cells. J Neurophysiol. 2006;95:2866–2877. doi: 10.1152/jn.01317.2005. [DOI] [PubMed] [Google Scholar]
- Hollmann M, Hartley M, Heinemann S. Ca2+ permeability of KA-AMPA--gated glutamate receptor channels depends on subunit composition. Science. 1991;252:851–853. doi: 10.1126/science.1709304. [DOI] [PubMed] [Google Scholar]
- Huang PL, Lo EH. Genetic analysis of NOS isoforms using nNOS and eNOS knockout animals. Prog Brain Res. 1998;118:13–25. doi: 10.1016/s0079-6123(08)63197-0. [DOI] [PubMed] [Google Scholar]
- Jeon CJ, Strettoi E, Masland RH. The major cell populations of the mouse retina. J Neurosci. 1998;18:8936–8946. doi: 10.1523/JNEUROSCI.18-21-08936.1998. [DOI] [PMC free article] [PubMed] [Google Scholar]
- Kim IB, Lee EJ, Kim KY, Ju WK, Oh SJ, Joo CK, Chun MH. Immunocytochemical localization of nitric oxide synthase in the mammalian retina. Neurosci Lett. 1999;267:193–196. doi: 10.1016/s0304-3940(99)00363-8. [DOI] [PubMed] [Google Scholar]
- Kim IB, Oh SJ, Chun MH. Neuronal nitric oxide synthase immunoreactive neurons in the mammalian retina. Microsc Res Tech. 2000;50:112–123. doi: 10.1002/1097-0029(20000715)50:2<112::AID-JEMT3>3.0.CO;2-S. [DOI] [PubMed] [Google Scholar]
- Kolb H. Amacrine cells of the mammalian retina: neurocircuitry and functional roles. Eye. 1997;11:904–923. doi: 10.1038/eye.1997.230. [DOI] [PubMed] [Google Scholar]
- Kolb H, Famiglietti EV. Rod and cone pathways in the inner plexiform layer of cat retina. Science. 1974;186:47–49. doi: 10.1126/science.186.4158.47. [DOI] [PubMed] [Google Scholar]
- Kolb H, Nelson R, Mariani A. Amacrine cells, bipolar cells and ganglion cells of the cat retina: a Golgi study. Vision Res. 1981;21:1081–1114. doi: 10.1016/0042-6989(81)90013-4. [DOI] [PubMed] [Google Scholar]
- Li W, Keung JW, Massey SC. Direct synaptic connections between rods and OFF cone bipolar cells in the rabbit retina. J Comp Neurol. 2004;474:1–12. doi: 10.1002/cne.20075. [DOI] [PubMed] [Google Scholar]
- Lyubarsky AL, Falsini B, Pennesi ME, Valentini P, Pugh EN., Jr UV- and midwave-sensitive cone-driven retinal responses of the mouse: a possible phenotype for coexpression of cone photopigments. J Neurosci. 1999;19:442–455. doi: 10.1523/JNEUROSCI.19-01-00442.1999. [DOI] [PMC free article] [PubMed] [Google Scholar]
- Maguire G. Spatial heterogeneity and function of voltage- and ligand-gated ion channels in retinal amacrine neurons. Proc Biol Sci. 1999;266:987–992. doi: 10.1098/rspb.1999.0734. [DOI] [PMC free article] [PubMed] [Google Scholar]
- Margulis A, Sitaramayya A. Rate of deactivation of nitric oxide-stimulated soluble guanylate cyclase: influence of nitric oxide scavengers and calcium. Biochemistry. 2000;39:1034–1039. doi: 10.1021/bi992040p. [DOI] [PubMed] [Google Scholar]
- Mills SL, Massey SC. Differential properties of two gap junctional pathways made by AII amacrine cells. Nature. 1995;377:734–737. doi: 10.1038/377734a0. [DOI] [PubMed] [Google Scholar]
- Morkve SH, Veruki ML, Hartveit E. Functional characteristics of non-NMDA-type ionotropic glutamate receptor channels in AII amacrine cells in rat retina. J Physiol. 2002;542:147–165. doi: 10.1113/jphysiol.2002.020305. [DOI] [PMC free article] [PubMed] [Google Scholar]
- Muller F, Wässle H, Voigt T. Pharmacological modulation of the rod pathway in the cat retina. J Neurophysiol. 1988;59:1657–1672. doi: 10.1152/jn.1988.59.6.1657. [DOI] [PubMed] [Google Scholar]
- Nawy S, Jahr CE. Suppression by glutamate of cGMP-activated conductance in retinal bipolar cells. Nature. 1990;346:269–271. doi: 10.1038/346269a0. [DOI] [PubMed] [Google Scholar]
- Nelson R, Famiglietti EV, Jr, Kolb H. Intracellular staining reveals different levels of stratification for on- and off-center ganglion cells in cat retina. J Neurophysiol. 1978;41:472–483. doi: 10.1152/jn.1978.41.2.472. [DOI] [PubMed] [Google Scholar]
- Oh SJ, Kim HI, Kim IB, Kim KY, Huh W, Chung JW, Chun MH. Morphology and synaptic connectivity of nitric oxide synthase-immunoreactive neurons in the guinea pig retina. Cell Tissue Res. 1999;297:397–408. doi: 10.1007/s004410051367. [DOI] [PubMed] [Google Scholar]
- Palmer RM, Ferrige AG, Moncada S. Nitric oxide release accounts for the biological activity of endothelium-derived relaxing factor. Nature. 1987;327:524–526. doi: 10.1038/327524a0. [DOI] [PubMed] [Google Scholar]
- Pang JJ, Gao F, Wu SM. Relative contributions of bipolar cell and amacrine cell inputs to light responses of ON, OFF and ON-OFF retinal ganglion cells. Vision Res. 2002a;42:19–27. doi: 10.1016/s0042-6989(01)00258-9. [DOI] [PubMed] [Google Scholar]
- Pang JJ, Gao F, Wu SM. Segregation and integration of visual channels: layer-by-layer computation of ON-OFF signals by amacrine cell dendrites. J Neurosci. 2002b;22:4693–4701. doi: 10.1523/JNEUROSCI.22-11-04693.2002. [DOI] [PMC free article] [PubMed] [Google Scholar]
- Pang JJ, Gao F, Wu SM. Light-evoked excitatory and inhibitory synaptic inputs to ON and OFF alpha ganglion cells in the mouse retina. J Neurosci. 2003;23:6063–6073. doi: 10.1523/JNEUROSCI.23-14-06063.2003. [DOI] [PMC free article] [PubMed] [Google Scholar]
- Porterfield DM, Laskin JD, Jung SK, Malchow RP, Billack B, Smith PJ, Heck DE. Proteins and lipids define the diffusional field of nitric oxide. Am J Physiol Lung Cell Mol Physiol. 2001;281:L904–L912. doi: 10.1152/ajplung.2001.281.4.L904. [DOI] [PubMed] [Google Scholar]
- Pottek M, Schultz K, Weiler R. Effects of nitric oxide on the horizontal cell network and dopamine release in the carp retina. Vision Res. 1997;37:1091–1102. doi: 10.1016/s0042-6989(96)00298-2. [DOI] [PubMed] [Google Scholar]
- Protti DA, Flores-Herr N, Li W, Massey SC, Wässle H. Light signaling in scotopic conditions in the rabbit, mouse and rat retina: a physiological and anatomical study. J Neurophysiol. 2005;93:3479–3488. doi: 10.1152/jn.00839.2004. [DOI] [PubMed] [Google Scholar]
- Provis JM. Development of the primate retinal vasculature. Prog Retin Eye Res. 2001;20:799–821. doi: 10.1016/s1350-9462(01)00012-x. [DOI] [PubMed] [Google Scholar]
- Savchenko A, Barnes S, Kramer RH. Cyclic-nucleotide-gated channels mediate synaptic feedback by nitric oxide. Nature. 1997;390:694–698. doi: 10.1038/37803. [DOI] [PMC free article] [PubMed] [Google Scholar]
- Schnitzer J. The development of astrocytes and blood vessels in the postnatal rabbit retina. J Neurocytol. 1988;17:433–49. doi: 10.1007/BF01189801. [DOI] [PubMed] [Google Scholar]
- Schmetterer L, Polak K. Role of nitric oxide in the control of ocular blood flow. Prog Retin Eye Res. 2001;20:823–847. doi: 10.1016/s1350-9462(01)00014-3. [DOI] [PubMed] [Google Scholar]
- Schmidt HH, Pollock JS, Nakane M, Forstermann U, Murad F. Ca2+/calmodulin-regulated nitric oxide synthases. Cell Calcium. 1992;13:427–434. doi: 10.1016/0143-4160(92)90055-w. [DOI] [PubMed] [Google Scholar]
- Schubert T, Degen J, Willecke K, Hormuzdi SG, Monyer H, Weiler R. Connexin36 mediates gap junctional coupling of alpha-ganglion cells in mouse retina. J Comp Neurol. 2005;485:191–201. doi: 10.1002/cne.20510. [DOI] [PubMed] [Google Scholar]
- Shiells RA, Falk G. Glutamate receptors of rod bipolar cells are linked to a cyclic GMP cascade via a G-protein. Proc Biol Sci. 1990;242:91–94. doi: 10.1098/rspb.1990.0109. [DOI] [PubMed] [Google Scholar]
- Silva AP, Malva JO, Ambrosio AF, Salgado AJ, Carvalho AP, Carvalho CM. Role of kainate receptor activation and desensitization on the [Ca(2+)](i) changes in cultured rat hippocampal neurons. J Neurosci Res. 2001;65:378–386. doi: 10.1002/jnr.1164. [DOI] [PubMed] [Google Scholar]
- Soucy E, Wang Y, Nirenberg S, Nathans J, Meister M. A novel signaling pathway from rod photoreceptors to ganglion cells in mammalian retina. Neuron. 1998;21:481–493. doi: 10.1016/s0896-6273(00)80560-7. [DOI] [PubMed] [Google Scholar]
- Thibos LN, Werblin FS. The response properties of the steady antagonistic surround in the mudpuppy retina. J Physiol. 1978;278:79–99. doi: 10.1113/jphysiol.1978.sp012294. [DOI] [PMC free article] [PubMed] [Google Scholar]
- Tsukamoto Y, Morigiwa K, Ueda M, Sterling P. Microcircuits for night vision in mouse retina. J Neurosci. 2001;21:8616–8623. doi: 10.1523/JNEUROSCI.21-21-08616.2001. [DOI] [PMC free article] [PubMed] [Google Scholar]
- Vandenberghe W, Robberecht W, Brorson JR. AMPA receptor calcium permeability, GluR2 expression, and selective motoneuron vulnerability. J Neurosci. 2000;20:123–132. doi: 10.1523/JNEUROSCI.20-01-00123.2000. [DOI] [PMC free article] [PubMed] [Google Scholar]
- Vaney DI. Many diverse types of retinal neurons show tracer coupling when injected with biocytin or Neurobiotin. Neurosci Lett. 1991;125:187–190. doi: 10.1016/0304-3940(91)90024-n. [DOI] [PubMed] [Google Scholar]
- Vigh J, Lasater EM. L-type calcium channels mediate transmitter release in isolated, wide-field retinal amacrine cells. Vis Neurosci. 2004;21:129–134. doi: 10.1017/s095252380404204x. [DOI] [PubMed] [Google Scholar]
- Volgyi B, Deans MR, Paul DL, Bloomfield SA. Convergence and segregation of the multiple rod pathways in mammalian retina. J Neurosci. 2004;24:11182–11192. doi: 10.1523/JNEUROSCI.3096-04.2004. [DOI] [PMC free article] [PubMed] [Google Scholar]
- Volgyi B, Chheda S, Bloomfield SA. Tracer coupling patterns of the ganglion cell subtypes in the mouse retina. J Comp Neurol. 2009;512:664–687. doi: 10.1002/cne.21912. [DOI] [PMC free article] [PubMed] [Google Scholar]
- Wässle H, Riemann HJ. The mosaic of nerve cells in the mammalian retina. Proc R Soc Lond B Biol Sci. 1978;200:441–461. doi: 10.1098/rspb.1978.0026. [DOI] [PubMed] [Google Scholar]
- Werblin FS. Transmission along and between rods in the tiger salamander retina. J Physiol. 1978;280:449–470. doi: 10.1113/jphysiol.1978.sp012394. [DOI] [PMC free article] [PubMed] [Google Scholar]
- Wood J, Garthwaite J. Models of the diffusional spread of nitric oxide: implications for neural nitric oxide signalling and its pharmacological properties. Neuropharmacology. 1994;33:1235–1244. doi: 10.1016/0028-3908(94)90022-1. [DOI] [PubMed] [Google Scholar]
- Wu SM, Gao F, Maple BR. Functional architecture of synapses in the inner retina: segregation of visual signals by stratification of bipolar cell axon terminals. J Neurosci. 2000;20:4462–70. doi: 10.1523/JNEUROSCI.20-12-04462.2000. [DOI] [PMC free article] [PubMed] [Google Scholar]
- Wu SM. Synaptic connections between neurons in living slices of the larval tiger salamander retina. J Neurosci Methods. 1987;20:139–149. doi: 10.1016/0165-0270(87)90046-x. [DOI] [PubMed] [Google Scholar]
- Xin D, Bloomfield SA. Effects of nitric oxide on horizontal cells in the rabbit retina. Vis Neurosci. 2000;17:799–811. doi: 10.1017/s0952523800175133. [DOI] [PubMed] [Google Scholar]
- Yu D, Eldred WD. Nitric oxide stimulates gamma-aminobutyric acid release and inhibits glycine release in retina. J Comp Neurol. 2005;483:278–291. doi: 10.1002/cne.20416. [DOI] [PMC free article] [PubMed] [Google Scholar]
- Zhang D, Sucher NJ, Lipton SA. Co-expression of AMPA/kainate receptor-operated channels with high and low Ca2+ permeability in single rat retinal ganglion cells. Neuroscience. 1995;67:177–188. doi: 10.1016/0306-4522(94)00627-h. [DOI] [PubMed] [Google Scholar]
- Zucker B, Luthi-Carter R, Kama JA, Dunah AW, Stern EA, Fox JH, Standaert DG, Young AB, Augood SJ. Transcriptional dysregulation in striatal projection- and interneurons in a mouse model of Huntington’s disease: neuronal selectivity and potential neuroprotective role of HAP1. Hum Mol Genet. 2005;14:179–89. doi: 10.1093/hmg/ddi014. [DOI] [PubMed] [Google Scholar]