

Abstract
Several Hsp90 (heat shock protein 90) inhibitors are currently under clinical evaluation as anticancer agents. However, the correlation between the duration and magnitude of Hsp90 inhibition and the downstream effects on client protein degradation and cancer cell growth inhibition has not been thoroughly investigated. To investigate the relationship between Hsp90 inhibition and cellular effects, we developed a method that measures drug occupancy on Hsp90 after treatment with the Hsp90 inhibitor IPI-504 in living cells and in tumor xenografts. In cells, we find the level of Hsp90 occupancy to be directly correlated with cell growth inhibition. At the molecular level, the relationship between Hsp90 occupancy and Hsp90 client protein degradation was examined for different client proteins. For sensitive Hsp90 clients (e.g. HER2 (human epidermal growth factor receptor 2), client protein levels directly mirror Hsp90 occupancy at all time points after IPI-504 administration. For insensitive client proteins, we find that protein abundance matches Hsp90 occupancy only after prolonged incubation with drug. Additionally, we investigate the correlation between plasma pharmacokinetics (PK), tumor PK, pharmacodynamics (PD) (client protein degradation), tumor growth inhibition, and Hsp90 occupancy in a xenograft model of human cancer. Our results indicate Hsp90 occupancy to be a better predictor of PD than either plasma PK or tumor PK. In the nonsmall cell lung cancer xenograft model studied, a linear correlation between Hsp90 occupancy and tumor growth inhibition was found. This novel binding assay was evaluated both in vitro and in vivo and could be used as a pharmacodynamic readout in the clinic.
Keywords: Chaperone Chaperonin, Drug Action, Heat Shock Protein, Protein Degradation, Quinones, 17-AAG, HER2, IPI-504, Client Proteins, Occupancy
Introduction
Hsp90 (heat shock protein 90) is a key component of a molecular chaperone complex that supports the conformational maturation and stabilization of many oncoproteins, including signaling kinases, transcription factors, and growth factor receptors (1–3). Hsp90 couples the binding and hydrolysis of ATP to the correct folding of client proteins (4, 5). The ansamycin class of inhibitors such as the natural product geldanamycin, its derivative 17-allyamino-geldanamycin (17-AAG)2 and IPI-504, the highly soluble hydroquinone salt of 17-AAG, competitively inhibit ATP binding and thereby the chaperoning activity of Hsp90 (4–7). IPI-504 binds Hsp90 with a 50-fold higher affinity than 17-AAG (8, 9), has antitumor activity in numerous animal tumor models (10–14), and has been evaluated in several clinical trials. Although these Hsp90 inhibitors reduce tumor size and delay or halt tumor progression in nonclinical models, the precise correlation between the degree of Hsp90 inhibition and the resulting cancer cell growth inhibition is yet to be determined.
A diversity of methods have been developed to measure Hsp90 activity and function in cultured cells and in patient samples (6). The biochemical assays commonly used to study Hsp90 co-chaperone complexes, or to discover new small molecule Hsp90 inhibitors, include ATPase activity assays for Hsp90 in yeast (15–17) or from reticulocyte lysates (18), fluorescence polarization assays monitoring the displacement of fluorescent ATP probes (19), and a Hsp90 dependent luciferase refolding assay after heat shock denaturation (20–22). In cultured cells, Hsp90 inhibition is assessed via the degradation of client proteins (e.g. cRaf (raf proto-oncogene serine/threonine protein kinase) or HER2 (6, 16)) or the induction of heat shock protein 70 (Hsp70) (6). The induction of Hsp70 in normal peripheral blood leukocytes is the typical measurement of pharmacological response to Hsp90 inhibition in patients treated with Hsp90 inhibitors. Although used routinely, there is no clear correlation between the extent of Hsp70 induction in normal cells and the pharmacological effect in tumor tissue (23–25). It has been hypothesized that the Hsp90 complex in cancer cells binds more tightly to Hsp90 inhibitors than the Hsp90 complex in normal cells (26). If correct, this would question the validity of measuring the induction of Hsp70 in normal cells (peripheral blood leukocytes) as a PD marker in the clinic.
Herein, we report the development of a method that quantitatively measures drug binding to Hsp90 in cancer cells. At 4 °C, a stable Hsp90·ansamycin complex is trapped due to the slow dissociation of bound 17-AAG or IPI-504 (half-life ∼ 24 h). Due to a large differential between the slow off-rate and relatively fast on-rate of IPI-504, Hsp90 occupancy can be determined by titrating unoccupied binding sites with radioactive ligand in combination with measuring amounts of total Hsp90 (Fig. 1). This occupancy assay was tested using purified Hsp90 and then applied to cancer cell lines and to a tumor xenograft.
FIGURE 1.

Schematic representation of the Hsp90 occupancy assay. A drug-treated cancer cell lysate (sample) was passed over a gel filtration spin column at 4 °C, and the sample was split into two aliquots. In one sample, total Hsp90 was determined by quantitative immunoblotting using separate antibodies to detect both Hsp90α and Hsp90β isoforms. In the second sample, open Hsp90 binding sites were titrated with [3H]17-AAG at 4 °C. Percent of Hsp90 occupancy was calculated from a ratio of Hsp90 open binding sites to total Hsp90.
EXPERIMENTAL PROCEDURES
Materials
HeLa-purified Hsp90 and recombinant human Hsp90α and Hsp90β were from Stressgen (Ann Arbor, MI). Anti-Hsp90α antibody (clone 68) was from BD Biosciences; anti-Hsp90β antibody (clone H-114) and anti-HER2 (C-18) from Santa Cruz Biotechnology; and anti-EGFR, Akt (protein kinase B), and cRaf antibodies were from Cell Signaling (Beverly, MA). HRP-linked secondary antibodies were purchased from GE Healthcare. Zeba desalting size exclusion spin columns and plates were obtained from Thermo Fisher Scientific (Rockford, IL). 17-AAG and IPI-504 were synthesized at Infinity Pharmaceuticals (7). [3H]17-AAG (25 Ci/mmol, ≥98% pure by HPLC) was custom synthesized by Ambios Labs (Newington, CT). [3H]17-AAG working stock was 444 μm with a specific activity of 2.2 Ci/mmol. Microscint 40 scintillation fluid from PerkinElmer Life Sciences. Cell lines NCI-H1650, NCI-H1975, SK-BR-3, SKOV-3, and RS4;11 (ATCC, Manassas, VA) were grown in RPMI 1640 medium supplemented with 10% fetal bovine serum, 1 μg/ml streptomycin, and 1 μg/ml penicillin. All cell lines were tested for mycoplasma and maintained at 37 °C in a 5% CO2 atmosphere.
Binding Kinetics for Purified Hsp90 and Hsp90 from Cancer Cell Lysates
For dissociation off-rate determinations, a [3H]17-AAG·Hsp90 complex was formed by incubating radiolabeled 17-AAG (200 nm) with purified Hsp90 (100 nm) or SK-BR-3 lysates (∼100 nm Hsp90 as determined by quantitative immunoblotting) at 4 °C overnight in Hsp90 binding buffer (20 mm Hepes, pH 7.3, 1 mm EDTA, 100 mm KCl, 5 mm MgCl, 0.01% (v/v) Nonidet P-40, and 1 mm Tris(2-carboxyethyl)phosphine hydrochloride (Thermo Fisher Scientific), 0.5 mg/ml bovine gamma globulin, and protease inhibitor mixture (Roche Diagnostics GmbH). 1 mm Tris(2-carboxyethyl)phosphine Hydrochloride is added to Hsp90 binding buffer to maintain 17-AAG in its hydroquinone form. Unbound drug was removed by passing a 110-μl sample volume over two Hsp90 buffer-equilibrated Zeba size exclusion columns (bed volume, 500 μl) and spinning for 1 min at 1500 × g. Addition of 10 μm unlabeled 17-AAG to the pooled exclusion volume, either at 4 or 37 °C initiated the dissociation time course. Aliquots (110 μl) were removed at different time points and subsequently passed over a new set of spin columns to remove dissociated [3H]17-AAG. The column exclusion volume (80 μl) was mixed with 800 μl of scintillation fluid and measured on a Microbeta Plus liquid scintillation counter (PerkinElmer Life Sciences). The time-dependent loss of radioactive counts were fit to a monoexponential decay function yielding the dissociation rate of 17-AAG measured at both 4 and 37 °C. The net association rate of 10 μm 17-AAG at 4 °C was determined by incubating [3H]17-AAG with 100 nm purified Hsp90 protein or cancer cell lysate with an equivalent amount of Hsp90. Aliquots (110 μl) were removed over time, and the extent of [3H]17-AAG binding was measured by a time-dependent increase of radioactive counts (cpm) in an 80-μl size exclusion column flow-through. The specific binding data were fit to a single exponential equation: Y = Ymax (1 − e−kob·t), with t½ calculated by t½ = 0.693/kobs.
Titration of Unoccupied Hsp90 Sites with [3H]17-AAG with Purified Hsp90
Samples with various levels of Hsp90 occupancy were generated by incubating 100 nm Hsp90β with increasing concentrations of cold 17-AAG (0.4–400 nm) in Hsp90 binding buffer overnight at 4 °C. Binding reactions (110 μl) were passed over prechilled size exclusion columns to remove unbound 17-AAG followed by addition of 2.5 μl [3H]17-AAG (10 μm final) to the eluate. Samples were incubated for 2 h on ice. The samples again were passed over size exclusion columns and flow-through radioactive counts in 80 μl converted to mol of [3H]17-AAG and plotted against added unlabeled 17-AAG. Zeba column flow-through background counts from 10 μm [3H]17-AAG mixed with Hsp90 binding buffer were subtracted from Hsp90 bound counts.
Titration of Unoccupied Hsp90 Sites with [3H]17-AAG in Cell and Tumor Lysate
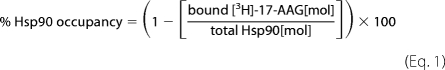
H1650, H1975, SKOV-3, and RS4;11 cells were seeded (1 × 10⁵ − 5 × 10⁵ cells per well) and grown to 95% confluency in six-well plates (Costar). Cells were incubated with increasing concentrations of IPI-504 (0.01–10 μm) for 6 or 24 h at 37 °C, washed twice with cold PBS, and lysed in 250 μl Hsp90 binding buffer by three repetitions of freeze/thaw. Whole snap frozen tumors from IPI-504 dosed mice were pulverized to powder with 200 strokes/min for 2 min in a Geno/grinder 2000. Approximately 10 mg of powder were homogenized on ice for 1–2 min with 300 μl of chilled Hsp90 binding buffer and clarified by centrifugation (14,000 × g for 10 min at 4 °C). Supernatants (110 μl) obtained from cell lysates or tumor homogenates were quickly passed over prechilled size exclusion columns to remove any unbound cold 17-AAG/IPI-504. [3H]17-AAG working stock in 1 mm Tris(2-carboxyethyl)phosphine hydrochloride was added to the eluant (2.5 μl; final concentration, 10 μm) and incubated for 2 h at 4 °C to ensure complete binding to unoccupied Hsp90 sites, and the resulting mixture was subsequently passed over size exclusion columns to remove unbound radiolabeled 17-AAG. Flow-through counts (80 μl) were measured on a Microbeta Plus liquid scintillation counter. Radioactive counts were converted to mol of bound [3H]17-AAG. Total Hsp90 protein in each sample was determined by quantitative immunoblotting using human recombinant Hsp90α and Hsp90β as standards and validated by stoichiometric titration with [3H]17-AAG. Hsp90 (occupancy) was calculated using the following equation.
 |
Cell Growth Inhibition
Cells were seeded at 10,000 cells/well in 96-well plates incubated for 24 h and subsequently incubated with increasing concentrations of IPI-504 for 72 h. Viability studies were performed using Cell Titer Glow (Promega, Madison, WI). The data were normalized with respect to dimethyl sulfoxide vehicle control to generate growth inhibition GI50 values.
Immunoblot Analyses
For Hsp90 client protein quantitation, cells were treated for 6 or 24 h with IPI-504 and lysed in radioimmune precipitation assay buffer containing protease inhibitors. Total protein was determined by BCA method (Pierce) and resolved by SDS-PAGE (4–12% Bis-Tris). Immunodetection of proteins transferred to PDVF membranes was performed with enhanced chemiluminescent Western blot reagents (Thermo Fisher Scientific). Blots were probed with antibodies to detect the protein of interest. Image analysis and band quantitation normalized to actin loading control were performed with the Bio-Rad Versa Doc system.
H1650 Xenograft Studies
6-to-8-week-old male homozygous athymic nude (nu−/nu−) mice (Taconic Farms, Hudson, NY) were maintained in accordance with the Institutional Animal Care and Use Committee guidelines. Xenografts were generated by injecting 1 × 10⁷ H1650 cells into the right flank of 40 mice. Varying doses of IPI-504 or vehicle were administered by intraperitoneal injection twice per week (n = 10 per arm), and tumor xenograft size was measured twice weekly with calipers. Results are presented as means and S.E. For PD studies, two separate groups of animals were treated with IPI-504. One group of mice (n = 2) were treated i.p. with vehicle, 25, 50, or 100 mg/kg IPI-504 and sacrificed 2 h post dose. The other group (n = 3) was treated with a single i.v. dose of IPI-504 (100 mg/kg) and sacrificed at various time points post dose, blood plasma was collected, and tumors were removed and snap frozen in liquid nitrogen and stored at −80 °C.
Bioanalytical Methods
Concentrations of IPI-504, 17-AAG, and its metabolite 17-(amino)-17-demethoxygeldanamycin (17-AG) were determined by LC-MS/MS analysis that was developed and validated (27) with minor modifications. Tumor samples were homogenized in ice-cold nitrogen sparged 1:1 solution of acetonitrile: 150 mm citrate, 0.2% (w/v) EDTA, 0.2% (w/v) ascorbate, pH 3, filtered using a 0.45-μm low binding hydrophilic solvinert plate and diluted 1:1 with ice-cold nitrogen sparged 75 mm citrate, 0.1% (w/v) EDTA, 0.1% (w/v) ascorbate, pH 3, containing 25 ng/ml deuterated 17-AAG as internal standard.
RESULTS
Dissociation of 17-AAG from Hsp90 Is Highly Temperature-dependent
17-AAG has been shown to rapidly dissociate from Hsp90 at 37 °C (7, 28). Here, we compare the off-rate of 17-AAG from Hsp90 at 4 and 37 °C. 17-AAG dissociates quickly from purified Hsp90 at 37 °C with a koff = 0.087 min−1, corresponding to a half-life of 8 min (Fig. 2A), consistent with values reported by Ge et al. (7) and Carreras et al. (28). Importantly, at 4 °C the dissociation time was considerably longer with a koff = 0.024 h−1, corresponding to a t½ of 28 h (Fig. 2A). Similarly, the dissociation rate of 17-AAG from Hsp90 in SK-BR-3 lysates at 4 °C was slow, with a half-life of 36 h (Fig. 2B). Interestingly, Gooljarsingh et al. (29) reported a t½ dissociation rate of 4.5 h for geldanamycin at ambient temperature. Taken together, these results indicate that the rate of 17-AAG-Hsp90 dissociation is highly dependent on temperature and follows an Arrhenius type behavior.
FIGURE 2.

Dissociation of [3H]17-AAG from purified Hsp90 and SK-BR-3 lysates is highly temperature-dependent. Purified Hela Hsp90 (100 nm) or lysate Hsp90·[3H]17-AAG complexes were formed as described under “Experimental Procedures” and passed over size exclusion spin columns. Column eluates were incubated with 10 μm cold 17-AAG, and samples were removed at different time points. A loss of bound radioactive 17-AAG counts from Hsp90 was measured at both 4 and 37 °C (A) and Hsp90 in SK-BR-3 cancer cell lysate at 4 °C (B). The data were fit to a monoexponential decay equation.
Association of 17-AAG to Hsp90 Is Relatively Fast at 4 °C under Saturating Conditions
The association of 17-AAG is a second order process with the net rate dependent on 17-AAG concentration. The mechanism of binding to Hsp90 has been studied in some detail showing 17-AAG binds to Hsp90 via a two-step binding model with initial binding followed by a time-dependent conformational change in the protein that results in a tighter Hsp90·17-AAG complex (29). For our purposes, we determined the net rate of association of 10 μm 17-AAG utilizing Hsp90 from different sources. Association rates were determined for Hsp90 purified from Hela cells and Hsp90 in an extract from SK-BR-3 cells. Protein (100 nm Hsp90) or lysate (∼100 nm Hsp90) was incubated with a fixed concentration of [3H]17-AAG (10 μm) and binding measured by the time-dependent increase in protein bound [3H]17-AAG found in the column flow-through. A 100-fold excess of [3H]17-AAG was used to maximize the rate of association relative to the rate of dissociation. At 10 μm 17-AAG, association to Hsp90 followed a single exponential phase from which a kobs was calculated with a corresponding t½. At 4 °C, 17-AAG bound to purified Hsp90 with an association t½ of 6 min (Fig. 3A) and to SK-BR-3 lysate with an association t½ of 19 min (Fig. 3B). Drug binding to purified Hsp90 or to Hsp90 in cell lysates reached equilibrium by 40 and 130 min at 4 °C, respectively (Fig. 3). Because the rate of dissociation is ∼100-fold slower than the rate of association of 10 μm 17-AAG at 4 °C, the drug bound state of Hsp90 pretreated with 17-AAG can be trapped for an extended period of time. Therefore, it should be possible to use titration with radiolabeled 17-AAG to determine the number of unoccupied binding sites on Hsp90 and, in combination with quantitative immunoblotting to measure total Hsp90, derive a fractional drug occupancy for Hsp90.
FIGURE 3.

Binding of [3H]17-AAG to purified Hela Hsp90 and SK-BR-3 lysates at 4 °C. The binding reaction was initiated by adding 10 μm [3H]17-AAG to 100 nm purified Hsp90 or to SK-BR-3 lysate containing ∼100 nm Hsp90. Drug association was measured at 4 °C by a time-dependent increase in protein bound counts for purified Hsp90 (A) or Hsp90 in SK-BR-3 cell lysate (B). Data were fitted by nonlinear regression to a single exponential equation to obtain a (kobs) value. Half-life was calculated using the equation t½ = 0.693/kobs.
Unoccupied Binding Sites on Hsp90 Can Be Titrated with [3H]17-AAG
To obtain proof of principle that unoccupied binding sites on Hsp90 can be titrated using radioactively labeled 17-AAG, various levels of occupancy were created by preincubating purified Hsp90 with increasing concentrations of unlabeled 17-AAG to equilibrium. After unbound 17-AAG was removed, free Hsp90 sites were titrated with radiolabeled 17-AAG at 4 °C under reducing conditions to maintain 17-AAG in its tight binding dihydroquinone form (8, 30). Preincubation with an excess of unlabeled 17-AAG resulted in an absence of labeled 17-AAG binding, whereas preincubation with little or no 17-AAG allowed virtually all of the Hsp90 present to be titrated with labeled 17-AAG (Fig. 4). 17-AAG titration curves were similar for both Hsp90 isoforms (α and β data not shown), yielding ∼50% Hsp90 occupancy with 42 nm 17-AAG when 100 nm Hsp90 protein was used as the input (Fig. 4). When assaying drug-free Hsp90, it is possible to titrate ∼80% of the total Hsp90 used in the experiment. This is presumably due to a loss of ∼20% Hsp90 after two passes through the size exclusion spin columns used to separate bound from free drug in the experiment. These results imply that a percent occupancy value for Hsp90 can be experimentally determined using open binding site titration at 4 °C combined with quantitative measurement of total Hsp90 protein.
FIGURE 4.

Hsp90 open binding sites can be titrated with [3H]17-AAG. Recombinant human Hsp90β protein (100 nm) was incubated with increasing concentrations of unlabeled 17-AAG overnight at 4 °C followed by removal of unbound 17-AAG with prechilled size exclusion columns. Free Hsp90 sites were titrated with [3H]17-AAG at 4 °C as described under “Experimental Procedures.” The data from triplicate binding experiments were fit to a four parameter logistic equation.
Determining Hsp90 Occupancy in Cells Treated with IPI-504
To determine whether Hsp90 occupancy can be measured in cancer cells lines, an increasing concentration of IPI-504 was added to the nonsmall cell lung cancer cell line (NSCLC) H1650 for 6 h in vitro. Titration of the unoccupied Hsp90 binding sites in lysates was done as described above, and total Hsp90 was determined by quantitative immunoblotting (Fig. 5A). As a single antibody that could reliably quantify both Hsp90 isoforms (α and β) could not be found, the levels of Hsp90α and β protein were measured separately and summed (Fig. 5B). A value for percent occupancy was derived by dividing the number of open binding sites by the number of Hsp90 molecules present. Occupancy values were produced for a range of concentrations of IPI-504 used to preincubate the cells (Fig. 5B). An occupancy curve was generated, yielding an EC50 of 30 nm (Fig. 5C).
FIGURE 5.

Determination of Hsp90 occupancy in living cells. H1650 cells were incubated with increasing concentrations of IPI-504 for 6 h at 37 °C. Total Hsp90 protein levels were determined by quantitative immunoblotting using separate anti Hsp90α and Hsp90β antibodies and recombinant proteins as internal standards (A). Percent Hsp90 occupancy was determined by titration of open binding sites at 4 °C and total Hsp90 (B and C). Data are from a representative experiment with n = 2.
In the experimental setup, free 17-AAG was separated from bound using size exclusion spin columns, and tightly bound 17-AAG to protein was equated to 17-AAG bound to Hsp90. To confirm this assumption, cells were incubated with a large excess of radiolabeled 17-AAG, and protein bound counts were plotted versus concentration. A saturable binding curve was obtained with the maximum binding level approaching the total amount of Hsp90 present as measured by quantitative immunoblotting (supplemental Fig. S1). This indicates that the majority of protein bound by 17-AAG is indeed Hsp90. This is in agreement with our observation that other cellular proteins reported to bind to 17-AAG either display a lower affinity for the drug and/or are expressed at levels at least 10x lower than Hsp90α/β and thus do not significantly contribute to drug binding in our experiments.
Hsp90 occupancy in cancer cell lines correlates with the growth inhibitory effects of IPI-504
We next applied this method to compare compound occupancy on Hsp90 with the cytotoxic effects of IPI-504 in living cancer cells. H1650, H1975, SKOV-3, and RS4;11 cancer cell lines were incubated with increasing concentrations of IPI-504 for 6 h, and drug occupancy was determined. After 72 h, cell growth inhibition was measured at these concentrations. Drug occupancy (EC50 = 30, 44, 74, and 644 nm for H1650, SKOV-3, H1975, and RS4;11, respectively) correlated well with the cell growth inhibitory activity of IPI-504 (GI50 = 37, 52, 51, and 2000 nm, respectively (Table 1)), indicating that the sensitivity of cells to IPI-504 is linked to the ability of IPI-504 to occupy Hsp90 within cells. These results also indicate that the relative resistance of RS4;11 cells to IPI-504 is not due to an insensitivity of this cell line to Hsp90 inhibition, but rather, a higher drug concentration is required to fully occupy and thereby inhibit Hsp90.
TABLE 1.
Hsp90 occupancy correlates with IPI-504 cell growth inhibition among four cancer cell lines
Cell lines H1650, SKOV-3, H1975, and RS4;11 were treated with increasing concentrations of IPI-504 and cell growth inhibition (GI50) measured after 72 h. Hsp90 occupancy (EC50) was measured after 6 h of incubation with increasing concentrations of IPI-504 as described under “Experimental Procedures.” The values obtained are an average of two experiments.
| Cell line | Hsp90 occupancy (EC50) | Cell growth inhibition (GI50) |
|---|---|---|
| nm | nm | |
| H1650 | 30 | 37 |
| SKOV-3 | 44 | 52 |
| H1975 | 74 | 51 |
| RS4;11 | 644 | 2000 |
Hsp90 Occupancy and Effect on Client Protein Degradation
Because the initial downstream effect of Hsp90 inhibition is the degradation of client proteins, the correlation between Hsp90 occupancy and client protein degradation was studied. The NSCLC cell line H1650 expresses several well known Hsp90 client proteins. Some of them, like HER2 and mutant epidermal growth factor receptor (mEGFR), have been reported to be very sensitive to Hsp90 inhibition, whereas others like cRaf and Akt are reported to be less sensitive (31–34). H1650 cells were incubated for 6 h with increasing concentrations of IPI-504, and HER2, mEGFR, Akt, and cRaf protein levels were assessed by immunoblotting. HER2, the most sensitive client described to date, was >90% degraded after incubation with 30 nm IPI-504 and yielded a degradation EC50 of 11 nm, whereas mEGFR exhibited an intermediate sensitivity with a degradation EC50 of 213 nm at this early time point (Fig. 6, A and B). As expected, cRaf and Akt were less sensitive with maximal degradation not higher than 42 and 54% respectively at 10 μm, the highest concentration tested (Fig. 6, A and B). At 6 h, the degradation curve for HER2 essentially overlays the Hsp90 occupancy curve, but this was not seen with the three other clients (Fig. 6B). However, when H1650 cells were incubated with IPI-504 for 24 h, the abundance of all four client proteins now corresponds to the occupancy of Hsp90 (Fig. 6, C and D), with EC50 values ranging between 10 and 46 nm.
FIGURE 6.

Effect of Hsp90 occupancy on client protein abundance. H1650 cells were incubated for 6 or 24 h with increasing concentrations of IPI-504. HER2, mEGFR, Akt, and cRaf protein levels were assessed by immunoblotting (A and C). The fraction of degraded proteins was assessed by densitometry compared with untreated samples and plotted together with the occupancy curves (B and D).
Hsp90 Occupancy in H1650 Tumor Xenografts
With a working occupancy method in hand, we explored the relationship between PK, PD (client protein degradation), Hsp90 occupancy, and tumor growth inhibition after IPI-504 administration in a mouse xenograft model of human lung cancer. Nude mice bearing xenografts of the human NSCLC cell line H1650 were dosed with IPI-504 at 100 mg/kg, and the plasma concentration of IPI-504 and its active metabolites (17-AAG and 17-AG) were determined at different times after drug administration (Fig. 7A). Similarly, the concentrations of the active IPI-504 species were determined in tumor tissue (Fig. 7A). Part of the tumor tissue was also used to determine Hsp90 occupancy (as described under “Experimental Procedures”), and aliquots of tumor tissue lysate were immunoblotted to measure the degradation of the Hsp90 client protein mEGFR as a PD readout (Fig. 7, B and C). Drug plasma concentration was maximal between 1 and 2 h and declined after 4 h, whereas high concentrations of IPI-504 and its metabolites were still present in tumors 36 h post dose (Fig. 7A). Significant Hsp90 occupancy was observed up to 12 h and slowly declined to background levels by 48 h. Correspondingly, mEGFR protein degradation was observed after 2 h with re-emergence of protein expression at 24 h. After an initial lag, degradation of mEGFR protein in vivo correlates well with drug occupancy of Hsp90 in the tumor (Fig. 7C). To determine what correlation exists between Hsp90 occupancy and tumor growth inhibition, we set up parallel experiments in mice bearing xenografts of the NSCLC cell line H1650. In one arm, animals were treated with different doses of IPI-504 (25, 50, and 100 mg/kg) twice weekly for 4 weeks, and the tumor volumes were determined (Fig. 8A). In the other arm, animals were treated with a single dose (100 mg/kg), and tumors were removed at the peak of IPI-504 tumor concentration (2 h post dose, see Fig. 7A), and drug occupancy on Hsp90 at 4 °C was determined. By plotting the mean tumor volume (mm3) measured on day 50 against % Hsp90 target occupancy (Fig. 8B), a direct correlation between tumor growth inhibition in animals and target occupancy by IPI-504 was obtained. This suggests that tumor growth inhibition in animals is a direct consequence of Hsp90 inhibition by IPI-504 and that such measurements could potentially be used during dose escalation in the clinic to full target inhibition rather than maximum tolerated dose.
FIGURE 7.

Hsp90 occupancy is a better predictor of in vivo pharmacodynamic effects by IPI-504 than tumor or plasma PK. H1650 tumor-bearing mice were treated with a single dose of 100 mg/kg intravenous IPI-504. Tumors and blood plasma were harvested at designated time points post dose. Drug levels of Hsp90 active species (IPI-504, 17-AAG, and 17-AG) were quantified by LC-MS/MS in plasma and in tumor (A). EGFR protein levels (B) and Hsp90 occupancy (C) were measured in tumor tissue. Data are expressed as averages ± S.D. (vehicle (veh), n = 2; and 1–48 h, n = 3).
FIGURE 8.

Hsp90 occupancy correlates with antitumor activity of IPI-504 in a xenograft model of NSCLC. H1650 tumor bearing mice were treated with vehicle (●), 25 mg/kg (□), 50 mg/kg (▾), or 100 mg/kg (○) of IPI-504 (IP, twice weekly) and tumor growth was assessed by caliper measurement (A). Data are expressed as means and standard error (n = 10 per arm). A separate group of H1650 tumor bearing mice was treated with a single dose of 25, 50, or 100 mg/kg of IPI-504 and sacrificed 2 h post dose. Hsp90 occupancy was determined as described and plotted against tumor size (mm3) measured on day 50 of drug treatment (B). Data are expressed as averages with standard deviation (n = 2 (x-axis)) and as means with standard error (n = 10 (y-axis)). The points were fit to a linear least squares regression equation with a calculated R2 = 0.98.
DISCUSSION
As multiple Hsp90 inhibitors are being evaluated in patients, it becomes increasingly important to determine the extent and duration of target inhibition and its relationship to clinical activity. Here, we describe a method that directly measures the level of inhibitor occupancy on Hsp90 in biological samples. This assay allows a more direct characterization of inhibitor activity as compared with current methods, which rely on surrogate markers and downstream signaling events (35, 36). The principle of this method involves the titration of unoccupied Hsp90 binding sites with radiolabeled 17-AAG without the displacement of prebound IPI-504/17-AAG. This is enabled by a slow off-rate of prebound drug from Hsp90 at 4 °C and a relatively fast association of 10 μm radiolabeled probe used to detect open binding sites. In combination with quantitative immunoblotting to determine the total number of Hsp90 molecules in a given sample, we are able to calculate a value for percent occupancy of Hsp90. We demonstrate feasibility of the method with purified Hsp90 by adding IPI-504 to occupy various fractions of input Hsp90 followed by titration of the remaining empty sites with [3H]17-AAG. When applied to living cells, we are able to determine an occupancy value for varying concentrations of Hsp90 inhibitor added to cells. In four cancer cell lines studied, the EC50 value for Hsp90 occupancy correlates well with the growth inhibitory activity of IPI-504 in those cells.
Hsp90 inhibition impacts cellular protein homeostasis via different mechanisms (31). For example, Hsp90 inhibition can prevent the binding of the target client protein to Hsp90 (37, 38), arrest maturation of Hsp90-bound client proteins without disrupting the cochaperone complex (39, 40), or block the release of the refolded protein, leading to ubiquitin-dependent degradation (22). It has been previously shown that client proteins exhibit differential sensitivity to Hsp90 inhibition, with HER2 and mEGFR classified as sensitive and Akt and cRaf as insensitive clients based on the time course of protein disappearance as measured by Western analysis after Hsp90 inhibitor treatment (32, 34, 41). The mechanistic basis for variability of client protein sensitivity to Hsp90 is not clear. We therefore investigated the connection between Hsp90 occupancy and client protein degradation in a cell line (H1650) that contains both sensitive (HER2, mEGFR) and insensitive (cRaf, Akt) clients. After 6 h of incubation with IPI-504, we observe the expected differential depletion of client proteins by immunoblotting (Fig. 6A). Superimposing these results with Hsp90 occupancy at the same time points (Fig. 6B) demonstrates that the protein degradation curve for the most sensitive client protein (HER2) overlies the Hsp90 occupancy curve. In other words, when 50% of Hsp90 is occupied, ∼50% of cellular HER2 has been degraded. This is in stark contrast to the less sensitive clients (mEGFR, cRaf, and Akt) where drug concentrations that lead to 80% occupancy of Hsp90, had very little to no effect on client protein levels. One hypothesis to explain differential client protein sensitivity has been that some client proteins depend on Hsp90 chaperoning activity only for maturation, whereas others display a constant dependence on Hsp90 for stability even as a mature protein (41). Our results at 6 h are consistent with this hypothesis and would posit that for HER2, even its mature form is dependent on Hsp90 for its stability, whereas mEGFR, cRaf, and Akt are only dependent on Hsp90 during maturation. For those client proteins, inhibition of Hsp90 would be similar to inhibition of their synthesis, and the degradation time course after Hsp90 inhibition would correspond to protein half-life. If this explanation is correct, one would expect that for longer exposure to Hsp90 inhibition, all client protein degradation curves would now match the occupancy dose response. This is precisely what we observe after incubation with IPI-504 for 24 h (Fig. 6, C and D).
We also applied this method to an in vivo xenograft model to study the relationship between PK, PD, Hsp90 occupancy, and biological activity. As reported for other Hsp90 inhibitors, IPI-504 is rapidly cleared from the circulation and from normal tissue but accumulates in tumor tissue (42). At 24 h post dose, IPI-504 and its metabolites were barely detectable in plasma but still maintained at a concentration of ∼400 nm in the tumor at 48 h. Comparing the time course of plasma PK, tumor PK, PD (client protein degradation), and Hsp90 occupancy (Fig. 7), it is clear that Hsp90 occupancy correlates best with client protein degradation. The time course of Hsp90 occupancy matches the time course of EGFR protein degradation with client completely degraded when Hsp90 occupancy is maximal, and EGFR expression is restored when Hsp90 is no longer occupied with drug. In contrast, plasma PK underestimates and tumor PK overestimates the effect of IPI-504 on client proteins in vivo. At 24 to 48 h, tumor PK measurements show concentrations of IPI-504 of ∼1 μm, significantly more than the EC90 for mEGFR degradation for this cell line, yet mEGFR levels are restored by 24 to 36 h. Interestingly, the occupancy assay reveals that although drug is present in the bulk tumor, the drug is apparently not bound to Hsp90 at these time points.
We also measured the in vivo occupancy in tumors from animals administered different concentrations of IPI-504 and compared the occupancy values obtained 2 h after a single dose with anti-tumor activity observed after 4 weeks of dosing at that concentration. We observe a linear correlation between occupancy at a given dose and the effect that this dose level has on tumor growth inhibition after multiple doses. There is no detectable threshold effect, even a modest inhibition of Hsp90 led to a limited but statistically significant growth inhibition in vivo.
IPI-504 and other Hsp90 inhibitors have been reported to bind more potently to Hsp90 in cancer cells compared with normal cells.3 This makes the measurement of Hsp70 induction in peripheral blood leukocytes questionable as a PD readout in patients treated with Hsp90 inhibitors but also precludes the use of the occupancy assay in such surrogate cells. However, in hematological cancers where cancer cells are readily accessible, there might be an opportunity to use this assay to investigate the magnitude and duration of Hsp90 inhibition in patients. This method can also be applied to other nonansamycin Hsp90 inhibitors provided the off-rates at 4 °C are of long duration.
In conclusion, we report a novel method to assess the level of drug occupancy on Hsp90 after Hsp90 inhibitor treatment in vitro and in vivo. This method has the potential to be useful both for mechanistic studies as well as for the ongoing clinical development of Hsp90 inhibitors.
Supplementary Material
Acknowledgment
We thank Dr. Robert Copeland for discussions and helpful suggestions on the manuscript.
All authors are Infinity employees and stockholders.

The on-line version of this article (available at http://www.jbc.org) contains supplemental Fig. 1.
B. Tillotson, unpublished observations.
- 17-AAG
- 17-allylamino-17-demethoxygeldanamycin
- 17-AG
- 17-amino-17-demethoxygeldanamycin
- PK
- pharmacokinetic
- PD
- pharmacodynamic
- EGFR
- epidermal growth factor receptor 1
- NSCLC
- nonsmall cell lung cancer cell line
- mEGFR
- mutant epidermal growth factor receptor.
REFERENCES
- 1.Neckers L. (2007) J. Biosci. 32, 517–530 [DOI] [PubMed] [Google Scholar]
- 2.Workman P., Burrows F., Neckers L., Rosen N. (2007) Ann. N.Y. Acad. Sci. 1113, 202–216 [DOI] [PubMed] [Google Scholar]
- 3.Mahalingam D., Swords R., Carew J. S., Nawrocki S. T., Bhalla K., Giles F. J. (2009) Br. J. Cancer 100, 1523–1529 [DOI] [PMC free article] [PubMed] [Google Scholar]
- 4.Neckers L. (2003) Curr. Med. Chem. 10, 733–739 [DOI] [PubMed] [Google Scholar]
- 5.Pearl L. H., Prodromou C. (2006) Annu. Rev. Biochem. 75, 271–294 [DOI] [PubMed] [Google Scholar]
- 6.Aherne W., Maloney A., Prodromou C., Rowlands M. G., Hardcastle A., Boxall K., Clarke P., Walton M. I., Pearl L., Workman P. (2003) Methods Mol. Med. 85, 149–161 [DOI] [PubMed] [Google Scholar]
- 7.Ge J., Normant E., Porter J. R., Ali J. A., Dembski M. S., Gao Y., Georges A. T., Grenier L., Pak R. H., Patterson J., Sydor J. R., Tibbitts T. T., Tong J. K., Adams J., Palombella V. J. (2006) J. Med. Chem. 49, 4606–4615 [DOI] [PubMed] [Google Scholar]
- 8.Douglas M., Lim A. R., Porter J. R., West K., Pink M. M., Ge J., Wylie A. A., Tibbits T. T., Biggs K., Curtis M., Palombella V. J., Adams J., Fritz C. C., Normant E. (2009) Mol. Cancer Ther. 8, 3369–3378 [DOI] [PubMed] [Google Scholar]
- 9.Maroney A. C., Marugan J. J., Mezzasalma T. M., Barnakov A. N., Garrabrant T. A., Weaner L. E., Jones W. J., Barnakova L. A., Koblish H. K., Todd M. J., Masucci J. A., Deckman I. C., Galemmo R. A., Jr., Johnson D. L. (2006) Biochemistry 45, 5678–5685 [DOI] [PubMed] [Google Scholar]
- 10.Bauer S., Yu L. K., Demetri G. D., Fletcher J. A. (2006) Cancer Res. 66, 9153–9161 [DOI] [PubMed] [Google Scholar]
- 11.Dewaele B., Wasag B., Cools J., Sciot R., Prenen H., Vandenberghe P., Wozniak A., Schöffski P., Marynen P., Debiec-Rychter M. (2008) Clin. Cancer Res. 14, 5749–5758 [DOI] [PubMed] [Google Scholar]
- 12.Peng C., Brain J., Hu Y., Goodrich A., Kong L., Grayzel D., Pak R., Read M., Li S. (2007) Blood 110, 678–685 [DOI] [PMC free article] [PubMed] [Google Scholar]
- 13.Abramson J. S., Chen W., Juszczynski P., Takahashi H., Neuberg D., Kutok J. L., Takeyama K., Shipp M. A. (2009) Br. J. Haematol. 144, 358–366 [DOI] [PMC free article] [PubMed] [Google Scholar]
- 14.Song D., Chaerkady R., Tan A. C., García-García E., Nalli A., Suárez-Gauthier A., López-Ríos F., Zhang X. F., Solomon A., Tong J., Read M., Fritz C., Jimeno A., Pandey A., Hidalgo M. (2008) Mol. Cancer Ther. 7, 3275–3284 [DOI] [PubMed] [Google Scholar]
- 15.Avila C., Hadden M. K., Ma Z., Kornilayev B. A., Ye Q. Z., Blagg B. S. (2006) Bioorg. Med. Chem. Lett. 16, 3005–3008 [DOI] [PubMed] [Google Scholar]
- 16.Park H., Kim Y. J., Hahn J. S. (2007) Bioorg. Med. Chem. Lett. 17, 6345–6349 [DOI] [PubMed] [Google Scholar]
- 17.Rowlands M. G., Newbatt Y. M., Prodromou C., Pearl L. H., Workman P., Aherne W. (2004) Anal. Biochem. 327, 176–183 [DOI] [PubMed] [Google Scholar]
- 18.Schumacher R. J., Hurst R., Sullivan W. P., McMahon N. J., Toft D. O., Matts R. L. (1994) J. Biol. Chem. 269, 9493–9499 [PubMed] [Google Scholar]
- 19.Howes R., Barril X., Dymock B. W., Grant K., Northfield C. J., Robertson A. G., Surgenor A., Wayne J., Wright L., James K., Matthews T., Cheung K. M., McDonald E., Workman P., Drysdale M. J. (2006) Anal. Biochem. 350, 202–213 [DOI] [PubMed] [Google Scholar]
- 20.Chan C. T., Paulmurugan R., Gheysens O. S., Kim J., Chiosis G., Gambhir S. S. (2008) Cancer Res. 68, 216–226 [DOI] [PMC free article] [PubMed] [Google Scholar]
- 21.Galam L., Hadden M. K., Ma Z., Ye Q. Z., Yun B. G., Blagg B. S., Matts R. L. (2007) Bioorg. Med. Chem. 15, 1939–1946 [DOI] [PMC free article] [PubMed] [Google Scholar]
- 22.Schneider C., Sepp-Lorenzino L., Nimmesgern E., Ouerfelli O., Danishefsky S., Rosen N., Hartl F. U. (1996) Proc. Natl. Acad. Sci. U.S.A. 93, 14536–14541 [DOI] [PMC free article] [PubMed] [Google Scholar]
- 23.Goetz M. P., Toft D., Reid J., Ames M., Stensgard B., Safgren S., Adjei A. A., Sloan J., Atherton P., Vasile V., Salazaar S., Adjei A., Croghan G., Erlichman C. (2005) J. Clin. Oncol. 23, 1078–1087 [DOI] [PubMed] [Google Scholar]
- 24.Grem J. L., Morrison G., Guo X. D., Agnew E., Takimoto C. H., Thomas R., Szabo E., Grochow L., Grollman F., Hamilton J. M., Neckers L., Wilson R. H. (2005) J. Clin. Oncol. 23, 1885–1893 [DOI] [PubMed] [Google Scholar]
- 25.Ramanathan R. K., Trump D. L., Eiseman J. L., Belani C. P., Agarwala S. S., Zuhowski E. G., Lan J., Potter D. M., Ivy S. P., Ramalingam S., Brufsky A. M., Wong M. K., Tutchko S., Egorin M. J. (2005) Clin. Cancer Res. 11, 3385–3391 [DOI] [PubMed] [Google Scholar]
- 26.Kamal A., Thao L., Sensintaffar J., Zhang L., Boehm M. F., Fritz L. C., Burrows F. J. (2003) Nature 425, 407–410 [DOI] [PubMed] [Google Scholar]
- 27.Sydor J. R., Normant E., Pien C. S., Porter J. R., Ge J., Grenier L., Pak R. H., Ali J. A., Dembski M. S., Hudak J., Patterson J., Penders C., Pink M., Read M. A., Sang J., Woodward C., Zhang Y., Grayzel D. S., Wright J., Barrett J. A., Palombella V. J., Adams J., Tong J. K. (2006) Proc. Natl. Acad. Sci. U.S.A. 103, 17408–17413 [DOI] [PMC free article] [PubMed] [Google Scholar]
- 28.Carreras C. W., Schirmer A., Zhong Z., Santi D. V. (2003) Anal. Biochem. 317, 40–46 [DOI] [PubMed] [Google Scholar]
- 29.Gooljarsingh L. T., Fernandes C., Yan K., Zhang H., Grooms M., Johanson K., Sinnamon R. H., Kirkpatrick R. B., Kerrigan J., Lewis T., Arnone M., King A. J., Lai Z., Copeland R. A., Tummino P. J. (2006) Proc. Natl. Acad. Sci. U.S.A. 103, 7625–7630 [DOI] [PMC free article] [PubMed] [Google Scholar]
- 30.Guo W., Reigan P., Siegel D., Zirrolli J., Gustafson D., Ross D. (2005) Cancer Res. 65, 10006–10015 [DOI] [PubMed] [Google Scholar]
- 31.Basso A. D., Solit D. B., Chiosis G., Giri B., Tsichlis P., Rosen N. (2002) J. Biol. Chem. 277, 39858–39866 [DOI] [PubMed] [Google Scholar]
- 32.Citri A., Harari D., Shohat G., Ramakrishnan P., Gan J., Lavi S., Eisenstein M., Kimchi A., Wallach D., Pietrokovski S., Yarden Y. (2006) J. Biol. Chem. 281, 14361–14369 [DOI] [PubMed] [Google Scholar]
- 33.Guo A., Villén J., Kornhauser J., Lee K. A., Stokes M. P., Rikova K., Possemato A., Nardone J., Innocenti G., Wetzel R., Wang Y., MacNeill J., Mitchell J., Gygi S. P., Rush J., Polakiewicz R. D., Comb M. J. (2008) Proc. Natl. Acad. Sci. U.S.A. 105, 692–697 [DOI] [PMC free article] [PubMed] [Google Scholar]
- 34.Sawai A., Chandarlapaty S., Greulich H., Gonen M., Ye Q., Arteaga C. L., Sellers W., Rosen N., Solit D. B. (2008) Cancer Res. 68, 589–596 [DOI] [PMC free article] [PubMed] [Google Scholar]
- 35.Banerji U., O'Donnell A., Scurr M., Pacey S., Stapleton S., Asad Y., Simmons L., Maloney A., Raynaud F., Campbell M., Walton M., Lakhani S., Kaye S., Workman P., Judson I. (2005) J. Clin. Oncol. 23, 4152–4161 [DOI] [PubMed] [Google Scholar]
- 36.Smith-Jones P. M., Solit D. B., Akhurst T., Afroze F., Rosen N., Larson S. M. (2004) Nat. Biotechnol. 22, 701–706 [DOI] [PubMed] [Google Scholar]
- 37.Grammatikakis N., Lin J. H., Grammatikakis A., Tsichlis P. N., Cochran B. H. (1999) Mol. Cell. Biol. 19, 1661–1672 [DOI] [PMC free article] [PubMed] [Google Scholar]
- 38.Whitesell L., Mimnaugh E. G., De Costa B., Myers C. E., Neckers L. M. (1994) Proc. Natl. Acad. Sci. U.S.A. 91, 8324–8328 [DOI] [PMC free article] [PubMed] [Google Scholar]
- 39.Dittmar K. D., Demady D. R., Stancato L. F., Krishna P., Pratt W. B. (1997) J. Biol. Chem. 272, 21213–21220 [DOI] [PubMed] [Google Scholar]
- 40.Stancato L. F., Silverstein A. M., Owens-Grillo J. K., Chow Y. H., Jove R., Pratt W. B. (1997) J. Biol. Chem. 272, 4013–4020 [DOI] [PubMed] [Google Scholar]
- 41.Xu W., Mimnaugh E., Rosser M. F., Nicchitta C., Marcu M., Yarden Y., Neckers L. (2001) J. Biol. Chem. 276, 3702–3708 [DOI] [PubMed] [Google Scholar]
- 42.Xu L., Eiseman J. L., Egorin M. J., D'Argenio D. Z. (2003) J Pharmacokinet Pharmacodyn. 30, 185–219 [DOI] [PubMed] [Google Scholar]
Associated Data
This section collects any data citations, data availability statements, or supplementary materials included in this article.