


Abstract
In this study the femtosecond near-IR and nanosecond green lasers are used to induce alterations in mitotic chromosomes. The subsequent double-strand break responses are studied. We show that both lasers are capable of creating comparable chromosomal alterations and that a phase paling observed within 1–2 s of laser exposure is associated with an alteration of chromatin as confirmed by serial section electron microscopy, DAPI, γH2AX and phospho-H3 staining. Additionally, the accumulation of dark material observed using phase contrast light microscopy (indicative of a change in refractive index of the chromatin) ∼34 s post-laser exposure corresponds spatially to the accumulation of Nbs1, Ku and ubiquitin. This study demonstrates that chromosomes selectively altered in mitosis initiate the DNA damage response within 30 s and that the accumulation of proteins are visually represented by phase-dark material at the irradiation site, allowing us to determine the fate of the damage as cells enter G1. These results occur with two widely different laser systems, making this approach to study DNA damage responses in the mitotic phase generally available to many different labs. Additionally, we present a summary of most of the published laser studies on chromosomes in order to provide a general guide of the lasers and operating parameters used by other laboratories.
INTRODUCTION
DNA damage can occur naturally through endogenous metabolic by-products, DNA replication errors and exogenous exposure to the suns’ UV rays. As a result, organisms have evolved several DNA repair mechanisms in order to afford protection from ensuing mutations that can lead to diseases such as cancer. Many details concerning DNA repair mechanisms have not been elucidated. Therefore, a variety of approaches to induce DNA damage and study the subsequent response have been employed. One of the more recent and growing approaches to study DNA repair factor recruitment uses lasers to produce spatially defined DNA damage in interphase nuclei (1–20). These studies have used a wide variety of laser systems and dosimetry, often making it difficult to compare and interpret results (19).
Notwithstanding these difficulties with the large number of published studies on interphase cells, even less is known about the double-strand break (DSB) response during mitosis. Lasers have been used to selectively damage mitotic chromosomes directly without having to expose the entire cell to a carcinogenic drug or to a large amount of ionizing radiation (21–23). In addition to demonstrating diffraction-limited focal point-specific damage, a known genetic sequence such as the nucleolar organizing region (rDNA) was ‘knocked out’ by laser microirradiation of the chromosome region associated with the nucleolus in late prophase (24–26). The fact that some of the irradiated cells were able to continue through mitosis and proliferate into viable clonal populations suggested that DNA damage signaling and repair very likely occurred at some point after irradiation. However, those early studies were done with long-pulse microsecond to millisecond green (488, 514 nm) argon ion lasers that are no longer available. In addition, the dosimetry used in those studies was subjective, at best, and did not include careful measurement of the actual energy in the focused spot, or accurate measurement of the transmission through the microscope objective using the currently accepted dual-objective method (27,28).
Considering that the vast majority of DNA damage studies have been conducted on interphase cells, few reports exist on the nature of the DSB response in mitotic cells. One study showed that when mitotic cells were subject to ionizing radiation, H2AX could be phosphorylated on serine 139, a modification that is specific to DSB's (1). A recently published study examining DNA damage responses in mitotic cells using X-rays and chemical agents suggested that signaling following DNA damage is reduced in mitosis and does not reach full levels until the cells enter G1 (29).
The first laser-induced DNA damage response study on mitotic chromosomes showed that the 532 nm nanosecond-pulsed Nd-YAG laser could also induce the formation of γH2AX (1,5). Subsequently, mitotic chromosomes damaged by the femtosecond near-IR laser resulted in the recruitment of Ku80, a protein subunit of DNA-PK, which is part of the core non-homologous-end joining DNA repair pathway (13). These laser micro-irradiation results further indicated that some DNA damage recognition and repair factor recruitment was occurring during mitosis. But none of these studies described the ultrastructural nature of chromosome damage, and they did not follow the time course after the damage had been induced at the specific chromosome loci. Of the published studies in which short-pulsed lasers (femtosecond to nanosecond pulse regimes) have been used to irradiate individual chromosomes, a wide array of lasers, wavelengths and dosimetry have been employed (Tables 1 and 2). Because of these differences, it is often difficult to compare results, repeat experiments of others and generally interpret the results in terms of known physical mechanisms of ablation and/or alteration.
Table 1.
Laser parameters used in previous chromosome studies
| Laser type | Nd:YAG | Excimer pumped dye laser | PALM microlaser system | Nd:YVO4 | Nd: YAG | Fs Ti: sapphire NIR | ||||
|---|---|---|---|---|---|---|---|---|---|---|
| Wavelength (nm) | 266 | 340 | 337 | 355 | 532 | 1064 | 800 | 800 | 780 | |
| Pulse width | 5.7 ns | 17 ns | 4 ns | 2 ns | 12 ns | 12 ps | 100 ps | 170 fs | 200 fs | 200 fs |
| Repetition rate | 10 Hz | 10 Hz | 60 Hz | 100 Hz | 20 KHz | 76 MHz | 70 MHz | 80 MHz | 76 MHz | 76 MHz |
| Objective Mag./N.A. | ×100/1.25 NA | ×100/0.85 NA | ×100/1.2 NA | ×100/1.3 NA | ×63/1.4 NA | ×63/1.4 NA | ×63/1.4 NA | ×100/1.3 NA | ×63/1.4 NA | ×63/1.4 NA |
| Spot diameter (µm) | 0.26 | 0.49 | 0.32 | 0.33 | 0.46 | 0.46 | 0.93 | 0.75 | 0.70 | 0.68 |
| Energy/pulse | 9 nJ | NA | 0.7 uJ | 6.75 uJ | 377 nJ | 0.098 nJ | 0.0071 nJ | 0.19 nJ | 0.13 nJ | 0.28 nJ, 0.41 nJ |
| Number of pulses | 1 | NA | ∼360 | NA | 200 | 2.28 × 10⁷ | 2.1–4.2 × 10⁹ | 1.04–800 × 105 | 6.54 × 10⁶ | 7.6 × 10⁵ |
| Total energy delivered | 9 nJ | NA | ∼252 uJ | NA | 75.4 uJ | 2234.4 µJ | 15–30 J | 19.5–15 000 uJ | 850 uJ | 210 uJ, 310 uJ |
| Peak irradiance (W/cm2) | 2.98 × 10⁹ | NA | 6.36 × 10¹¹ | NA | 1.86 × 10¹⁰ | 4.84 × 10⁹ | 1.02–1.27 × 10⁷ | 2.49 × 10¹¹ | 1.72 × 10¹¹ | 3.81 × 10¹¹, 5.62 × 10¹¹ |
| Reference | 43 | 44 | 45 | 46 | This study | Personal communication | 47 | 48 | 13 | This study |
References (44,45,48) were carried out on extracted chromosomes. NA = not available.
Table 2.
Chromosome microirradiation parameters for the Nd-YAG nanosecond 532 nm laser
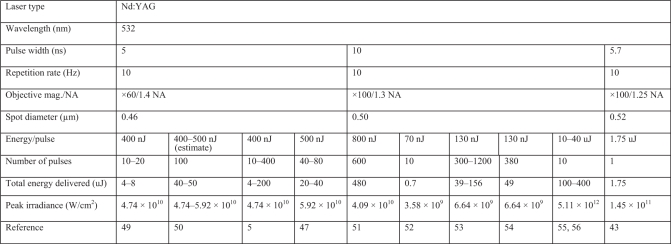 |
References (55,56) are from studies where the chromosomes were extracted from a cell.
In this study we show, using phase contrast microscopy, that chromosomes of the long-nosed potoroo (Potorous tridactylus, PtK2), microirradiated with either the 200 fs near-infrared (NIR) laser or the 12 ns green second harmonic Nd:YVO4 laser, exhibit a rapid change in morphology following laser exposure. The change appears as a phase-contrast ‘lightening’ (referred to as ‘paling’) at the site of laser exposure followed by the formation of phase ‘dark’ material within ∼30 s of the initial laser exposure. The appearance of the phase dark material, which is an entirely new finding and its subsequent increase in size over the first 3 min post-laser, suggests that the increase in phase density represents the accumulation of DNA damage response proteins. To test this hypothesis, cells were immuno-stained for the following initial responders to DSB: Rad50, Nbs1, γH2AX, Ku and ubiquitin (30). We also examined the recruitment of GFP-Nbs1 to the laser-induced chromosomal phase-dark material in stably transfected PtK1 (Potorous tridactylus) cells. We show that formation of dark material and GFP-Nbs1 recruitment occur with similar kinetics and that recruitment of GFP-Nbs1 to chromosomes in mitotic cells is much slower than in interphase cells. In addition, the precise localization and electron microscope ultrastructure of the phase-dark material was characterized by serial thin section transmission electron microcopy (TEM) and 3D reconstruction. The results demonstrate that the laser-induced phase dark material within the chromosomal paling region corresponds to the localization of DSB recognition and repair proteins (Nbs1, Rad50 and Ku). This novel and unexpected finding is similar for chromosomes damaged with either the NIR fs or the ns green lasers, and should be generally reproducible for other investigators interested in studying DNA repair in mitotic chromosomes. Furthermore, the formation of the phase-dark material provides a method to visually track the damage before fixation and determine its fate during mitosis and into G1. We show that the phase dark material continues to co-localize with Ku and Nbs1 2 h post-mitosis in G1, indicating that damage created in mitosis (metaphase and anaphase) has not been completely repaired.
MATERIALS AND METHODS
Cell lines and cell culture
Long-nosed potoroo, Potorous tridactylus (PtK2-male and PtK1-female), epithelial kidney cells originally obtained from the American Type Tissue Culture Collection were grown with Gibco Advanced Minimum Essential Medium (MEM) supplemented with l-Glutamine, 2% fetal bovine serum and were incubated at 37°C with 5% CO2 (31) on gridded imaging dishes (MatTek) until a confluence of 70% was reached. GFP-Nbs1 PtK1 cells were generated using pMXs-GFP-Nbs1 transfected into 293T Phoenix helper cells expressing viral packaging proteins. Transfection into helper cells was done with a Qiagen's Effectene Transfection Kit. On the third day after transfection, the media of the transfected 293T cells was collected and used to infect PtK1 cells. Cells expressing GFP-Nbs1 were then isolated by GFP-based cell sorting using a Becton Dickinson FACS Vantage SE DiVa (32).
Laser exposure and dosimetry
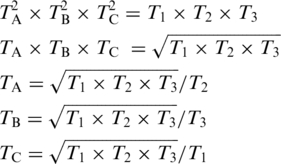
Mitotic chromosomes in live cells were irradiated using diffraction-limited (0.5–1 µm diameter) focal spots either with a Coherent Mira 76 MHz 200 fs micro-pulsed laser emitting at 780 nm or a Coherent Prisma Nd:YVO4 200 KHz 12 ns laser emitting a wavelength of 532 nm. The lasers were focused through a Zeiss 63X 1.4 NA phase contrast objective. To determine the exact irradiance at the focal point, the transmission of the objective at both wavelengths was measured using a modified dual objective method. Two objectives (designated A and B) were placed coaxial so that the lens faced each other with emersion oil and glass coverslips (Fisher Brand 12-542B No. 1) between the two. The objectives were then aligned in the X, Y and Z planes to provide maximum laser transmission. The laser power before the first objective, Pin, and the maximum power after the back aperture of the second objective, Pout, was measured with a Field Max II TOP power meter coupled to a Power Max 3 probe (Coherent Inc., Santa Clara, CA, USA) with a 19 mm diameter sensor surface. The transmission factor calculated was labeled T1 = Pout/Pin and is a product of transmission of both the objectives, therefore, T1 = TA × TB. where TA and TB are the transmissions of objectives A and B, respectively. A total of three objectives (designated A, B, C) were used to obtain three different transmission factors (T1 = TA × TB, T2 = TB × TC, T3 = TC × TA). These values were then used to find the transmission for each individual objective as follows:
 |
The transmission of the Zeiss microscope objective was determined to be 0.50 at 780 nm and 0.58 at 532 nm. Using these determinations, the calculated peak irradiance for a micropulse from the nanosecond 532 nm laser was 1.86 × 10¹⁰ W/cm2. This corresponds to a total energy of 75.4 uJ. For experiments with the femtosecond NIR laser, consistent dark material formation was observed with micropulse peak irradiances from 3.81 × 10¹¹ W/cm2 to 5.6 × 10¹¹ W/cm2 i.e. 210–310 uJ of total energy. The results presented in this study for the NIR laser were done with the lower peak irradiance of 3.81 × 10¹¹ W/cm2. However, a 200 fs micropulse peak irradiance of 5.6 × 10¹¹ W/cm2 is also capable of producing the results described in this article. Cells were irradiated and followed post-irradiation for periods of several seconds to 40 min with a Hamamatsu Orca Camera using previously described methods (33,34).
Immunofluorescent staining
Cells were fixed with 4% paraformaldehyde in phosphate-buffered saline for 20 min. Time to fixation after laser exposure varied from 2 s to 30 s in mitotic cells to 2 h post-mitosis. Cells were permeabilized overnight with blocking buffer containing 0.1% Triton X and 2% fetal bovine serum in phosphate-buffered saline followed by staining with primary antibodies for γH2AX (Upstate Biotechnology, Temecula, CA, USA), Nbs1 (Novus Biologicals, Littleton, CO, USA), Rad50 (GeneTex, San Antonio, TX, USA), Ku (Santa Cruz Biotechnology, Santa Cruz, CA, USA), phospho-H3 (Ser 10) (Cell Signaling Techonology, Boston, MA, USA), poly and mono ubiquitination (Stressgen, Ann Arbor, MI, USA) at a dilution of 1:500. Secondary antibodies against primaries were Alexa-488 goat anti-mouse (Invitrogen, Carlsbad, CA, USA) and Cy3 goat anti-rabbit (Invitrogen, Carlsbad, CA, USA) at dilutions of 1/1000. The images were analyzed and edited to enhance the contrast and intensity using Image J software (35).
TEM
Laser-irradiated mitotic cells were fixed using Karnovsky solution consisting of 2% paraformaldehyde and 3% glutaraldehyde at 3 and 150 s post-laser using a perfusion system that introduced fixative into the culture chamber upon irradiation as described previously (33). Further processing for single cell TEM was carried out using established methods (36–38). Three dimensional EM reconstruction using 60 nm thick sections was carried out by aligning structures that appeared in successive images such as mitochondria or fragments of the Golgi membranes. Images were then stacked, adjusted for brightness and contrast, and rendered in 3D using ImageJ 3D Viewer.
RESULTS
Phase contrast microscopy
PtK2 chromosomes damaged by the femtosecond NIR laser exhibit phase paling in the exposed area within 5 s of the laser irradiation (compare Figure 1a, prelaser image, to b, arrow). The phase paling persists for several seconds (Figure 1c and d) and is followed by an accumulation of material to form a phase dark spot (referred to as ‘phase dark material’) within the large phase-paling area (Figure 1e–j). The phase dark material appears within 20–30 s of laser exposure and it appears faintly dark (Figure 1d, inset). By 34 s (Figure 1e) the material is observed more clearly as it has increased both in darkness and in size. As time progresses, the material further increases in darkness and size (Figure 1f–j). When a total of 10 cells were analyzed after laser exposure at a peak irradiance of 5.6 × 10¹¹ W/cm2, the average time to appearance of the dark material was 34.8 s (SD ± 4 s). Despite the relatively high irradiance, 14 of 14 cells completed mitosis and entered G1 in a timely manner (Supplementary Video 1).
Figure 1.

Chromosomes irradiated by the femtosecond laser show a phase paling immediately after ablation followed by the formation of a phase dense spot. Bottom right corner of each picture shows the time after laser exposure. (a) Pre-irradiation image. (b) Immediately after irradiation (5 s post-laser) there is a phase paling at the area exposed to the laser which persists after 16 s (c). Within 23 s (d) there is an appearance of phase dark material (see inset) and after 34 s (e) the material has increased in size and appears darker (see inset). As time progresses, the spot observed in (e) increases in darkness and diameter (f–j). (g) Fifty-six seconds post-laser the dark material is larger in size (arrow). (h) One minute and 18 s post-laser the material is darker than in (g). (i) Dark material is larger than in (h). (j) Dark material has increased in size and darkness when compared to (i). A chromosome irradiated by the green nanosecond laser demonstrates a phase paling similar to that observed with the femtosecond NIR laser. Images are labeled according to time after irradiation. (k) Pre-irradiation image. (l) Immediately after irradiation there is a phase paling at damage site (arrow). (m) Eight seconds post-laser the phase paling observed in (l) appears larger in size. (n) Thirty-nine seconds post-laser we start to see the appearance of a small phase dark spot. (o) Seventy seconds post-laser the spot is larger and darker and continues to grow (p and q).
The change in the phase contrast darkness of the irradiated chromosome region is quantified by taking the gray value along a one pixel-wide line through the irradiated region where every 10 linear pixels is equivalent to 1 μm (Supplementary Figure S1). At time zero (Supplementary Figure S1a), the gray values along the line range from 190 to 200 on a scale where 0 is white and 250 is black. Three to five seconds post-laser, gray values are observed to drop <190 in the laser exposed region. The diameter of this ‘phase paled’ region is determined by finding the distance between the points on the plot where the line begins to drop. At 5 s post-laser, the diameter of the phase-paled material is 0.9 µm.
The phase-dark material initially appears as a small peak rising from the lowest points of the plots on the graph and can be detected 23 s following laser exposure (Supplementary Figure S1a). Although the phase change can be detected in Figure 1d (inset), the change could easily have been missed without using the digital camera for pixel measurements. By 3 min post-irradiation, the diameter of the dark area is 1 µm (Supplementary Figure S1b).
Chromosome alterations produced by the green nanosecond laser are similar to those observed with the femtosecond laser (Figure 1k–q). Phase paling is observed 3 s post-laser (Figure 1l) with a slight increase in size by 8 s post-laser (Figure 1m). A phase image taken 39 s after laser exposure (Figure 1n) shows initiation of dark material in the irradiated area (see inset). The phase dark material increases in size and darkness over time (Figure 1n–q). Profile gray value plots for lines through the altered region are similar to those observed for the femtosecond NIR laser. The gray values decrease in the irradiated area (phase paling) and start to increase with time (Supplementary Figure S2). The measured paled diameter after 3 s is 1 µm. In this particular cell, the laser actually irradiated the left side of the chromatid plus some of the material in-between the two chromatids. The bright spot in the image was observed immediately following the laser irradiation and represents a change in refractive index of the inter-chromatid material. The actual exposed portion of the chromatid followed in this experiment can be seen on the left side of the bright spot (Figure 1l and m).
Electron microscopy
TEM of cells fixed immediately after laser exposure demonstrates that the phase paling corresponds to a decrease in chromatin electron density. Figure 2 contains phase images of the chromosomes immediately after exposure for both the fs NIR and the ns green laser (Figure 2a is NIR fs laser, and 2d is ns green laser). These cells were fixed using a perfusion system that introduced fixative within 1–10 s after laser exposure. Electron micrographs to the right of the phase images demonstrate a difference in electron density at the laser exposure site in comparison to the surrounding chromatin. The shape and diameter of the phase paled region (Figure 2a and d) matches the electron-diminished area in the electron micrographs (Figure 2b and e). For example, the phase-paled diameter measured by light microscopy is 0.8 µm for the chromosome damaged by the NIR laser (Figure 2a), and the diameter of the electron-diminished area in Figure 2c is 0.87 µm. The light microscopy measured paled diameter induced by the green laser is 0.7 µm (Figure 2d) and the diameter of the corresponding region in the electron micrograph is 0.72 µm (Figure 2f).
Figure 2.

TEM reveals that the phase change created by the near-IR and green laser (3–10 s post-laser) is due to a change in the chromatin structure. However, the phase change observed 150 s post-laser is due to an aggregation of electron dense material different from the surrounding chromatin. (a) Phase image of a cell damaged with the femtosecond near-IR laser shows the change in the phase contrast at the site exposed to the laser (arrow). The corresponding electron micrograph (b) depicts a change in the electron density at the damage site. (c) Magnification of lesion shown in (a) and (b). The diameter of the electron diminished spot is 0.87 µm. (d) Phase image of a cell damaged with the nanosecond laser. (e) Corresponding TEM of cell shows a change in electron density at the damage site. (f) Magnification of damage site as seen in (d) and (e) (arrows). The measured electron diminished spot diameter is 0.72 µm. Cells fixed 150 s after exposure to the near-IR femtosecond (g–i) and the green nanosecond (j–l) laser with corresponding transmission electron micrographs. (g) Phase image of a cell targeted with the femtosecond laser showing phase dark spots at the chromosomal lesion (arrows). (h) Transmission electron micrograph of the cell shows the phase dark spots correspond to an increase in electron density when compared to nearby chromatin. Only dark material on chromosomes damaged by the laser is relevant to this study. (i) Magnification of the electron dense material. (j) Phase image of a cell damaged by the green laser shows phase dark material (arrow). (k) Phase dark material shows up as electron dense on the electron micrographs. (l) A magnified view of the material shows it is much more dense than the surrounding chromatin and appears similar to that formed when the damage is caused by the femtosecond laser.
NIR laser-exposed chromosomes were examined using serial section (60 nm/section) TEM in cells that were fixed within 1–2 s of exposure (Figure 3). Nineteen sections were analyzed (Figure 3a–s), resulting in an approximate depth of 1.14 µm. Fourteen of the sections contained recognizable laser alteration as indicated by a lack of electron density when compared to surrounding chromatin (Figure 3a–n). Therefore, the alteration zone was 780 nm deep or 6.45 × 10⁸ nm3 in volume. The volume calculation was made by blacking out and then summing the altered areas in each section. Each image represents a section progressing from the bottom of the cell, the region closest to the glass substrate (Figure 3a), to the top of the cell (Figure 3s). Moving from bottom to top, the altered region becomes smaller in area (Figure 3a–n). A three dimensional reconstruction confirms that the size of this region decreases, moving from the bottom of the chromosome to the top (Supplementary Video 2). This also corresponds to the position of the chromosome in the cell with respect to the bottom and top of the cell.
Figure 3.

Serial sections of a chromosome fixed 1–2 s post near-IR laser damage. Sections go from the area closest to the subtrate/coverslip to the top of the cell. The damaged area appears smaller in size moving from (a–n) and this reflects the laser beams Gaussian profile where the greatest amount of energy will be deposited in the focal spot.
Electron micrographs of cells fixed 150 s post-laser exposure show that the phase dark material observed under live-cell phase contrast microscopy corresponds to an increase in electron dense material at the laser exposure site (Figure 2g–l). Both the localization and the fine structure of this material are identical for cells exposed to either the femtosecond NIR laser (Figure 2g–i) or the green nanosecond laser (Figure 2j–l). This electron dense material is distinguished from the surrounding chromatin in that it is darker and appears to be more tightly aggregated (denser) than the chromatin (See high-magnification TEM's, Figure 2i and l).
DSB response
Cells damaged by the NIR laser were fixed and stained for phosphorylated serine 139 on histone H2AX, a DSB marker, and for Nbs1 an initial responder to DNA damage. A cell prior to laser exposure is shown in low and high magnification (Figure 4a and e). Phase paling is observed 2 s post-laser (Figure 4b and f, arrows) and at 40 s phase-dark material is evident (Figure 4c and g). Eight minutes post-laser, the cell was fixed for immuno-fluorescence staining (Figure 4d and h). In the fixed image, the phase dark material is still visible and appears to have increased in size prior to fixation (Figure 4h). Immuno-fluorescence staining for Nbs1 (red) results in a strong fluorescence spot (Figure 4j) similar in shape to the phase dark material seen in Figure 4h. Overlapping images of the phase and fluorescence for Nbs1 show co-localization of Nbs1 and the phase dark material (Figure 4I). When γH2AX fluorescence (Figure 4k) is overlapped with the phase image (Figure 4h), γH2AX surrounds and partially overlaps the phase dark material (Figure 4i). Overlapping images of the Nbs1 (red) and phase dark material (Figure 4m and n) show that the γH2AX (green) also slightly overlaps Nbs1 (red). Rad50, a protein involved in DSB repair that forms a complex with Nbs1 and Mre-11, was also observed to localize in the same region as the phase dark material (data not shown).
Figure 4.

Femtosecond laser irradiation induces a phase dark spot that results in the co-localization of Nbs1 and in the formation of γH2AX on the surrounding damaged area. Shown above (a–d) and corresponding zoomed in figures (e–h). (a and e) Pre-irradiation images. (b and f) Post-irradiation image shows a phase paling at site exposed to laser. (c and g) After 40 s there is the appearance of a phase dark material (arrow). (d and h) Post fixation images. Cells were fixed and stained for phosphorylated γH2AX (k, green) and for Nbs1 (j, red) 8 min after laser irradiation. γH2AX is observed to surround the damage site (k) and (l; an overlap between h and k). Nbs1 colocalizes with the phase dark material as shown on (i; an overlap between h and j). (m) An overlay between Nbs1(j), yH2AX(k) and phase image (h) shows the position of these proteins with respect to the dark material. (n) A merged image between (j) and (k) shows that Nbs1 and yH2AX do not completely overlap.
The results of Nbs1 immuno-staining of cells damaged by the green nanosecond laser are similar to those of cells damaged using the NIR femtosecond laser. Nbs1 fluorescence forms a spot with strong fluorescence (red in Figure 5d and e) at the damage site. When Figure 5e is overlapped with 5c the fluorescence co-localizes with the phase dark material and encompasses the ‘paled’ area that surrounds the dark material (Figure 5d). Additionally, staining for γH2AX shows strong fluorescence surrounding the irradiated region (Figure 5f). When the Nbs1 fluorescence image (Figure 5e) is overlapped with the γH2AX (Figure 5f), γH2AX is observed to surround and slightly overlap Nbs1 (Figure 5g). An overlay between the image of the phase dark material (Figure 5c) and the fluorescence image for γH2AX (Figure 5f) shows that γH2AX surrounds the irradiated region, the phase paled area and the dark material (Figure 5h). This is the same observation seen when cells are immuno-stained following damage with the NIR femtosecond laser.
Figure 5.

The green nanosecond laser can produce phase dark spots similar to those observed with the femtosecond near-IR laser. (a) Shows a pre-laser image. (b) Phase paled spot (arrow and inset). (c) Two minutes 39 s post-laser a phase dark spot is observed. (d) An overlay between (c) and (e) shows that there is co-localization between Nbs1 and the dark material. (e) Image showing the only Nbs1 fluorescence (red). (f) γH2AX fluorescence image. (g) Overlapped image of (e) and (f) showing the localization of Nbs1 with respect to γH2AX where the γH2AX partially surrounds Nbs1 where chromatin is present and slightly overlaps it in some areas. (h) Overlapped phase and fluorescent image showing that γH2AX surrounds the dark spot and slightly overlaps it in a way similar to that observed with the Nbs1 fluorescent spot. A second green laser lesion induced on a different chromosome was fixed prior to the appearance of a phase dark spot and stained for Nbs1 (m) and γH2AX (n). (i) Pre-irradiation image. (j) Ten seconds post-laser a phase paling is observed. (k) At 32 s post-laser the paling appears larger in area. (l) An overlap between (m) and (k) show that Nbs1 is diffuse around the cell and chromosome lesion. (o) Nbs1 and yH2AX fluorescent images were merged to show that Nbs1, red, is diffuse around the yH2AX, green. (p) γH2AX is observed to form within and around part of the chromosome lesion.
A second green laser alteration induced on a different chromosome within the same cell shows an increase in the size of the phase paled region between 10 and 32 s post-laser (Figures 5j and k, respectively). However no phase dark material is formed. Nbs1 immuno-staining for this lesion shows no significant difference in fluorescence from the background staining surrounding the chromosomes. An overlay of the last phase image (Figure 5k) with the Nbs1 fluorescence image (Figure 5m) shows only a background level of fluorescence in the paled area (Figure 5l). These results suggest that the presence of the phase dark material is a result of an accumulation of DNA damage recognition and signaling proteins at the irradiation site. However, this lesion exhibits strong γH2AX accumulation (Figure 5n) that encompasses part of the phase paled region (Figure 5p, an overlay between Figure 5k and Figure 5n). We believe that the differences in Nbs1 fluorescence and phase dark material formation observed in the first and second lesion are due to the length of time between irradiation and fixation. The first lesion was fixed 3 min 15 s post-laser and the second was fixed 35 s post-laser. Therefore, the first lesion had significantly more time to recruit the Nbs1.
Cells damaged by the NIR laser were subjected to DAPI (4′,6-diamidino-2-phenylindole) and Nbs1 immuno-staining. In Figure 6b, two chromosomes (arrows at top and bottom of cell) have been nicked by the laser and exhibit phase paling at the irradiation site 2 s post-laser (see Figure 6a for pre-laser images). The cell was fixed within 1 s of the image acquisition (i.e. 3 s post-laser). Immunofluorescence for Nbs1 (Figure 6d) exhibits only background fluorescence at the laser irradiation site. DAPI staining shows a lack of fluorescence at the damaged regions (Figure 6c, arrows). In another laser-exposed cell (Figure 6e) that was fixed >21.5 min after laser exposure, the laser-induced dark material is still visible after fixation (Figure 6f). DAPI staining of this cell also shows a lack of fluorescence at the damaged region (Figure 6g). However, Nbs1 immunostaining shows distinct fluorescent localization in the laser-exposed area (Figure 6h, arrow). These results indicate that the DNA within the laser exposed area has been altered to such a degree that it cannot be recognized by DAPI. However, this does not indicate that a chromosome fragment has been detached or that there is open space devoid of chromatin. If this were the case, no localization of Nbs1 would be observed at the irradiation sight.
Figure 6.

Cells fixed prior to the formation of the phase dark spot do not show strong Nbs1 localization at the damage site. (a) Pre laser. (b) Two seconds post-laser paling is observed on two chromosomes damaged by the laser (arrows). This cell was fixed 3 s post-laser. (c) DAPI staining shows lack of fluorescence in areas damaged by the laser (arrows). (d) Nbs1 demonstrates background fluorescence in chromosomal lesions (arrows and insets). (e) Different cell 1 min 35 s post-laser shows phase dark spot in damaged region (arrow). (f) Post-fixation image of cell 21 min and 25 s post-laser. (g) DAPI staining shows lack of fluorescence in damaged area. (h) Nbs1 immunofluorescence staining shows a bright fluorescing spot at the lesion.
To determine whether the dark material at the irradiation site is a result of an accumulation of different proteins, we stained for Ku, a highly conserved protein involved in the core non-homologous end joining pathway (Figure 7a–e). A phase image of a cell fixed 3 min post-laser shows two dark spots in two different chromosomes targeted by the laser (Figure 7a). Immunostaining for Ku shows strong fluorescence (Figure 7b) that co-localizes with the dark material (Figure 7e, an overlay between 7a and b). Figure 7c is an immunofluorescence image for histone H3 phosphorylated on Ser10, a modification that is specific to mitotic chromatin. Staining for phospho-H3 shows lack of fluorescence at the damage site. These results are consistent with our results for γH2AX (Figure 4k) and indicate that the dark material does not consist of recognizable histone protein. An overlay between Ku and phospho-H3 shows that Ku localizes within the lesion (Figure 7d).
Figure 7.

Ku and ubiquitin co-localize with the phase dark material in cells irradiated by the laser (scale bars measure 10 µm). (a) Phase image of a cell fixed 3 min post-laser. Arrows depict both areas targeted by the laser. (b) Immunofluorescence staining for Ku shows two bright spots that are similar in shape and size as the dark material. (c) Phospho histone H3 (Ser 10) immunostaining shows lack of staining in the area damaged by the laser. (d) Overlay between Ku and phospho histone demonstrates the position of Ku fluorescence with respect to surrounding chromatin. (e) Overlay between phase fixed image and Ku fluoresence image shows co-localization between the dark material and Ku. (f) Phase image of a fixed cell 20 min post-laser, an arrow depicts the location of the phase dark material that formed after laser irradiation. (g) Ubiquitin immunofluorescence demonstrates a bright spot at the area damaged by the laser. (h) Phospho histone H3 (Ser 10) immunostaining. (i) Overlay between ubiquitin and phospho histone fluorescence images. (j) Fixed phase image overlapped with ubiquitin fluorescence demonstrates that the dark material co-localizes with ubiquitin. (k) Fixed phase image of a cell 2 min 30 s post-laser shows dark material (arrows and inset). (l) Ubiquitin staining demonstrates strong fluorescence in the shape of the dark material (arrow). (m) Phospho histone staining shows lack of fluorescence in the area targeted by the laser. (n) A merge between (l) and (m) illustrates that ubiquitin (green) is found within the area lacking phospho-H3 staining(red). (o) An overlap between ubiquitin staining (i, green) and (k) shows co-localization between the dark material and ubiquitin.
Ubiquitin, a highly conserved protein modification observed to occur on proteins associated with chromatin at DSB's (Figure 7f–j), overlaps with the dark material. Figure 7f is an image of a cell fixed 20 min post-laser; arrows depict the phase dark material at the damaged site. Staining for ubiquitin shows strong fluorescence (Figure 7g, arrow) that overlaps with the phase dark material (Figure 7j, overlay between f and g). In this example, phospho-H3 (Figure 7h) staining does not show a lack of fluorescence at the damage site as expected and observed in Figure 7c (arrows). We believe this is due to the proximity of other chromosomes (Figure 7h). A second cell fixed 2 min and 30 s post-laser (Figure 7k) also has accumulation of ubiquitin in the area targeted by the laser (Figure 7l, arrow). In this example, there is a lack of phospho-H3 fluorescence in the area targeted by the laser (Figure 7m). When Figure 7l (ubiquitin, green) and 7m (phospho-H3, red) are overlapped, we observe ubiquitin localizing in the area that lacks histone staining (Figure 7n, arrow and inset). Figure 7o shows an overlap between the dark material and ubiquitin fluorescence (green).
PtK1 cells expressing GFP-Nbs1 also were used to examine DNA damage response protein localization. These cells were observed by fluorescence time lapse imaging. Figure 8a depicts a chromosome prior to irradiation. A green cross-hair indicates the area targeted by the laser. Immediately to the right is a pre-laser background fluorescence image (Figure 8b). Upon laser exposure, time lapse (∼10 frames/s) fluorescence imaging was initiated. The first post-laser fluorescence image was taken 6 s after laser exposure (Figure 8c). At that time point there is no detectable GFP-Nbs1. The profile plot for this time point (Supplementary Figure S3, 6 s post-laser) shows that the gray values along a line drawn through the irradiated area are similar to those observed for the pre-laser image. However, an image taken 17 s post-laser shows the presence of GFP-Nbs1 in the same area targeted by the laser (Figure 8d). When graphed (Supplementary Figure S3; triangles), the 17 second plot has higher gray values in the middle demonstrating an increase in fluorescence in the irradiated area. Both the area and the amount of fluorescence are observed to increase over time (Figure 8e–g and Supplementary Figure S3). Phase images of the same chromosome show phase dark material in the laser-exposed area (Figure 8h). An overlay of the phase and the fluorescence images show co-localization of the phase dark material and GFP-Nbs1 (Figure 8i).
Figure 8.

Cells expressing GFP-Nbs1 show an increase in fluorescence intensity and radius at chromosomes damaged by the laser which is similar to the formation of the phase dark material. (a) Pre-laser phase image where the green cross-hair shows the area targeted by the laser. (b) Fluorescence pre-laser image. Each image is labeled with the time following laser exposure. (c) Six seconds post laser GFP-Nbs1 accumulation is still undetectable within the damaged site. (d) Seventeen s post-laser we get fluorescence. (e–g) As time progresses, fluorescence is seen to increase in intensity. (h) Final phase image taken showing the phase dark region. (i) Shows the overlap between the fluorescence and phase dark spot observed in (h).
The accumulation of GFP-Nbs1 in mitotic cells was quantified in order to determine the recruitment constant, which subsequently could be compared with that of interphase cells and with the phase dark material. The results reveal that the dark material and GFP-Nbs1 accumulation both fit a first-order exponential function (Figure 9a and b). Measurements in GFP-Nbs1 cells were accomplished by taking the mean pixel intensity of a box enclosing the damaged area and subtracting the background within the same cell. Each data set was normalized to a 0–1 scale and then averaged to create one curve with standard deviation bars (Figure 9a). A total of 11 cells were measured for each graph. Graphs were individually fitted to a first-order exponential function and the time constant was calculated for each so that a mean recruitment time constant could be determined. The average GFP-Nbs1 recruitment constants are 309.4 ± 72.6 s (N = 11) and 74.7 ± 25.2 s (N = 11) for mitotic and interphase cells, respectively.
Figure 9.

(a) The recruitment of GFP-Nbs1(τ) to mitotic chromosomes is slower than in interphase chromatin. The blue line represents the average GFP-Nbs1 data for interphase cells (N = 11) with standard deviation bars shown. The calculated recruitment constant is 74.7 ± 25.2. This is smaller than the constant calculated for mitotic cells (N = 11), 309.4 ± 72.6. (b) Dark material accumulation plotted as diameter and mean intensity over time also follows a first-order exponential model. The time constant (τ) for increase in intensity was found to be 40.64 ± 22.5. The constant for increase in diameter was found to be 76.18 ± 18.6 demonstrating that the intensity increases faster than the size. Interestingly, the diameter time constant is similar to GFP-Nbs1 accumulation in mitotic cells and close to the intensity time constant.
Dark material time constants were obtained by measuring the diameter and mean intensity and plotting them as a function of time (Figure 9b). Images containing immediate phase paling were excluded from the analysis. The graphs were then normalized and fitted as described previously. A total of seven cells were measured. Constants of 40.6 ± 22.5 s (N = 6) and 76.2 ± 18.6 s (N = 7) were calculated for the increase of darkness and diameter of the dark material, respectively.
In order to determine the fate of dark material in G1, cells damaged in metaphase and anaphase were followed and fixed 2 h after mitosis. Nbs1 and Ku (Figure 10) continued to co-localize with the dark material. Ubiquitin localized around the dark material and slightly overlapped it (Figure 10a, b and e). For comparison, the daughter cell that did not contain the dark material was included in the figure and served as a negative control. Figure 10a shows the phase image of a cell fixed 2 h after mitosis. A white box encloses the dark spot and a magnified view (inset) of the area containing the dark material is shown. The dark material is on the edge of the nucleus, near the nuclear membrane. Ubiquitin immunofluorescence was strong in the daughter cell containing the dark material (Figure 10b). A magnified view shows a lack of fluorescence in the center that is similar in shape to the dark material in Figure 10a. Nbs1 staining results in strong fluorescence (Figure 10c) that overlaps the dark material (Figure 10f; an overlap between 10a and 10c). Figure 10d is an overlap between 10b (ubiquitin) and 10c (Nbs1). This figure shows ubiquitin surrounding and slightly overlapping the Nbs1. When the position of ubiquitin relative to the dark material is examined (Figure 10e, which is an overlap between 10a and 10b), ubiquitin is observed to surround the dark material. A different cell immunostained for Ku and Nbs1 also contains the dark material at the edge of the nucleus (Figure 10g, arrow). In this cell, Ku and Nbs1 co-localize (Figure 10j, overlap of h and i) with each other. Additionally, Nbs1 co-localizes with the dark material (Figure 10k, overlay between g and h) as does Ku (Figure 10l).
Figure 10.

Phase dark material created in mitosis can be followed into G1. (a) Phase image of daughter cells fixed 2 h after cytokinesis. A box encloses the dark material formed in mitosis and followed into G1 (inset). (b) Ubiquitin staining of daughter cells shows that there is strong fluorescence in the daughter cell containing the damage. A magnification of the fluorescence (inset) shows lack of staining in the middle which is similar in shape to the dark material observed in (a). (c) Nbs1 staining. Bright spots appear in one of the daughter cells. (d) Overlap image between Nbs1 (red) and Ubiquitin (green) demonstrates that Nbs1 is surrounded by the ubiquitin and is slightly overlapped by it. (e) Overlap between (a) and (b). The dark material is surrounded and overlapped on the periphery by ubiquitin (green). (f) Overlap of (a) and (c). Nbs1 co-localizes with the dark spot. (g) Different cell fixed 2 h post-mitosis. The dark material is observed at the edge of the nucleus. (h) Nbs1 fluorescence is similar in shape. (i) Ku fluorescence. (j) Overlay of (h) and (i) demonstrates that both Nbs1 and Ku are in the same location within the cell. (k) Nbs1 (green) overlaps the dark material. (l) Ku (red) overlaps the dark material.
DISCUSSION
Comparison of laser systems and mechanisms of interaction
Previous phase-contrast microscope studies involving microirradiation with the 225–300 nm UV laser (39,40), 488–514 nm argon ion laser (21,23) and the 483–519 nm dye laser (21,36) have described chromosomal alterations as phase-paled regions when compared with the surrounding chromatin. These early studies were performed with laser exposures in the millisecond (ms) and microsecond (µs) domains. More recently, chromosome damage created with shorter pulsed femtosecond near-IR (NIR) and the green nanosecond (ns) lasers resulted in paling similar to that observed in those early studies (Figure 1b and i). However, unlike the earlier studies with the longer pulsed laser systems, when the short pulse lasers are used in the studies reported here, a small amount of phase-dark material appears within the larger paled region of the chromosome. This material forms 34–39 s post-laser exposure. This is evidenced by both pixel intensity profiles (Supplementary Figures S1 and S2) and the phase contrast chromosome images (Figures 1e, and 1n arrows). Previous laser chromosome microirradiation studies have not reported the formation of phase dark material at the irradiation sites. This could be due to differences in laser radiation dose, wavelength, pulse duration or time from exposure to fixation. For example, in a study utilizing the argon ion laser to alter a submicron region of PtK2 chromosomes, cells were fixed within 30 s of laser exposure, a time period which may not have been long enough for the phase dark material to form (41).
Recent DNA damage response studies on interphase cells using short-pulsed lasers to microirradiate narrow regions in the nucleus (usually 1–2 µm in width and 5–10 µm in length) did show phase paling followed by a phase darkening that co-localized with several DSB recognition and signaling factors. This was observed for the following lasers: (i) the nanosecond and picosecond 532 nm laser (4,19,42); (ii) the nanosecond 337nm UVA laser with and without BrdU, 5-bromo-2-deoxyuridine (19); and (iii) the femtosecond near-IR laser (4,13,16,19). In one study using the same fs NIR laser reported here, both phase paling and darkening were observed and they appeared to be dependent on the laser dose. At the lower irradiance (2.1 × 10⁶ W/cm2), no detectable nuclear phase change was observed. At higher irradiance (6.1 × 10⁶ W/cm2) a phase paled line appeared immediately following laser exposure, and over a 3–30 s time period a phase dark line appeared (16). These results from laser microirradiated interphase nuclei support the suggestion that the phase dark material observed in the laser-irradiated chromosomes is a function of the laser dose.
However, as reported previously for laser irradiated interphase cells (19), and in published studies where mitotic chromosomes have been irradiated, a large variety of different laser parameters, including wavelength, pulse duration, peak irradiance, total energy, etc., have been used by different investigators (Tables 1 and 2) (5,13,43–56). This makes comparisons between studies and repeatability by other labs difficult. For example, chromosomes have been irradiated with short-pulsed lasers in the UV (266, 337, 340 and 355 nm), visible (primarily 532 nm) and the NIR infrared (760, 800 and 1064 nm). Pulse durations have ranged from 170 fs to 17 ns, and peak irradiances from 107 to 1011 W/cm2. Particularly, for the 532 nm second harmonic wavelength of the Nd:YAG and Nd:YOV4 which have been used in many chromosome irradiation studies in live mitotic cells (Table 2), even though the wavelength has been identical and pulse durations have been relatively similar (5–10 ns), there has been considerable variation in the total energy used per irradiation spot (0.7–400 µJ), and the peak irradiances have ranged from 109 to 1012 W/cm2. In addition, with the increasing interest in the NIR fs lasers for cellular microablation studies, the choice between which laser system and dosimetry to use becomes problematic for the non-engineer/physicist biologist. Therefore, it is important to establish a set of laser parameters that can be used to produce consistent and well-defined alterations to the DNA and chromatin. Further, understanding the precise physical mechanism(s) of the alteration process would be extremely useful for interpretation of the observed structural and biochemical alterations in the targeted region. As discussed previously (19,33), four potential mechanisms for the production of damage to the target structure can occur: (i) temperature rise produced by linear or two photon absorption; (ii) generation of large thermo-elastic stresses; (iii) various photochemical processes by linear or two photon absorption including DNA cross-linking damage and production of free radicals and reactive oxygen species; and (iv) optical breakdown (plasma formation) produced by a combination of multiphoton and cascade ionization processes, leading to thermal, mechanical and chemical damage. It is possible that one or more of these mechanisms is occurring in a single irradiation event, especially when rapidly pulsing lasers are used because thousands of individual laser pulses may be included in any single irradiation event. For example, in the studies reported here, the 200 fs NIR laser operates at 76 MHz, so a millisecond exposure results in 760 thousand pulses in an irradiated spot. In the case of the green ns laser, a millisecond exposure contains 2000 pulses of light. In both of these cases, it is very possible that the first (or first several) pulse in the pulse train alters the absorption properties of the target material such that the remaining pulses may interact with the target quite differently. This secondary interaction mechanism may be thermal as opposed to the first pulse which may cause the change via a multiphoton or plasma-mediated process (33). In addition, it is often difficult to compare the different studies (Tables 1 and 2) in the published literature with respect to ablation mechanisms since the laser wavelengths and operating parameters (pulse duration, pulse repetition rate, energy dose, irradiance and methods of measuring the laser energy in the focal spot) may differ considerably between studies, or it is even possible that this key information is not in the manuscript because the commercial laser microscope systems are designed in such a way that all the relevant dosimetric information is not easily determined (45,46). With respect to this latter point, it is really important that all this information be provided so that comparison between studies can be made.
Ultrastructural alteration of chromatin
In order to more fully characterize the extent and nature of the changes in the irradiated region of the chromosome, serial thin-section TEM was performed on single irradiated cells. Micrographs of cells fixed 3–10 s after exposure to the NIR (Figure 2a–c) and green lasers (Figure 2d–f) show that the phase paling observed at the light microscope level correlates with a decrease in electron density of the chromatin in the exposed regions. This decrease in electron density appears identical for both the femtosecond NIR and the nanosecond green lasers. Serial TEM sections show that there is greater laser-induced change to the chromatin closest to the substrate (Figure 3), previously defined as the side closest to the glass surface. That alteration appears to decrease moving away from the substrate. This alteration in geometry is consistent with a three-dimensional spherical Gaussian laser beam profile, where the center of the profile has the highest photon density conferring the highest level of alteration. In addition, serial section TEM analysis confirms that the loss of electron density in the focal volume is not the result of material being pushed or ejected into another plane. Had this been the case, displaced or altered chromatin would have been observed in one of the serial sections above or below the altered region. While Figures 3a and b do show some recognizable chromatin within the ‘laser-exposed’ area, this is not enough to account for the chromatin missing from other sections. However, it is possible that the laser-irradiated chromatin has been altered at its molecular level so that it does not bind the uranyl acetate, a stain known to form ionic bonds with the phosphate groups of DNA (57).
Electron micrographs of cells fixed 150 s post-laser reveal a subsequent increase in dark-staining electron dense material, which appears to have accumulated with time (see Figure 2g–l). This new material that has aggregated in the irradiation site corresponds both in location and time to the phase dark material observed with the light microscope. The time-dependent accumulation of this electron dense material suggests that its formation may be due to an accumulation of DNA damage response proteins.
Dark material is a result of DSB response proteins
To examine the hypothesis that the dark material represents the accumulation of DNA damage response proteins, laser-irradiated chromosomes were stained for known markers for DNA DSB's (γH2AX) and initial DNA damage response proteins (Nbs1, Rad50 and Ku, discussed later). The highly conserved MRN protein complex, consisting of Mre-11, Rad50 and Nbs1 is known to be recruited to damaged DNA and activate ATM, a kinase involved in the phosphorylation of proteins involved in cell cycle control and DNA repair (58,59). For example, ATM phosphorylates the histone H2AX variant on serine 139 (termed γH2AX) in response to DSB's (1,2,60). MRN's ability to be recruited to damaged DNA without ATM suggests that this complex is an initial DNA damage responder (61–63). Moreover, Nbs1's rapid accumulation to damage sites suggest that Nbs1 should be detected in our laser studies (64,65). Lukas et al. observed the accumulation of two DNA damage response proteins, GFP-Nbs1 and GFP-MDC1, as early as 20 s after UV laser exposure to nuclei of interphase cells (7,66). These studies confirm that the DNA damage response can occur in a time frame similar to that of the accumulation of the phase dark material and the Nbs1 recruitment reported here. We observed localization of Nbs1 as early as 17 s post-NIR laser exposure (Figure 8d) which is comparable to the 20 s post-UV laser exposure observed by Lukas et al. (7,65). Our results are not only consistent with studies showing Nbs1 accumulation as early as 20 s post-laser but they also demonstrate that the detection of DNA damage on mitotic chromosomes can occur as rapidly as it does in interphase nuclei.
However, subsequent recruitment of GFP-Nbs1 is slower in mitotic cells than in interphase cells (Figure 9a; compare red and blue graph). This is most likely due to the fact that mitotic chromosomes are highly condensed structures where the DNA and associated proteins are supercoiled into a structure approximately 10-fold more condensed than in an interphase chromosome (67,68). Additionally, our results demonstrating that the increase in dark material diameter is occurring with similar kinetics to GFP-Nbs1 recruitment further indicate that the dark material is comprised of initial DNA damage response proteins. However, it is not clear why there is a difference in the increase in darkness and diameter time constants. We speculate that the increase in darkness occurs a little faster rate because the recruited proteins go to the center of the damaged site first and then aggregate around the damaged site resulting in an overall increase in size.
The localization of Ku with respect to the laser-induced dark material was also studied. Mari et al. demonstrated that Ku was recruited to metaphase and anaphase chromosomes in hamster cells when damaged by the femtosecond NIR laser at a peak irradiance of 1.72 × 10¹¹ W/cm2. However, those experiments were done by cutting through several chromosomes in a linear region and the authors did not report whether there were changes to the chromosomes at the light microscopy level. Our results show that peak irradiances of 3.81 × 10¹¹ to 5.6 × 10¹¹ from the NIR laser can also be used to damage mitotic chromosomes resulting in the accumulation of Ku heterodimer at the irradiation sites which overlaps with the phase dark material observed in the light microscopy images. Additionally, we show (Supplementary Figure S4) that nanosecond laser irradiance of 1.86 × 10¹⁰ W/cm2 is also capable of damaging individual chromosomes of PtK1 and PtK2 cells and that Ku is recruited to these damage sites.
Remarkably, ubiquitylation was also observed at mitotic lesions and co-localizes with the dark material (see Figure 7). This biochemical modification is highly conserved in eukaryotes and is frequently associated with proteasome degradation. Studies have elucidated its role in the DNA damage response through RNF8/RNF168-dependent ubiquitylation of histones at DSB's (69). A recently published study using ionizing radiation and radiomimetic drugs to induce DSBs in mitotic cells did not identify ubiquitin modifications on chromatin or IR-induced foci (IRIF) formation by ubiquitin, RNF8 or RNF168 (29). It was interpreted that these enzymes are not recruited to the damage sites and no ubiquitylation occurs at the damage sites in mitosis (29). However, the study was relying on IRIF formation, which was shown to be distinct from the initial recruitment of the factors and entails further clustering of proteins and amplification of signals surrounding the damage sites (6,42). Since laser systems will generate high-density DNA breaks in a highly focused area, it is possible to detect the recruitment of factors that do not form IRIF (4,19,42,70). This is consistent with the fact that the recruitment of Ku, which does not form IRIF, is clearly detectable in the current study. Detection of Ku at the damage sites is not possible with conventional damaging methods such as irradiation. Thus, our results suggest that the initial recruitment of Ub ligases and local ubiquitylation does occur at the damage sites even in mitosis. In agreement with the recent study (29), however, the secondary signal amplification process (IRIF formation) may be impaired in mitosis. Our results show that ubiquitin appears to strictly co-localize with the dark material and Ku but not γH2AX on mitotic chromosomes, indicating that spreading of the Ub signal is limited in mitosis. In contrast, cells followed for up to 2 h after mitosis demonstrate that the ubiquitin signal spreads to the surrounding chromatin and only slightly overlaps the dark material in G1 phase (Figure 10e). This staining pattern is similar to that observed in our results where γH2AX immunofluorescence surrounds the dark material, the Nbs1, and the Ku proteins in laser micro-irradiated chromosomes. It is also reminiscent of previous findings in interphase cells where γH2AX surrounds Mre11 (70). Thus, the results suggest that the initial Ub response occurs at the damage sites in mitosis, but its spreading or IRIF formation does not occur until cells enter G1. Additional studies are required to determine whether the same RNF8 pathway is induced or whether other ubiquitin ligases and target(s) may be involved in response to mitotic damage.
The ultrastructural results in combination with the localization of known DNA damage response proteins [Nbs1 and Ku] as well as recruitment of the fusion protein GFP-Nbs1 to the same sites as the phase dark material, support the hypothesis that the phase dark regions are formed as a result of recruitment of DNA damage response factors. The accumulation of GFP-Nbs1 is observed to take place in a similar manner to the appearance of the phase dark material. Both are spherically shaped and both occur within the same time frame and at the same location. Importantly, we observed that the absence of the phase dark material is associated with the absence of Nbs1. For example, a cell fixed 1–2 s post-laser, and prior to the formation of the phase dark material, does not show fluorescence in the area targeted by the laser when immunostained for Nbs1 (Figure 6d). Taken together, the spatial, temporal and co-localization results are consistent with the hypothesis that the phase dark material represents the accumulation of DSB response and repair factors at the laser exposure site.
Irradiated chromosome regions were significantly altered as evidenced by negative staining for DAPI, phospho-H3 and γH2AX. However, the chromatin adjacent to the Nbs1-fluorescent phase dark material does fluoresce positively for γH2AX, a DSB marker known to spread 1–3 Mb beyond DNA breaks (1,60,71). This suggests that both the fs NIR and the ns green lasers have generated a DSB response in the area surrounding the localized laser irradiation site but the DNA directly within the laser focal point has been changed into fragments that are either unrecognizable by the stain or they have floated away from the damaged area. The fact that γH2AX does not completely overlap with the phase dark material, as observed with Nbs1, suggests that histone protein has been damaged but it is not part of the phase dark material (Figures 4 and 5). Kim et al. had similar results in interphase cells where Mre11 was surrounded by γH2AX (70). In our studies, staining for phospho-H3 (Ser 10) confirms that there is a lack of recognizable histone protein at the lesion (Figure 7c and m). These results are likely due to indiscriminate laser damage to the proteins (histones) in the irradiation area (70).
Laser-irradiated mitotic cells enter G1
Fourteen cells damaged with the femtosecond laser and followed by time-lapse microscopy completed mitosis in a timely manner. These results are consistent with previous experiments that demonstrated the ability of PtK1 cells to complete mitosis after green nanosecond chromosome irradiation (5). In addition to determining that laser-irradiated cells could finish mitosis and enter G1, we were able to visually track the dark damage material into G1. Two hours post-mitosis the dark material was still overlapped by Ku and Nbs1. This demonstrates that DNA damage created in mitosis is not fully repaired by the time the cell enters G1. In addition, the dark material is observed near the newly formed nuclear envelope for all cells followed from mitosis. These findings are reminiscent of previous studies done in yeast that found DSBs are relocated to the nuclear periphery (72,73).
CONCLUSIONS
In summary our results show that: (i) the ns green and fs NIR lasers are capable of forming chromosomal alterations that are comparable to each other at both the light and electron microscope levels; (ii) the phase paling observed within 1–2 s of laser microirradiation is correlated with either an alteration or lack of chromatin as confirmed by electron microscopy, DAPI, γH2AX and phospho-histone H3 (ser 10) staining; (iii) the formation of phase dark material is related to the accumulation of DNA damage response proteins, particularly Nbs1, Ku and ubiquitinated proteins; (iv) DNA damage created in mitosis is not completely repaired as evidenced by the localization of Ku and Nbs1 to the damage followed to G1; and (v) cells will complete cell division following laser microirradiation of chromosomes. It is clear from this study, that the cells’ DSB recognition and repair pathways are activated when mitotic chromosomes are damaged, and that recruitment of GFP-Nbs1 is much slower in mitotic cells than in interphase cells. Further studies are necessary to elucidate the mechanism by which ubiquitination localization is changing from mitosis to interphase.
Supplementary Data
Supplementary Data are available at NAR Online.
Funding
National Institutes of Health Laser Microbeam and Medical Program (RR01192); the Air Force Office of Scientific Research (FA9550-04-1-0101); Beckman Laser Institute Inc. Foundation (to M.W.B.); National Institutes of Health (CA100710 to K.Y.); National Institutes of Health pre-doctoral fellowship (Minority Biomedical Research Support-GM-55246 to V.G.-G.). Funding for open access charge: UC-Irvine; Beckman Laser Institute, Robolase Various Donors Account.
Conflict of interest statement. None declared.
Supplementary Material
ACKNOWLEDGEMENTS
We would like to thank Charlie Chandsawangbhuwana for the calculations of damaged chromatin observed under serial section electron microscopy.
REFERENCES
- 1.Rogakou EP, Boon C, Redon C, Bonner WM. Megabase chromatin domains involved in DNA double-strand breaks in vivo. J. Cell Biol. 1999;146:905–916. doi: 10.1083/jcb.146.5.905. [DOI] [PMC free article] [PubMed] [Google Scholar]
- 2.Paull TT, Rogakou EP, Yamazaki V, Kirchgessner CU, Gellert M, Bonner WM. A critical role for histone H2AX in recruitment of repair factors to nuclear foci after DNA damage. Curr. Biol. 2000;10:886–895. doi: 10.1016/s0960-9822(00)00610-2. [DOI] [PubMed] [Google Scholar]
- 3.Tashiro S, Walter J, Shinohara A, Kamada N, Cremer T. Rad51 accumulation at sites of DNA damage and in postreplicative chromatin. J. Cell Biol. 2000;150:283–291. doi: 10.1083/jcb.150.2.283. [DOI] [PMC free article] [PubMed] [Google Scholar]
- 4.Kim JS, Krasieva TB, LaMorte V, Taylor AM, Yokomori K. Specific recruitment of human cohesin to laser-induced DNA damage. J. Biol. Chem. 2002;277:45149–45153. doi: 10.1074/jbc.M209123200. [DOI] [PubMed] [Google Scholar]
- 5.Mikhailov A, Cole RW, Rieder CL. DNA damage during mitosis in human cells delays the metaphase/anaphase transition via the spindle-assembly checkpoint. Curr. Biol. 2002;12:1797–1806. doi: 10.1016/s0960-9822(02)01226-5. [DOI] [PubMed] [Google Scholar]
- 6.Celeste A, Fernandez-Capetillo O, Kruhlak MJ, Pilch DR, Staudt DW, Lee A, Bonner RF, Bonner WM, Nussenzweig A. Histone H2AX phosphorylation is dispensable for the initial recognition of DNA breaks. Nat. Cell Biol. 2003;5:675–679. doi: 10.1038/ncb1004. [DOI] [PubMed] [Google Scholar]
- 7.Lukas C, Falck J, Bartkova J, Bartek J, Lukas J. Distinct spatiotemporal dynamics of mammalian checkpoint regulators induced by DNA damage. Nat. Cell Biol. 2003;5:255–260. doi: 10.1038/ncb945. [DOI] [PubMed] [Google Scholar]
- 8.Meldrum RA, Botchway SW, Wharton CW, Hirst GJ. Nanoscale spatial induction of ultraviolet photoproducts in cellular DNA by three-photon near-infrared absorption. EMBO Rep. 2003;4:1144–1149. doi: 10.1038/sj.embor.7400028. [DOI] [PMC free article] [PubMed] [Google Scholar]
- 9.Walter J, Cremer T, Miyagawa K, Tashiro S. A new system for laser-UVA-microirradiation of living cells. J. Microsc. 2003;209:71–75. doi: 10.1046/j.1365-2818.2003.01117.x. [DOI] [PubMed] [Google Scholar]
- 10.Bradshaw PS, Stavropoulos DJ, Meyn MS. Human telomeric protein TRF2 associates with genomic double-strand breaks as an early response to DNA damage. Nat. Genet. 2005;37:193–197. doi: 10.1038/ng1506. [DOI] [PubMed] [Google Scholar]
- 11.Chen BP, Chan DW, Kobayashi J, Burma S, Asaithamby A, Morotomi-Yano K, Botvinick E, Qin J, Chen DJ. Cell cycle dependence of DNA-dependent protein kinase phosphorylation in response to DNA double strand breaks. J. Biol. Chem. 2005;280:14709–14715. doi: 10.1074/jbc.M408827200. [DOI] [PubMed] [Google Scholar]
- 12.Bekker-Jensen S, Lukas C, Kitagawa R, Melander F, Kastan MB, Bartek J, Lukas J. Spatial organization of the mammalian genome surveillance machinery in response to DNA strand breaks. J. Cell Biol. 2006;173:195–206. doi: 10.1083/jcb.200510130. [DOI] [PMC free article] [PubMed] [Google Scholar]
- 13.Mari PO, Florea BI, Persengiev SP, Verkaik NS, Bruggenwirth HT, Modesti M, Giglia-Mari G, Bezstarosti K, Demmers JA, Luider TM, et al. Dynamic assembly of end-joining complexes requires interaction between Ku70/80 and XRCC4. Proc. Natl Acad. Sci. USA. 2006;103:18597–18602. doi: 10.1073/pnas.0609061103. [DOI] [PMC free article] [PubMed] [Google Scholar]
- 14.Ziv Y, Bielopolski D, Galanty Y, Lukas C, Taya Y, Schultz DC, Lukas J, Bekker-Jensen S, Bartek J, Shiloh Y. Chromatin relaxation in response to DNA double-strand breaks is modulated by a novel ATM- and KAP-1 dependent pathway. Nat. Cell Biol. 2006;8:870–876. doi: 10.1038/ncb1446. [DOI] [PubMed] [Google Scholar]
- 15.Dinant C, de Jager M, Essers J, van Cappellen WA, Kanaar R, Houtsmuller AB, Vermeulen W. Activation of multiple DNA repair pathways by sub-nuclear damage induction methods. J. Cell Sci. 2007;120:2731–2740. doi: 10.1242/jcs.004523. [DOI] [PubMed] [Google Scholar]
- 16.Gomez-Godinez V, Wakida NM, Dvornikov AS, Yokomori K, Berns MW. Recruitment of DNA damage recognition and repair pathway proteins following near-IR femtosecond laser irradiation of cells. J. Biomed. Opt. 2007;12 doi: 10.1117/1.2717684. 020505. [DOI] [PubMed] [Google Scholar]
- 17.Mailand N, Bekker-Jensen S, Faustrup H, Melander F, Bartek J, Lukas C, Lukas J. RNF8 ubiquitylates histones at DNA double-strand breaks and promotes assembly of repair proteins. Cell. 2007;131:887–900. doi: 10.1016/j.cell.2007.09.040. [DOI] [PubMed] [Google Scholar]
- 18.Sartori AA, Lukas C, Coates J, Mistrik M, Fu S, Bartek J, Baer R, Lukas J, Jackson SP. Human CtIP promotes DNA end resection. Nature. 2007;450:509–514. doi: 10.1038/nature06337. [DOI] [PMC free article] [PubMed] [Google Scholar]
- 19.Kong X, Mohanty SK, Stephens J, Heale JT, Gomez-Godinez V, Shi LZ, Kim JS, Yokomori K, Berns MW. Comparative analysis of different laser systems to study cellular responses to DNA damage in mammalian cells. Nucleic Acids Res. 2009;37:e68. doi: 10.1093/nar/gkp221. [DOI] [PMC free article] [PubMed] [Google Scholar]
- 20.Stephens J, Mohanty SK, Genc S, Kong X, Yokomori K, Berns MW. Spatially sculpted laser scissors for study of DNA damage and repair. J. Biomed. Opt. 2009;14 doi: 10.1117/1.3213601. 054004. [DOI] [PMC free article] [PubMed] [Google Scholar]
- 21.Berns MW, Rounds DE, Olson RS. Effects of laser micro-irradiation on chromosomes. Exp. Cell Res. 1969;56:292–298. doi: 10.1016/0014-4827(69)90016-0. [DOI] [PubMed] [Google Scholar]
- 22.Berns MW, Olson RS, Rounds DE. In vitro production of chromosomal lesions with an argon laser microbeam. Nature. 1969;221:74–75. doi: 10.1038/221074a0. [DOI] [PubMed] [Google Scholar]
- 23.Berns MW, Cheng WK, Floyd AD, Onuki Y. Chromosome lesions produced with an argon laser microbeam without dye sensitization. Science. 1971;171:903–905. doi: 10.1126/science.171.3974.903. [DOI] [PubMed] [Google Scholar]
- 24.Berns MW, Chong LK, Hammer-Wilson M, Miller K, Siemens A. Genetic microsurgery by laser: establishment of a clonal population of rat kangaroo cells (PTK2) with a directed deficiency in a chromosomal nucleolar organizer. Chromosoma. 1979;73:1–8. doi: 10.1007/BF00294839. [DOI] [PubMed] [Google Scholar]
- 25.Liang H, Berns MW. Establishment of nucleolar deficient sublines of PtK2 (Potorous tridactylis) by ultraviolet laser microirradiation. Exp. Cell Res. 1983;144:234–240. doi: 10.1016/0014-4827(83)90461-5. [DOI] [PubMed] [Google Scholar]
- 26.Berns MW, Floyd AD, Adkisson K, Cheng WK, Moore L, Hoover G, Ustick K, Burgott S, Osial T. Laser microirradiation of the nucleolar organizer in cells of the rat kangaroo (Potorous tridactylis). Reduction of nucleolar number and production of micronucleoli. Exp. Cell Res. 1972;75:424–432. doi: 10.1016/0014-4827(72)90449-1. [DOI] [PubMed] [Google Scholar]
- 27.Misawa H, Koshioka M, Sasaki K, Kitamura N, Masuhara H. 3-dimensional optical trapping and laser ablation of a single polymer latex particle in water. J. Appl. Phy. 1991;70:3829–3836. [Google Scholar]
- 28.Viana NB, Rocha MS, Mesquita ON, Mazolli A, Neto PAM. Characterization of objective transmittance for optical tweezers. Appl. Opt. 2006;45:4263–4269. doi: 10.1364/ao.45.004263. [DOI] [PubMed] [Google Scholar]
- 29.Giunta S, Belotserkovskaya R, Jackson SP. DNA damage signaling in response to double-strand breaks during mitosis. J. Cell Biol. 190:197–207. doi: 10.1083/jcb.200911156. [DOI] [PMC free article] [PubMed] [Google Scholar]
- 30.Kang J, Ferguson D, Song H, Bassing C, Eckersdorff M, Alt FW, Xu Y. Functional interaction of H2AX, NBS1, and p53 in ATM-dependent DNA damage responses and tumor suppression. Mol. Cell Biol. 2005;25:661–670. doi: 10.1128/MCB.25.2.661-670.2005. [DOI] [PMC free article] [PubMed] [Google Scholar]
- 31.Hsu TC, Brinkley BR, Arrighi FE. The structure and behavior of the nucleolus organizer in mammalian cells. Chromosoma. 1967;23:137–153. doi: 10.1007/BF00331109. [DOI] [PubMed] [Google Scholar]
- 32.You Z, Shi LZ, Zhu Q, Wu P, Zhang YW, Basilio A, Tonnu N, Verma IM, Berns MW, Hunter T. CtIP links DNA double–strand break sensing to resection. Mol. Cell. 2009;36:954–969. doi: 10.1016/j.molcel.2009.12.002. [DOI] [PMC free article] [PubMed] [Google Scholar]
- 33.Botvinick EL, Venugopalan V, Shah JV, Liaw LH, Berns MW. Controlled ablation of microtubules using a picosecond laser. Biophys. J. 2004;87:4203–4212. doi: 10.1529/biophysj.104.049528. [DOI] [PMC free article] [PubMed] [Google Scholar]
- 34.Botvinick EL, Berns MW. Internet-based robotic laser scissors and tweezers microscopy. Microsc. Res. Tech. 2005;68:65–74. doi: 10.1002/jemt.20216. [DOI] [PubMed] [Google Scholar]
- 35.Rasband WS. ImageJ, U.S. National Institutes of Health. Bethesda, MA, USA: 1997–2009. http://rsb.info.nih.gov/ij/ [Google Scholar]
- 36.Rattner JB, Berns MW. Light and electron microscopy of laser microirradiated chromosomes. J. Cell Biol. 1974;62:526–533. doi: 10.1083/jcb.62.2.526. [DOI] [PMC free article] [PubMed] [Google Scholar]
- 37.Meredith S, Berns MW. Light and electron microscopy of laser microirradiated nucleoli and nucleoplasm in tissue culture cells. Cor. Vasa. 1976;18:785–804. [PubMed] [Google Scholar]
- 38.Liaw LH, Berns MW. Electron microscope autoradiography on serial sections of preselected single living cells. J. Ultrastruct. Res. 1981;75:187–194. doi: 10.1016/s0022-5320(81)80134-7. [DOI] [PubMed] [Google Scholar]
- 39.Bloom W, Leider RJ. Optical and electron microscopic changes in ultraviolet irradiated chromosome segments. J. Cell Biol. 1962;13:269–301. doi: 10.1083/jcb.13.2.269. [DOI] [PMC free article] [PubMed] [Google Scholar]
- 40.Uretz RB, Bloom W, Zirkle RE. Irradiation of parts of individual cells. II. Effects of an ultraviolet microbeam focused on parts of chromosomes. Science. 1954;120:197–199. doi: 10.1126/science.120.3110.197. [DOI] [PubMed] [Google Scholar]
- 41.Berns MW. Laser microirradiation of chromosomes. Cold Spring Harb. Symp. Quant. Biol. 1974;38:165–174. doi: 10.1101/sqb.1974.038.01.020. [DOI] [PubMed] [Google Scholar]
- 42.Kim JS, Krasieva TB, Kurumizaka H, Chen DJ, Taylor AM, Yokomori K. Independent and sequential recruitment of NHEJ and HR factors to DNA damage sites in mammalian cells. J. Cell Biol. 2005;170:341–347. doi: 10.1083/jcb.200411083. [DOI] [PMC free article] [PubMed] [Google Scholar]
- 43.Calmettes PP, Berns MW. Laser-induced multiphoton processes in living cells. Proc. Natl Acad. Sci. USA. 1983;80:7197–7199. doi: 10.1073/pnas.80.23.7197. [DOI] [PMC free article] [PubMed] [Google Scholar]
- 44.Ponelies N, Bautz EK, Monajembashi S, Wolfrum J, Greulich KO. Telomeric sequences derived from laser-microdissected polytene chromosomes. Chromosoma. 1989;98:351–357. doi: 10.1007/BF00292388. [DOI] [PubMed] [Google Scholar]
- 45.Stark RW, Rubio-Sierra FJ, Thalhammer S, Heckl WM. Combined nanomanipulation by atomic force microscopy and UV-laser ablation for chromosomal dissection. Eur. Biophys. J. 2003;32:33–39. doi: 10.1007/s00249-002-0270-y. [DOI] [PubMed] [Google Scholar]
- 46.Steigemann P, Wurzenberger C, Schmitz MH, Held M, Guizetti J, Maar S, Gerlich DW. Aurora B-mediated abscission checkpoint protects against tetraploidization. Cell. 2009;136:473–484. doi: 10.1016/j.cell.2008.12.020. [DOI] [PubMed] [Google Scholar]
- 47.Khodjakov A, Cole RW, Bajer AS, Rieder CL. The force for poleward chromosome motion in Haemanthus cells acts along the length of the chromosome during metaphase but only at the kinetochore during anaphase. J. Cell Biol. 1996;132:1093–1104. doi: 10.1083/jcb.132.6.1093. [DOI] [PMC free article] [PubMed] [Google Scholar]
- 48.Konig K, Riemann I, Fritzsche W. Nanodissection of human chromosomes with near-infrared femtosecond laser pulses. Opt. Lett. 2001;26:819–821. doi: 10.1364/ol.26.000819. [DOI] [PubMed] [Google Scholar]
- 49.Rieder CL, Cole RW, Khodjakov A, Sluder G. The checkpoint delaying anaphase in response to chromosome monoorientation is mediated by an inhibitory signal produced by unattached kinetochores. J. Cell Biol. 1995;130:941–948. doi: 10.1083/jcb.130.4.941. [DOI] [PMC free article] [PubMed] [Google Scholar]
- 50.Rieder CL, Cole RW. Entry into mitosis in vertebrate somatic cells is guarded by a chromosome damage checkpoint that reverses the cell cycle when triggered during early but not late prophase. J. Cell Biol. 1998;142:1013–1022. doi: 10.1083/jcb.142.4.1013. [DOI] [PMC free article] [PubMed] [Google Scholar]
- 51.Liang H, Wright WH, Rieder CL, Salmon ED, Profeta G, Andrews J, Liu Y, Sonek GJ, Berns MW. Directed movement of chromosome arms and fragments in mitotic newt lung cells using optical scissors and optical tweezers. Exp. Cell Res. 1994;213:308–312. doi: 10.1006/excr.1994.1203. [DOI] [PubMed] [Google Scholar]
- 52.Liang H, Wright WH, Cheng S, He W, Berns MW. Micromanipulation of chromosomes in PTK2 cells using laser microsurgery (optical scalpel) in combination with laser-induced optical force (optical tweezers) Exp. Cell Res. 1993;204:110–120. doi: 10.1006/excr.1993.1015. [DOI] [PubMed] [Google Scholar]
- 53.Rieder CL, Davison EA, Jensen LC, Cassimeris L, Salmon ED. Oscillatory movements of monooriented chromosomes and their position relative to the spindle pole result from the ejection properties of the aster and half-spindle. J. Cell Biol. 1986;103:581–591. doi: 10.1083/jcb.103.2.581. [DOI] [PMC free article] [PubMed] [Google Scholar]
- 54.Skibbens RV, Rieder CL, Salmon ED. Kinetochore motility after severing between sister centromeres using laser microsurgery: evidence that kinetochore directional instability and position is regulated by tension. J. Cell Sci. 1995;108(Pt 7):2537–2548. doi: 10.1242/jcs.108.7.2537. [DOI] [PubMed] [Google Scholar]
- 55.He W. Ph.D. Thesis. Irvine: University of California Irvine; 1995. Laser Microdissection and its application to the human tuberous sclerosis 1 gene region on chromosome 9q34. [Google Scholar]
- 56.He W, Liu Y, Smith M, Berns MW. Laser microdissection for generation of a human chromosome region-specific library. Microsc. Microanal. 1997;3:5. [Google Scholar]
- 57.Erenpreisa EA, Zirne RA. [Method of contrast enhancement of DNA-containing structures on ultrathin sections] Biull. Eksp. Biol. Med. 1980;89:747–748. [PubMed] [Google Scholar]
- 58.Maser RS, Monsen KJ, Nelms BE, Petrini JH. hMre11 and hRad50 nuclear foci are induced during the normal cellular response to DNA double-strand breaks. Mol. Cell Biol. 1997;17:6087–6096. doi: 10.1128/mcb.17.10.6087. [DOI] [PMC free article] [PubMed] [Google Scholar]
- 59.Uziel T, Lerenthal Y, Moyal L, Andegeko Y, Mittelman L, Shiloh Y. Requirement of the MRN complex for ATM activation by DNA damage. EMBO J. 2003;22:5612–5621. doi: 10.1093/emboj/cdg541. [DOI] [PMC free article] [PubMed] [Google Scholar]
- 60.Rogakou EP, Pilch DR, Orr AH, Ivanova VS, Bonner WM. DNA double-stranded breaks induce histone H2AX phosphorylation on serine 139. J. Biol. Chem. 1998;273:5858–5868. doi: 10.1074/jbc.273.10.5858. [DOI] [PubMed] [Google Scholar]
- 61.Lavin MF. ATM and the Mre11 complex combine to recognize and signal DNA double-strand breaks. Oncogene. 2007;26:7749–7758. doi: 10.1038/sj.onc.1210880. [DOI] [PubMed] [Google Scholar]
- 62.Mirzoeva OK, Petrini JH. DNA replication-dependent nuclear dynamics of the Mre11 complex. Mol. Cancer Res. 2003;1:207–218. [PubMed] [Google Scholar]
- 63.Czornak K, Chughtai S, Chrzanowska KH. Mystery of DNA repair: the role of the MRN complex and ATM kinase in DNA damage repair. J. Appl. Genet. 2008;49:383–396. doi: 10.1007/BF03195638. [DOI] [PubMed] [Google Scholar]
- 64.Tauchi H, Kobayashi J, Morishima K, Matsuura S, Nakamura A, Shiraishi T, Ito E, Masnada D, Delia D, Komatsu K. The forkhead-associated domain of NBS1 is essential for nuclear foci formation after irradiation but not essential for hRAD50-hMRE11-NBS1 complex DNA repair activity. J. Biol. Chem. 2001;276:12–15. doi: 10.1074/jbc.C000578200. [DOI] [PubMed] [Google Scholar]
- 65.Kobayashi J, Tauchi H, Sakamoto S, Nakamura A, Morishima K, Matsuura S, Kobayashi T, Tamai K, Tanimoto K, Komatsu K. NBS1 localizes to gamma-H2AX foci through interaction with the FHA/BRCT domain. Curr. Biol. 2002;12:1846–1851. doi: 10.1016/s0960-9822(02)01259-9. [DOI] [PubMed] [Google Scholar]
- 66.Lukas C, Melander F, Stucki M, Falck J, Bekker-Jensen S, Goldberg M, Lerenthal Y, Jackson SP, Bartek J, Lukas J. Mdc1 couples DNA double-strand break recognition by Nbs1 with its H2AX-dependent chromatin retention. EMBO J. 2004;23:2674–2683. doi: 10.1038/sj.emboj.7600269. [DOI] [PMC free article] [PubMed] [Google Scholar]
- 67.Lawrence JB, Villnave CA, Singer RH. Sensitive, high-resolution chromatin and chromosome mapping in situ: presence and orientation of two closely integrated copies of EBV in a lymphoma line. Cell. 1988;52:51–61. doi: 10.1016/0092-8674(88)90530-2. [DOI] [PubMed] [Google Scholar]
- 68.Koshland D, Strunnikov A. Mitotic chromosome condensation. Annu. Rev. Cell Dev. Biol. 1996;12:305–333. doi: 10.1146/annurev.cellbio.12.1.305. [DOI] [PubMed] [Google Scholar]
- 69.Kolas NK, Chapman JR, Nakada S, Ylanko J, Chahwan R, Sweeney FD, Panier S, Mendez M, Wildenhain J, Thomson TM, et al. Orchestration of the DNA-damage response by the RNF8 ubiquitin ligase. Science. 2007;318:1637–1640. doi: 10.1126/science.1150034. [DOI] [PMC free article] [PubMed] [Google Scholar]
- 70.Kim JS, Heale JT, Zeng W, Kong X, Krasieva TB, Ball AR, Jr, Yokomori K. In situ analysis of DNA damage response and repair using laser microirradiation. Methods Cell Biol. 2007;82:377–407. doi: 10.1016/S0091-679X(06)82013-3. [DOI] [PubMed] [Google Scholar]
- 71.Bewersdorf J, Bennett BT, Knight KL. H2AX chromatin structures and their response to DNA damage revealed by 4Pi microscopy. Proc. Natl Acad. Sci. USA. 2006;103:18137–18142. doi: 10.1073/pnas.0608709103. [DOI] [PMC free article] [PubMed] [Google Scholar]
- 72.Nagai S, Dubrana K, Tsai-Pflugfelder M, Davidson MB, Roberts TM, Brown GW, Varela E, Hediger F, Gasser SM, Krogan NJ. Functional targeting of DNA damage to a nuclear pore-associated SUMO-dependent ubiquitin ligase. Science. 2008;322:597–602. doi: 10.1126/science.1162790. [DOI] [PMC free article] [PubMed] [Google Scholar]
- 73.Oza P, Jaspersen SL, Miele A, Dekker J, Peterson CL. Mechanisms that regulate localization of a DNA double-strand break to the nuclear periphery. Genes Dev. 2009;23:912–927. doi: 10.1101/gad.1782209. [DOI] [PMC free article] [PubMed] [Google Scholar]
Associated Data
This section collects any data citations, data availability statements, or supplementary materials included in this article.